
10/12 Nikkei 225 daily chart 5-minute interval reflection【Japan Stock Trading Essentials】
How to Find Free Public Entry Points
Here are the basic methods for stock trading
Here are paid-grade trading techniques
How to aim for rapid gains with maniac stocks that move as a manipulated stock group
We deliver techniques, market conditions, and fundamentals
This is a newsletter that will surely be useful.
Japanese Stock Trading Essentials
Title: 10/12 Recalling the Nikkei 225 Daily Chart 5-Minute Chart [Japanese Stock Trading Essentials]
Source: Amigo Investment School
This article is protected by copyright; the content copyright belongs to the author.
On this page we will discuss the theme of recalling the Nikkei 225 daily chart on 10/12 using a 5-minute chart.
To access more information and subscribe at a discount, regular subscriptions are recommended.
We will review the day's movement of the Nikkei 225 using a 5-minute chart.
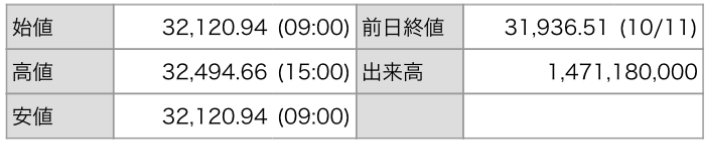
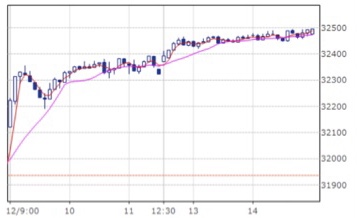
In the morning session, two large bullish candles started with strong bodies.
About 15 minutes into the morning session, a candle with a long lower shadow and a small body, called a 'colorful' (catered) candle, appeared.
When two large bullish candles (bullish candles with long bodies) appear, followed by a bullish candle with a small body and a long lower shadow, this can be interpreted as a signal for a counter-trend.
In other words, if the price is in an uptrend, this pattern suggests that the price may reverse and fall.
Subsequently, a bearish candle appeared as suggested by that long-lower-shadow bullish candle, and the price declined.