
Explain candlestick patterns. Doji and bullishdoji? Actually "陰線丸坊主" and "陽線丸坊主" refer to long upper/lower shadowless candles in Japanese stock trading.
How to Find Free Public Entry Points
Here are the basic methods for stock trading
Here are paid-grade trading techniques
How to aim for rapid gains with a manicured stock that moves like a manipulable stock
Delivering techniques, market conditions, and fundamentals
A newsletter series that is surely useful.
Japanese Stock Trading Essentials
Title: Explaining candlestick patterns. Doji in which the body is hollow, bullish doji【Japanese Stock Trading Essentials】
Issuer: Amigo Investment School
This article's copyright belongs to the author and is protected under copyright law.
This page explains candlestick patterns. Doji with a hollow body and bullish doji are the topics.We will discuss these concepts.
To access more information and subscribe at a favorable rate, we recommend a regular subscription.
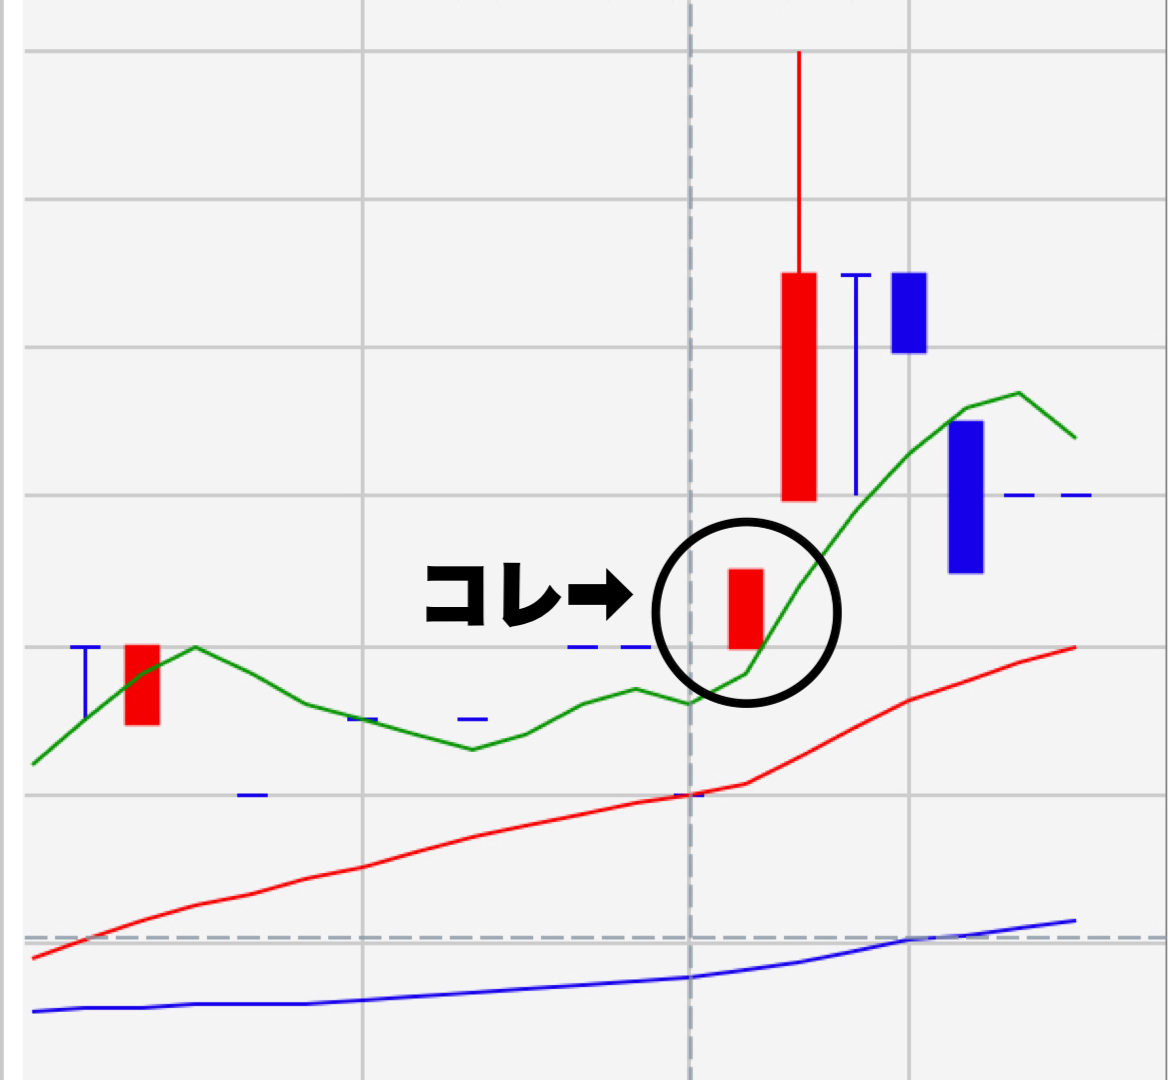
This is a 5-minute chart.
If you view it together with the image below,
the red candlestick circled in black is
a form known as bullish doji (bullish doji with a hollow body).
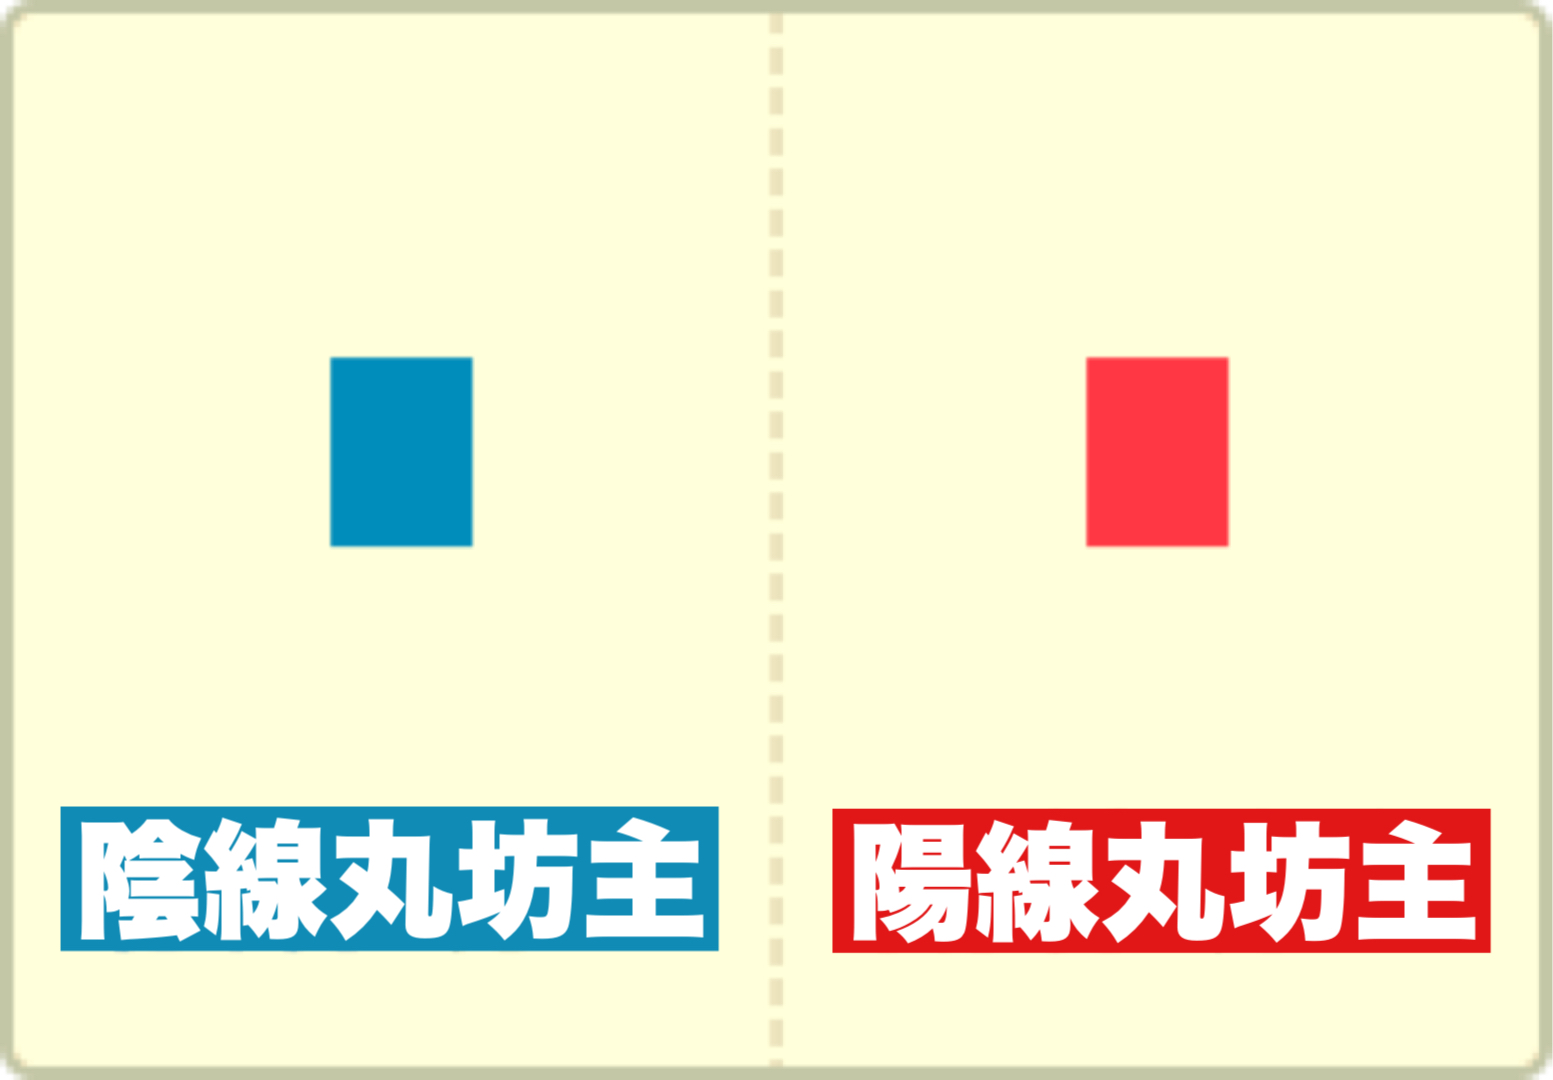
Bullish doji and bearish doji on candlestick charts are terms frequently used in stock price charts and candlestick charts.
The candlestick pattern in this form is more commonly seen on shorter timeframes such as minute charts than on daily charts.
Below are the meanings of each.
Also, we explain patterns that are prone to occur after a bullish doji appears.