

Cross trading, candlestick window tricks, how to read the Nikkei 225 chart【Secrets of Japanese Stock Trading】
How to Find Free Public Entry Points
Basic stock trading techniques are here
Premium-grade trading techniques are here
How to target sharp surges in obsure stocks that exhibit manipulated move
Delivering techniques, market trends, and fundamentals
This is a newsletter series that is surely useful.
Japan Stock Trading Essentials
Title: Cross trading, candlestick gap tricks, how to read the Nikkei 225 chart [Japan Stock Trading Essentials]
Source: Amigo Investment School
This article is copyrighted by the author under copyright law and protected.
This page explains the topics of cross trading, candlestick gap tricks, and how to read the Nikkei average chart.
To access more information and subscribe more economically, a regular subscription is recommended.
First, please take a look at this chart.
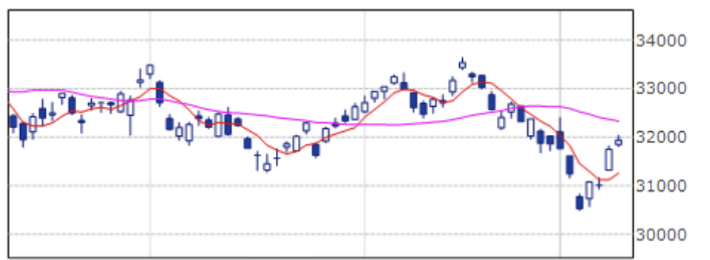
This is the three-month daily chart of the Nikkei Average, essential for swing trading.
Counting from the right, the third one
a candlestick has formed a cross shape.
That became a gap, and there is evidence of candlestick gap trading
being performed.
Also, there are distinctive signals on the 5-day moving average
and the 25-day moving average.