

Utilization of the "Visualisation Indicator" (Part 115)
“Visualization Indicator” usage (its115)
1. To further evolve the “28 Currency Pairs List Indicator,”
“8CP Visualization Indicator” to drawAUDJPYon
“8CP Visualization Indicator” includesOceania edition,London edition,New York edition,AnyCP edition. This time, I used theOceania edition.
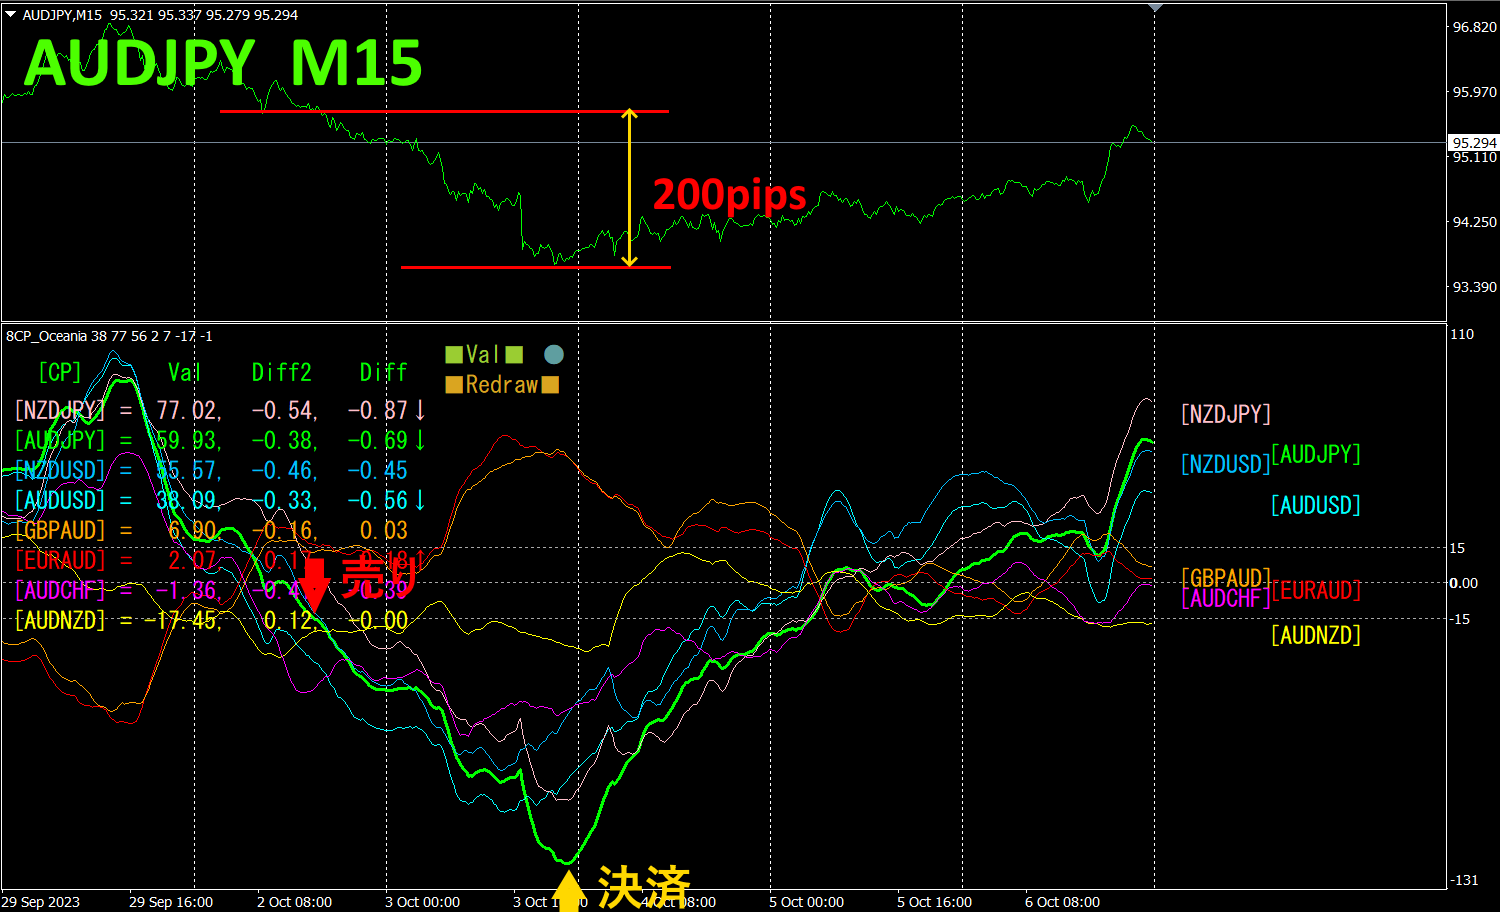
The upper half is theAUDJPY 15-minute chart. The lower half is from the “8CP Visualization Indicator.” The green thick-line graph corresponds toAUDJPY.
On Monday,AUDJPY fell below another threshold, so I entered a short position. I will close the position on Tuesday when the chart reaches a bottom.Approximately200pips of profit was realized.
2. Best Select Try the indicator
The following figure is a screenshot taken on2023 year October 4 day 00:39 (JST)
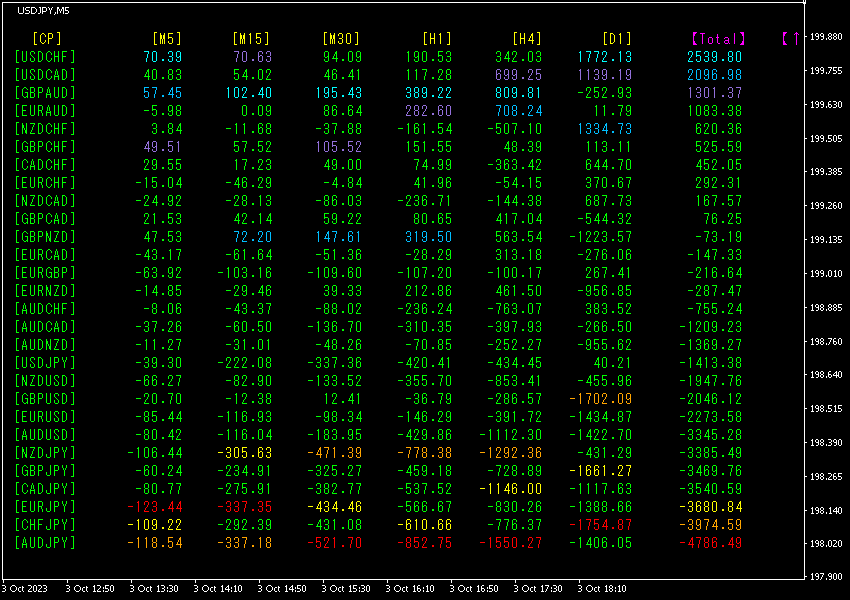
Values are sorted in descending order. The last row’sAUDJPY shows red coloring for all timeframes except the daily chart, and the value is, a large negative number. This indicates a strong downtrend for.
Now, let’s look at the AUDJPY chart.
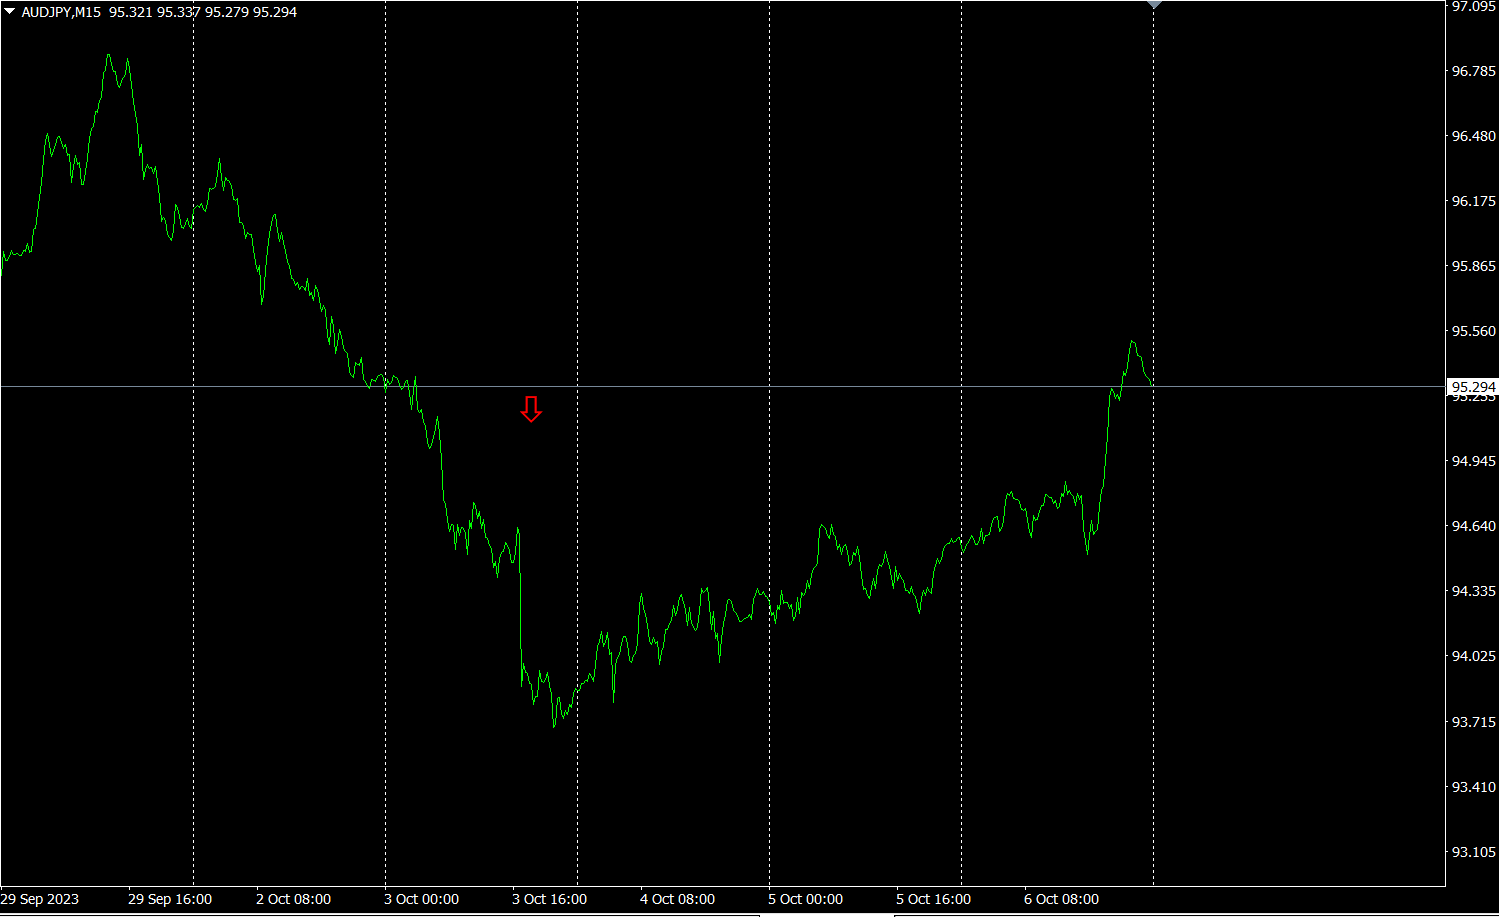
The red arrows indicate the point where the screenshot was taken. It captures a plunge in the middle of a downtrend on the right shoulder path.
“28 currency pairs Best Select indicator allows you to easily identify which currency among 28 pairs is showing the strongest trend. It also tells you, with numbers and colors, whether you should trade now. It enables you to judge all currency pairs at a glance.
“28 currency pairs Best Select Indicator”
https://www.gogojungle.co.jp/tools/indicators/35128

3. Since May of the year before last, what happened to EURJPY?
year month movement has been tracked.
To view the overall trend, a30 minute chart covering roughly the last3 weeks is drawn.
Last time, I wrote the following.
EUR is horizontal to slightly upward,JPY is slightly downward. There is little directional bias, but seems to be somewhat stronger.
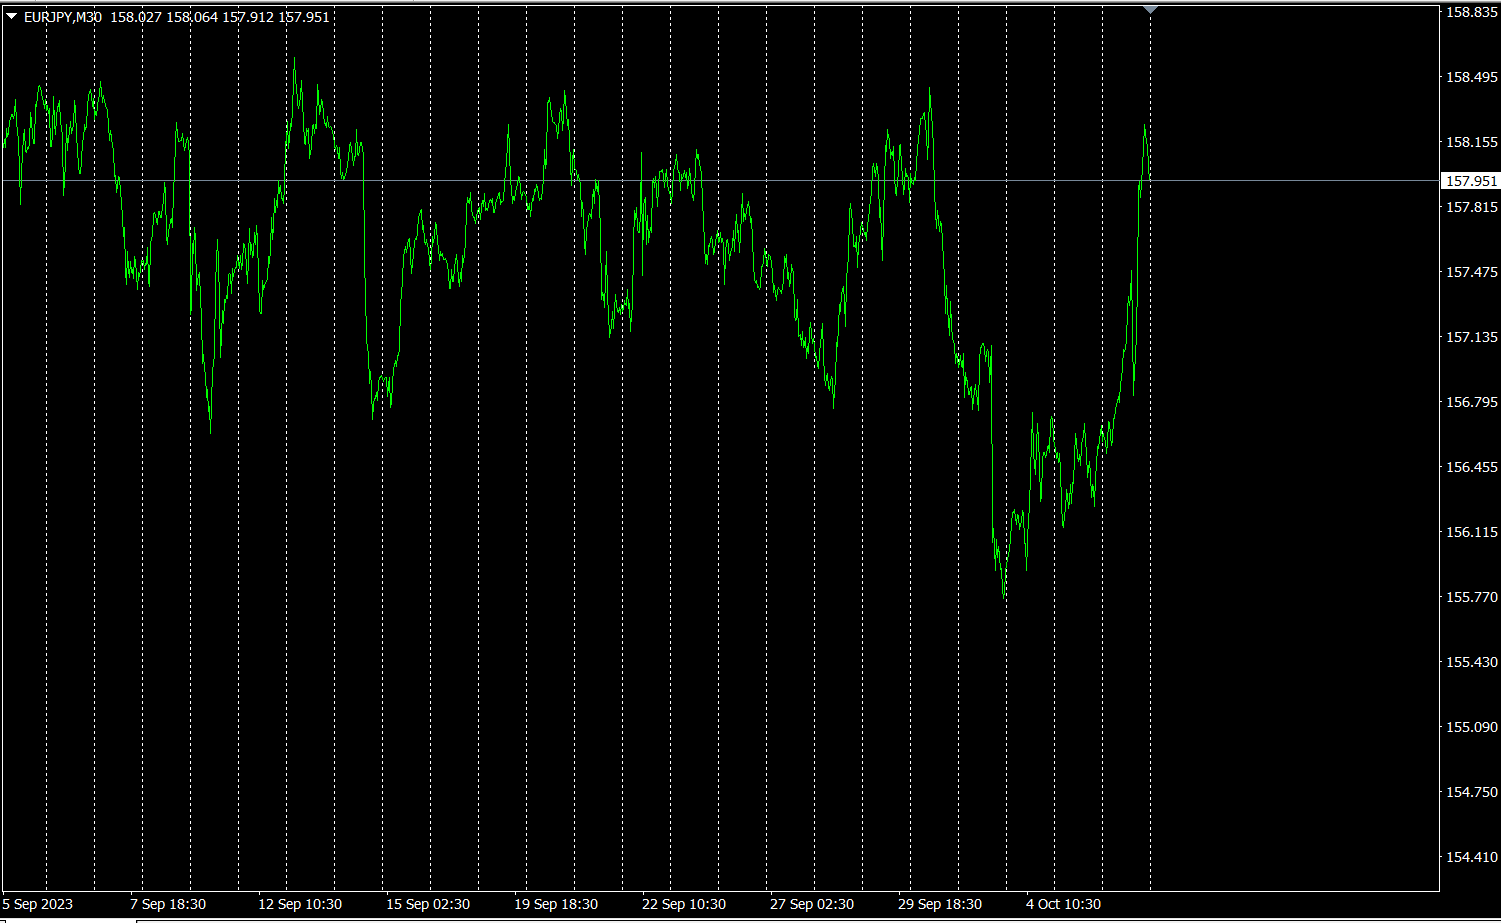
In the first half of the week it fell sharply, but recovered in the second half. It returned to the original level.
4hourly currency strength chart.
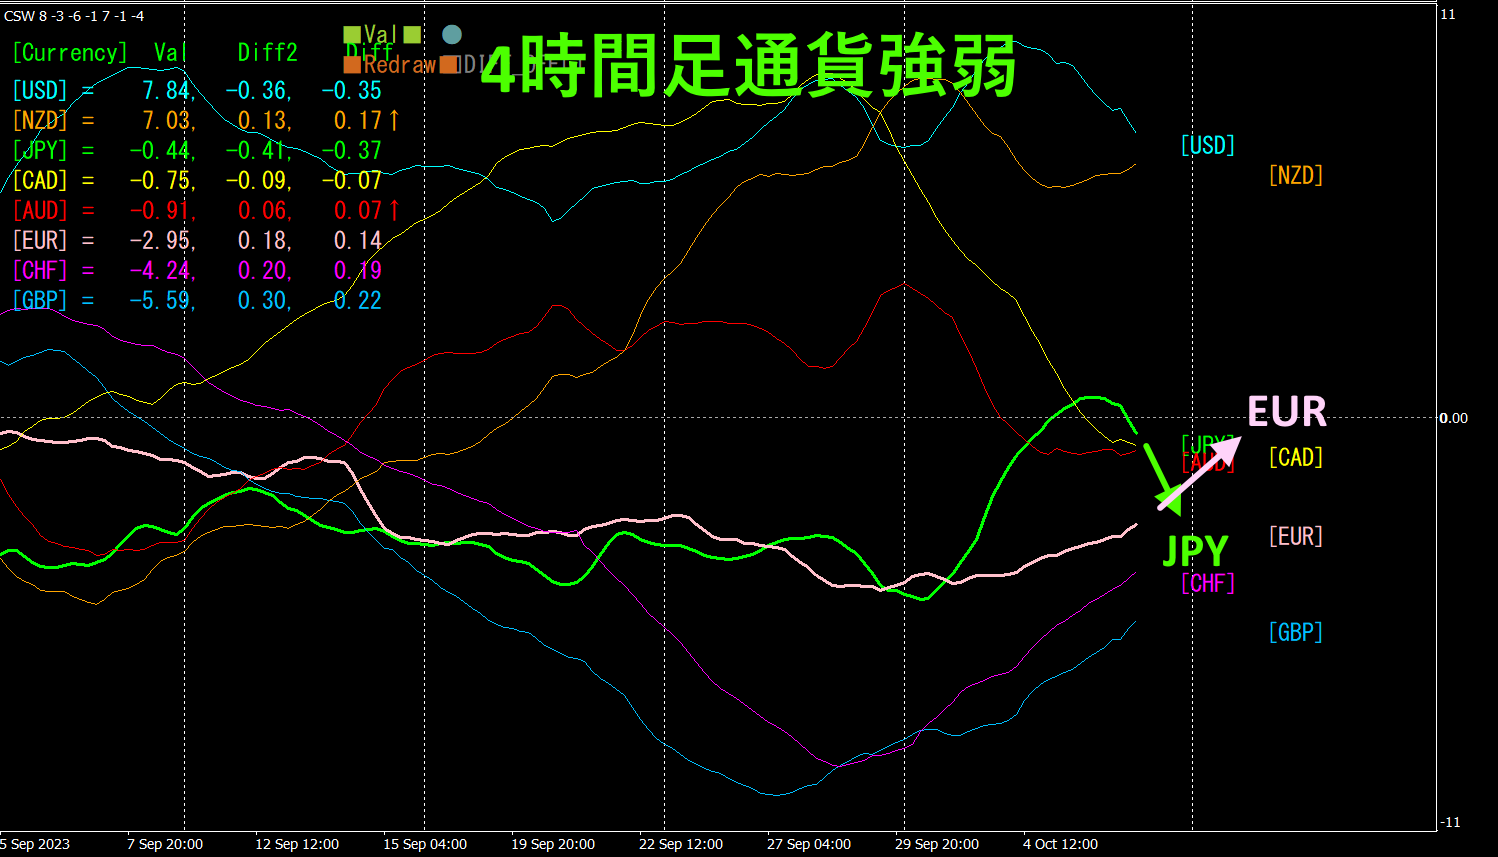
Pink isEUR, green isJPY. moved upward from a horizontal trend, initially rose but then reversed and moved downward. Overall, tends to be stronger than. Going forward, is expected to rise.
4. From all currency pairs, finding the bottom and building a trend strategy (target USDCHF))
2505 “Tend-bottom Search Indicator” used to locate the next target currency pair.
chart

is in the phase of “bottom reversal,” so I drew descending lines like steps ①–⑤, and when price breaks above these lines, I entered longs repeatedly. I held a long position, but since it broke below the upward trend line[1],, I closed to take profit.
Profit from closing position ① is about, about profit is realized.
Using “,” traders would surely have earned substantial profits.
Swiss Franc yen per 1 lot trade, so profit in JPY would be,
[1]: 1Lot * 0.0330 * 100000 * 164 = \541,200
[2]: 1Lot * 0.0260 * 100000 * 164 = \426,400.
With a semi-automatic “,” you can draw diagonal descending lines in advance, and when price breaks above this line, it automatically buys, and if it breaks above the rising line, it automatically closes for you, enabling hands-off trading.
USDCHF target trades yielded large profits, so this section ends here.
※“”

https://www.gogojungle.co.jp/tools/indicators/42257
“ Currency Strength Visualization Indicator
MT4 version https://www.gogojungle.co.jp/tools/indicators/39150
version https://www.gogojungle.co.jp/tools/indicators/39159
【My listed products】


