

Astonishing scalping and unusual hedging in FX that billion traders are doing【EA version】
Good morning everyone.
I have replied to all the messages I received from last night through this morning.
If there are people who have not yet received messages, please let me know via a message.
I have summarized important things about trading.
↓
[Definitive Edition] Billionaire Trader Scalping & Not-Ordinary Hedging
As of 9:55 AM on Goto day, the Tokyo spot time is in a place like this on the chart.
For billionaire traders who are scalping, if you replace the 1-minute chart with the 1-hour chart, you will quickly understand what kind of line this is.
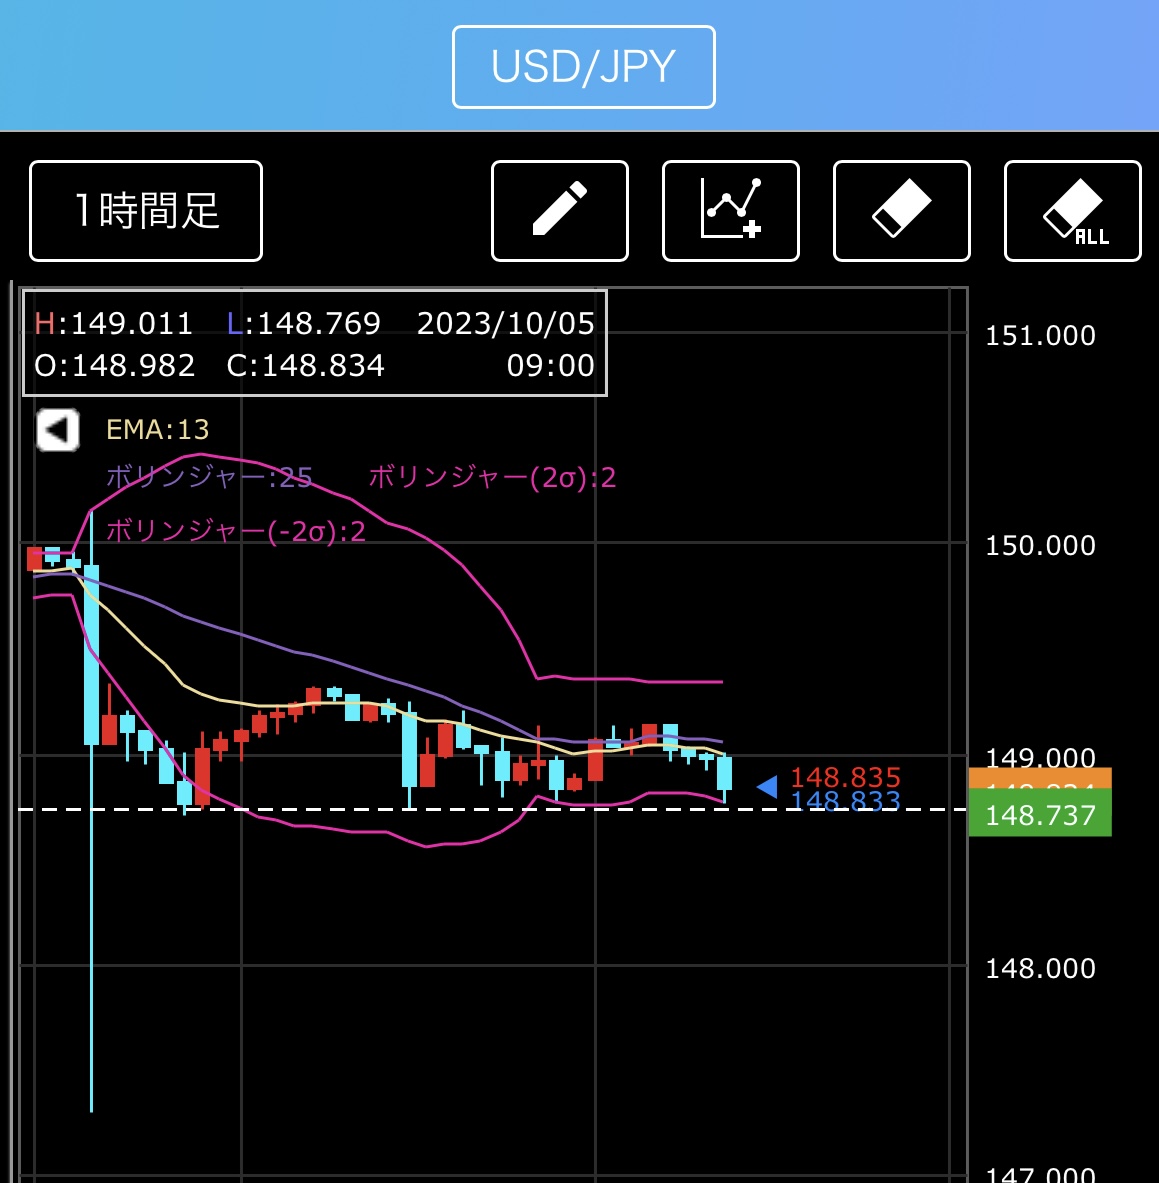
If you break here, there is a possibility to move all the way to the tip of the wick, so
it may be good to watch the 1-minute billionaire trader chart carefully, and monitor with a slightly biased short position in mind.
As of just before 10:00, on the 1-hour chart, we have fallen below an important line.
The chart below is the USD/JPY 1-minute chart from just after 10 p.m. last night to around 2 a.m.
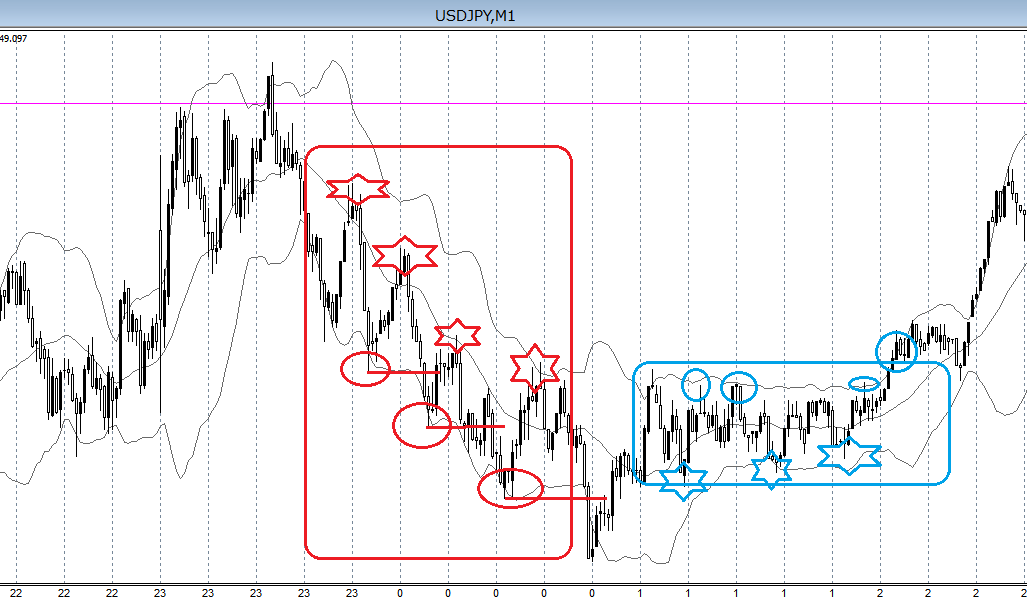
Although this pair typically moves like this chart, it has been oscillating upward, downward, and in a range.
When I start trading, whether I see red □ zone or blue □ zone will determine my trading strategy.
In the billionaire trader scalping manual, trading in the blue □ zone is not encouraged, but if you were simply going long aiming for a breakout and got caught at a high price, isn’t that when you cut losses, perhaps when you grab the blue ○ inside the blue □ zone?
I would like to examine this area more carefully in the explanation.
Personally, I prefer short positions.
From years of observing charts, especially for yen pairs, whether FX or domestic/foreign options,
I feel that shorts are advantageous, I imagine.
This is based on the idea that when the price you bought goes down, you want to get out quickly—a psychological factor in play.
To all billionaire trader scalping users, focus on the red ○ and red ☆ inside the red zone,
and look at your own chart.
In particular, the relation of the returning red ☆ while watching volume and the billionaire trader line, and other relationships.
Profits from red line breaks and the relation to returning red ☆, etc.
And next, the blue □ zone.
I think billionaire trader scalping users have watched this sideways zone many times after a trend ends.
In other words, this is a range, and it moves like a textbook of ranges.
What can be done in this blue □ zone is not in the manual, but “counter-trend trading”
and then the possibility of a breakout later aiming for a breakout.
Counter-trend trading is about whether to S (short) on the upper side or L (long) on the lower side; which is easier to understand and which makes it easier to accept a loss if it happens. Considering the psychological aspect, I, following the billionaire trader scalping chart that since it has fallen until now, it will rise next, choose the L position and go long at the lower side.
And next, it is clear where the recent low is and the price range is reasonably small.
The final option is, if an L position here succeeds, moving the stop and holding the L position until a sell signal appears, potentially taking the entire upward trend as a hopeful projection.
Keeping these in mind, I will choose L from the bottom.
Predictions from a range are a sequence of choices.
If you pre-pick choices like this to some extent, you can take positions without hesitation in similar situations.
If you simply aim for a breakout in the blue □ zone, the most right blue ○ would be the target.
The value of testing with this blue ○ is that it has not surpassed the highest price within the blue □,
since it is the first time it surpassed the rightmost blue ○, there is value in taking an L position.
Explaining with a chart that has been formed would become a desk theoretical exercise if focused on just that, but if you encounter such a scene in the future, looking at the chart this way and making decisions could be useful for your trades.
Be flexible and multi-faceted in your response.
I think it is both difficult and easy; the easy part is that for many years I have dreamed of charts so much that they come up in my dreams.
That is experience.
Readers of this article, you do not have to go through such struggles; what is written here is enough, so by monitoring the charts as described here, you can easily develop your own trading essence as a skill.
With that mindset, if you read Investment Navigator+, it should be quite a shortcut.
Thank you for your continued support today.
Big news & what billionaire traders are doing in scalping
The scalping done by billionaire traders
↓
https://www.gogojungle.co.jp/tools/indicators/42559
Stress-free irregular hedging (well, you won't lose initially)
Not-ordinary hedging in FX
↓
https://www.gogojungle.co.jp/tools/ebooks/19435