

A trading method that works well on any time frame and is highly reproducible!
We will introduce a simple and straightforward moving average method that works well on any currency pair, any time frame, with high reproducibility and clearly defined trading conditions, so anyone can make the same judgments.
The logic is here ↓

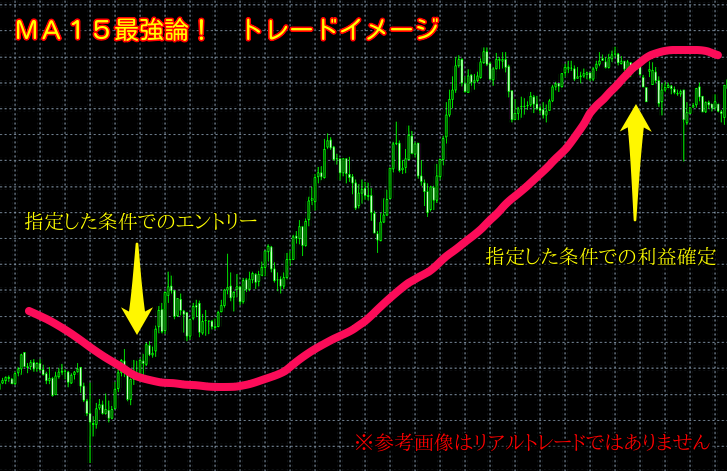
The MA-15 strongest theory! Recommendation for a moving average method that works well
The trading image looks like this ↓
The main features of this logic are here ↓
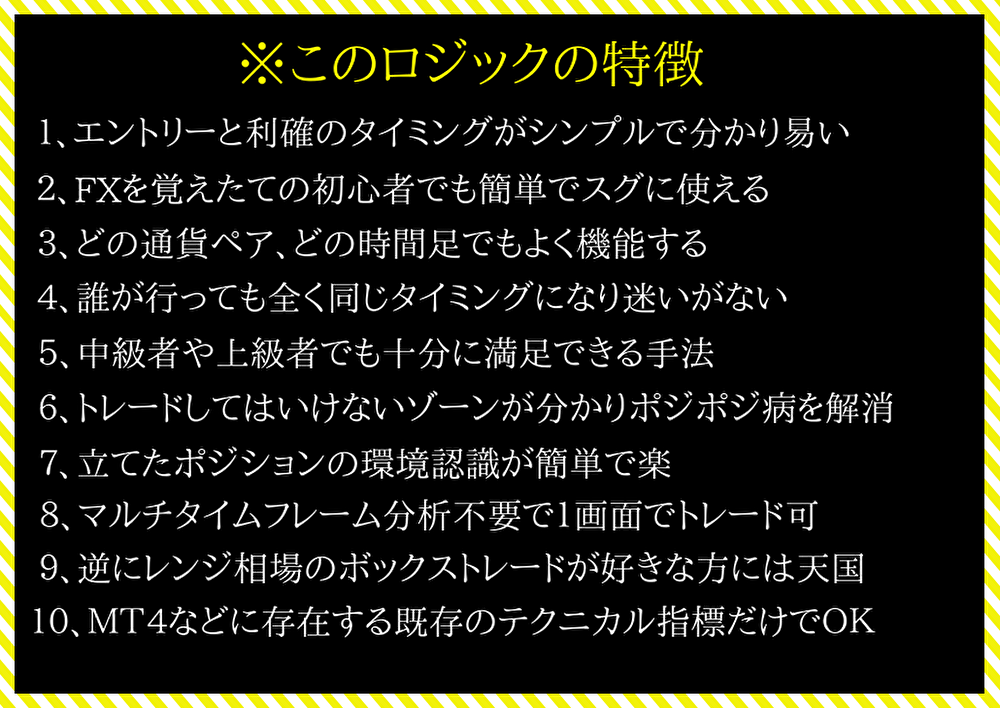
In addition to that, it can support a wide range of trading styles from scalping to day trading, or swing trading.
As a reference, here are some results from September 25th to 29th.
※The reference results are all true results that cannot be tampered with and are published for purchasing users.
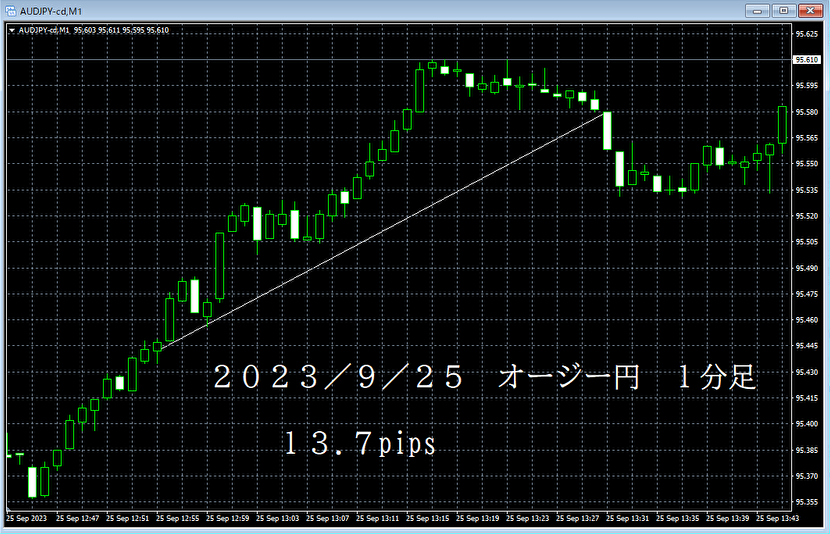
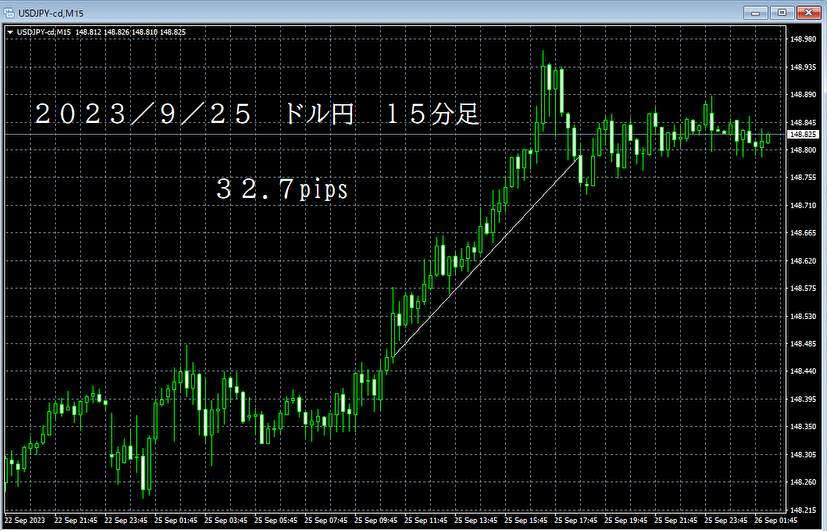
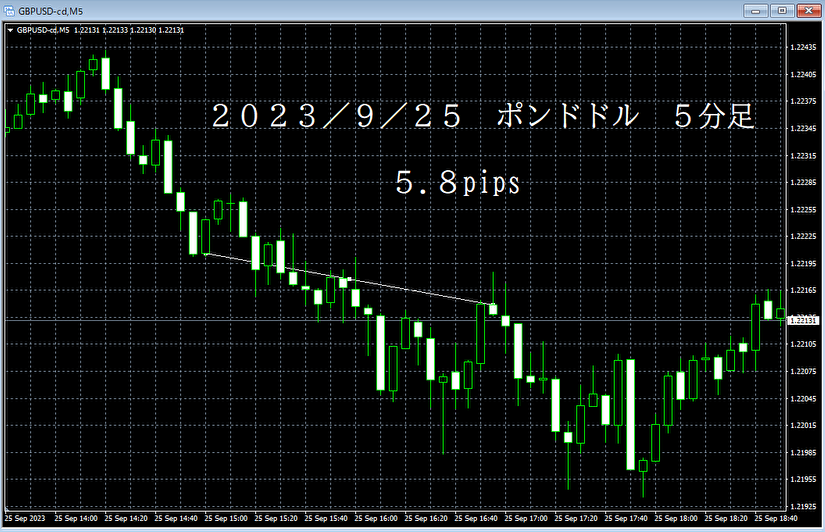
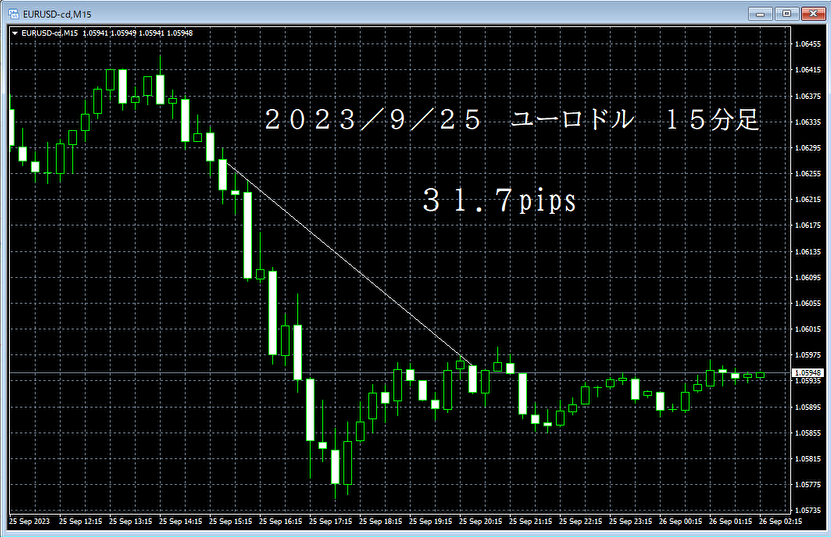
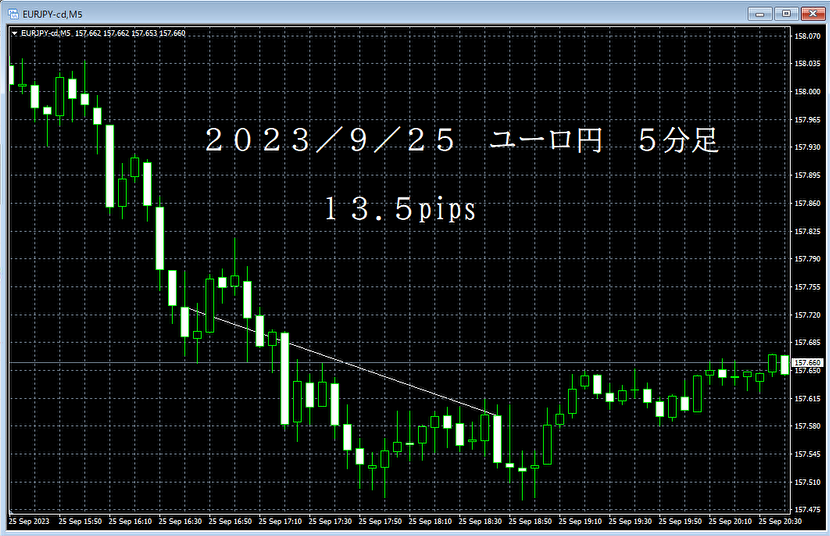
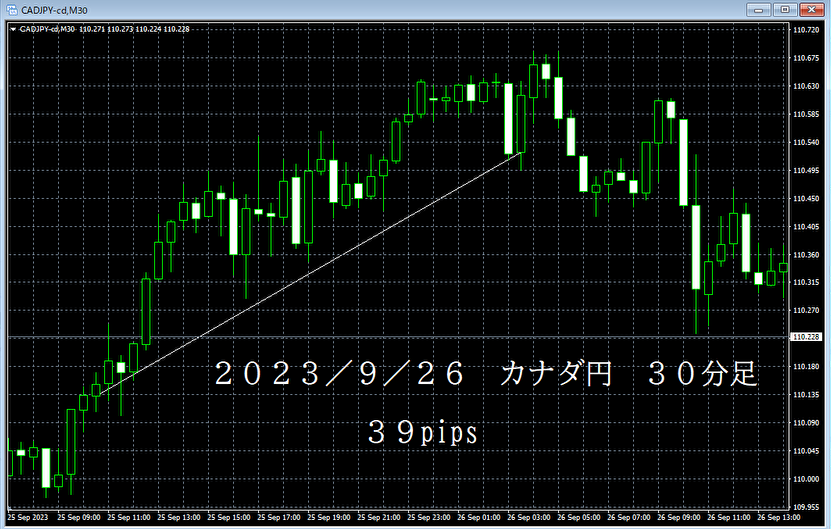
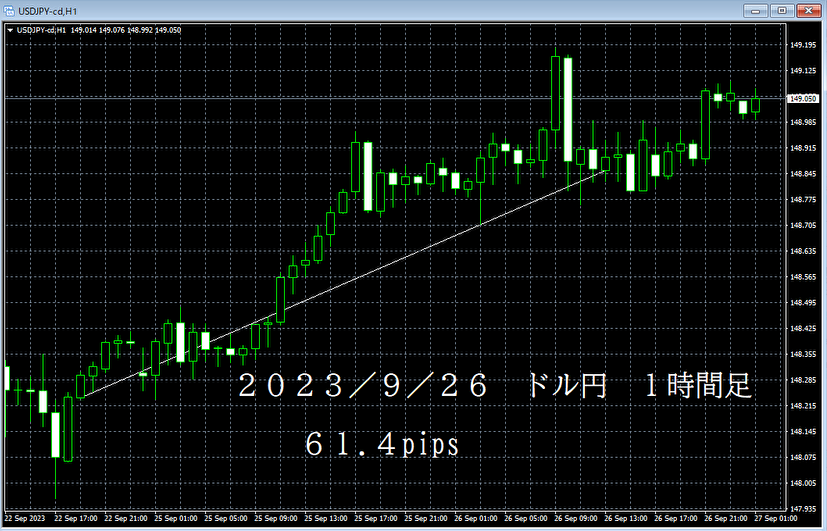

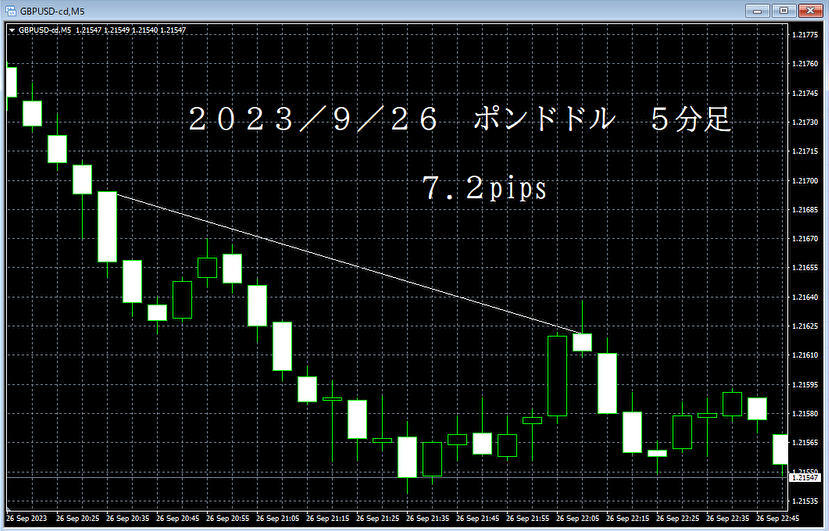
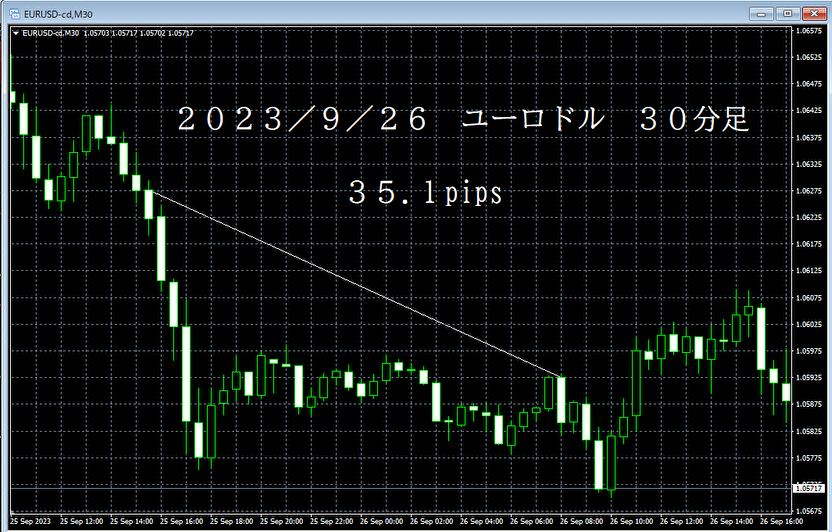
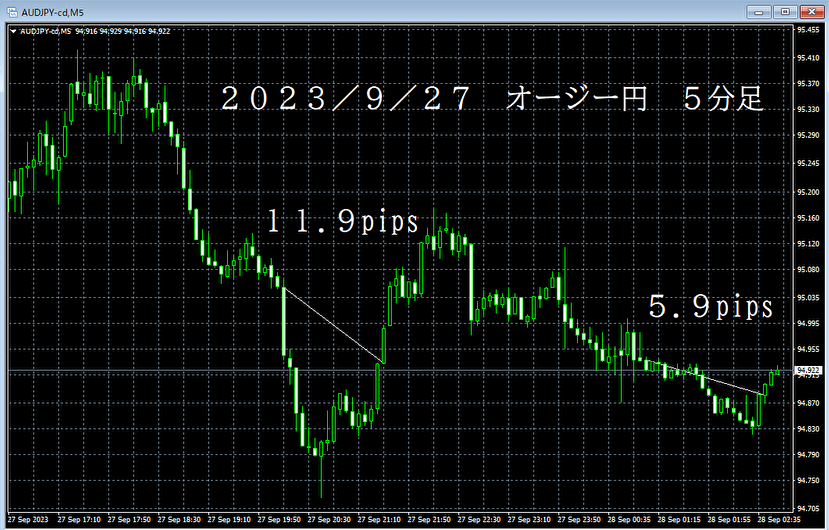
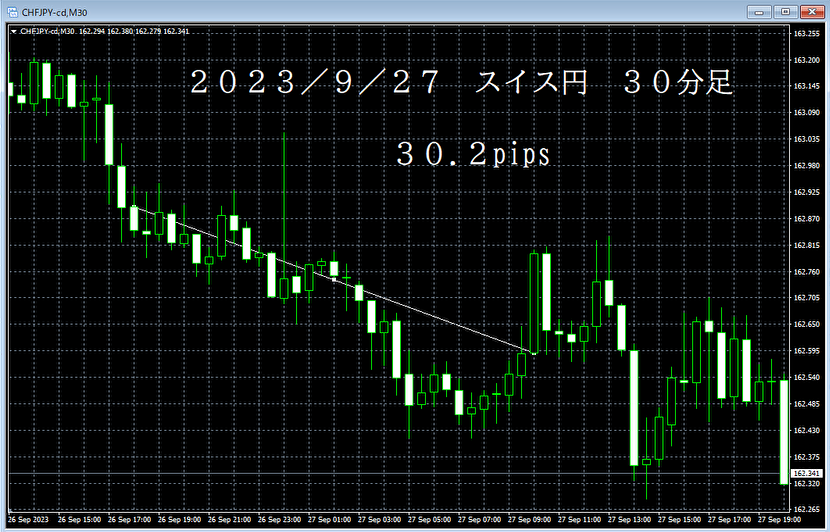
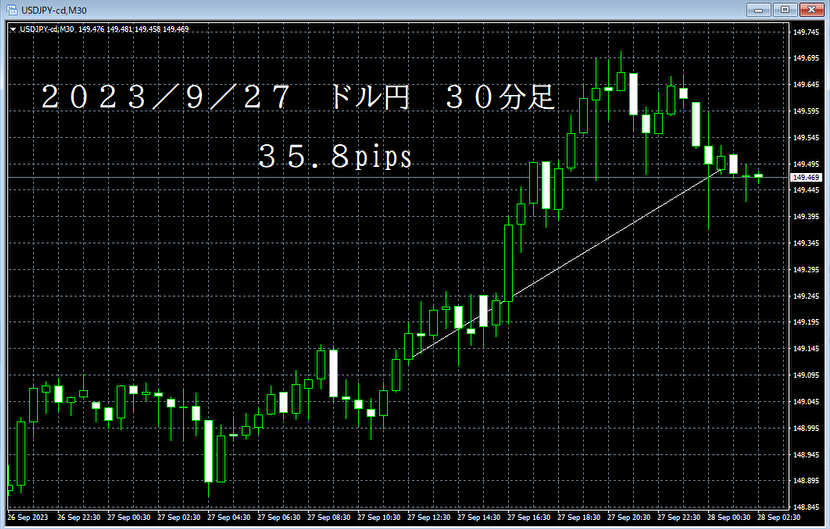
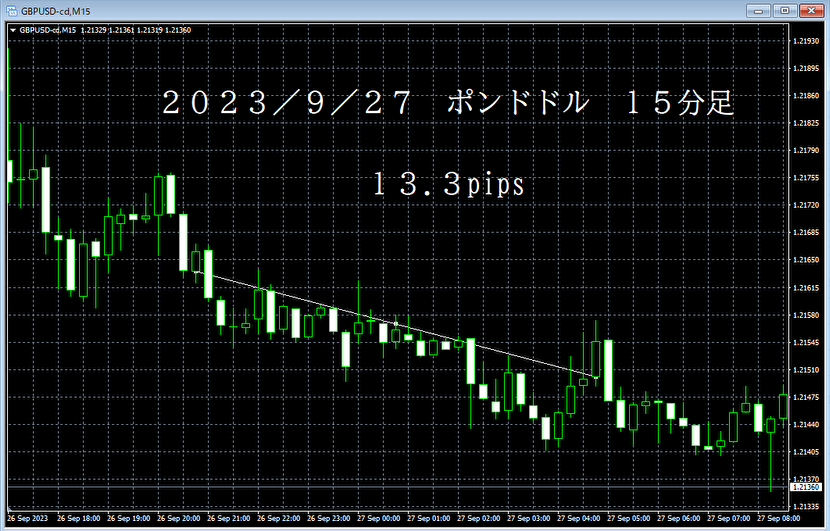
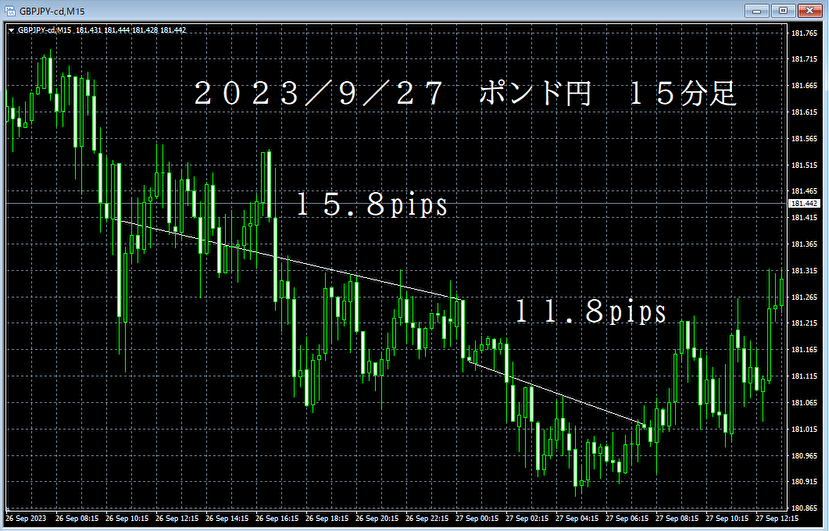

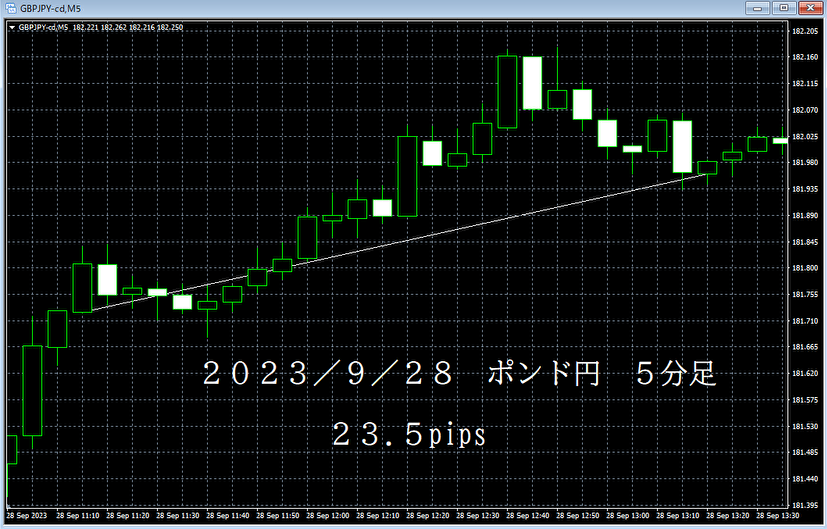
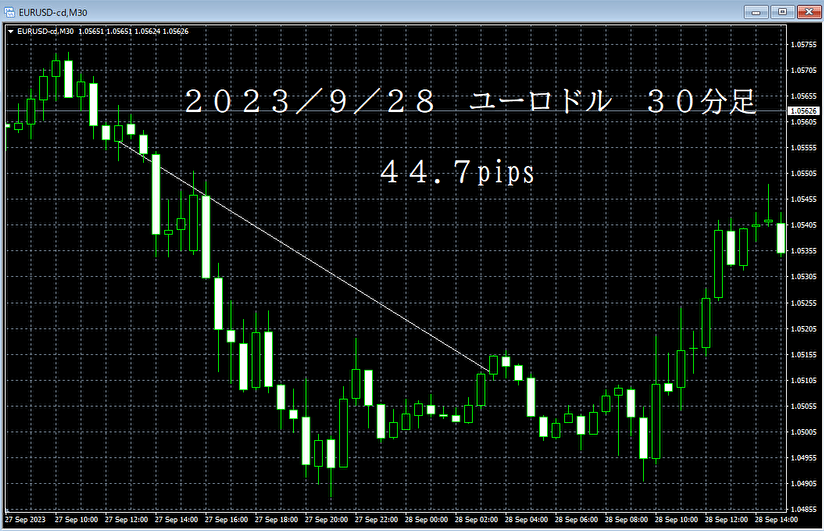

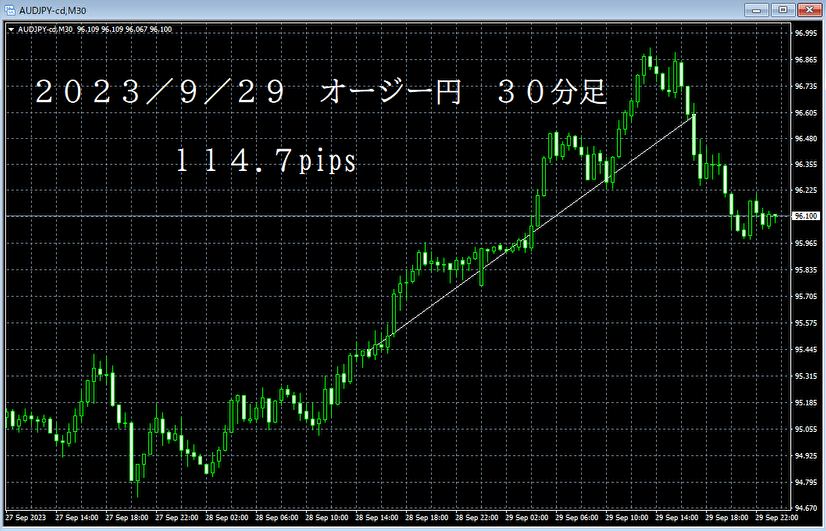
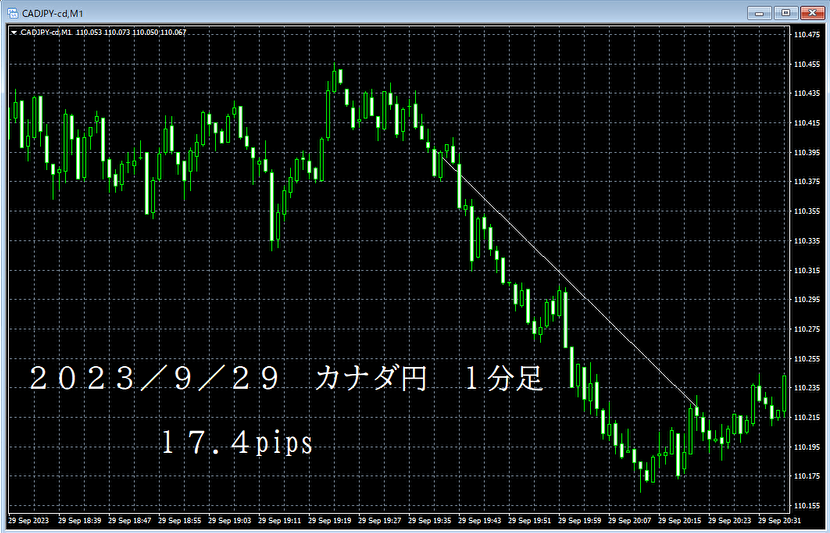
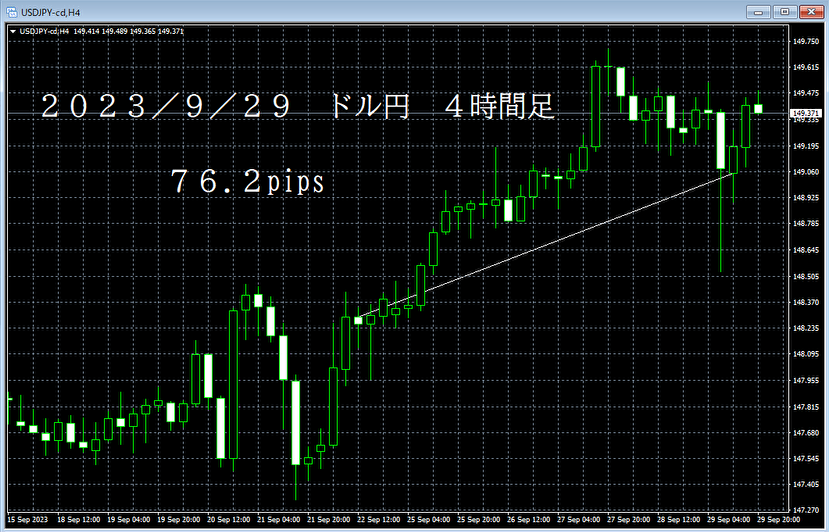

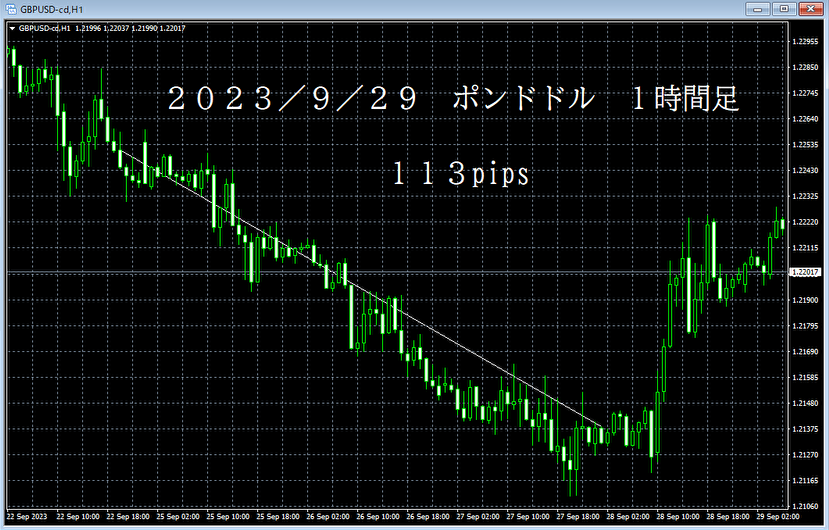
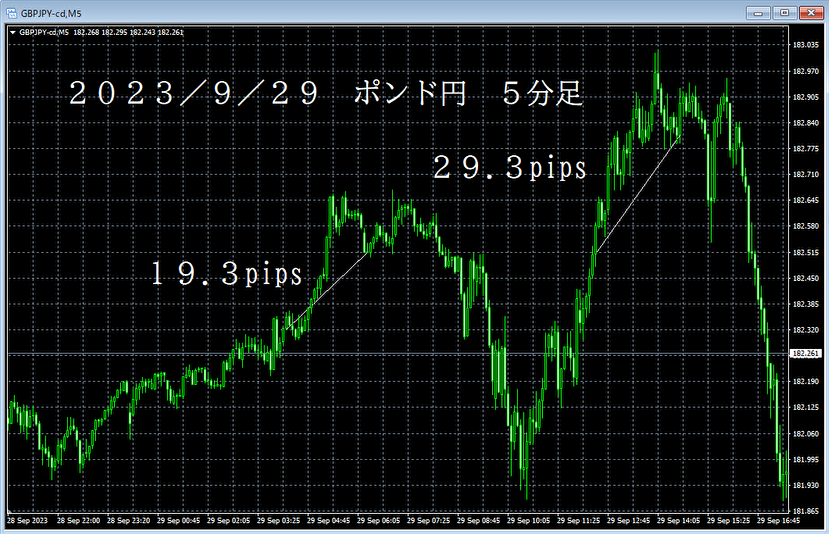
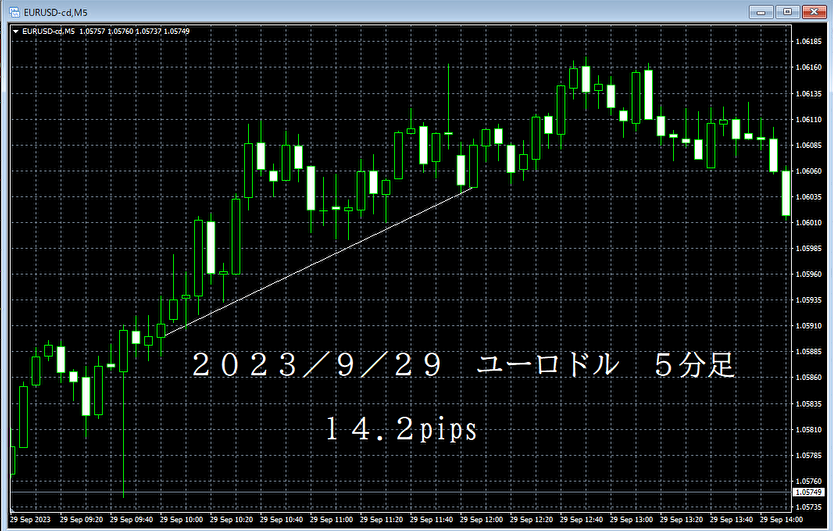
※In the reference results images, all technical indicators are hidden.
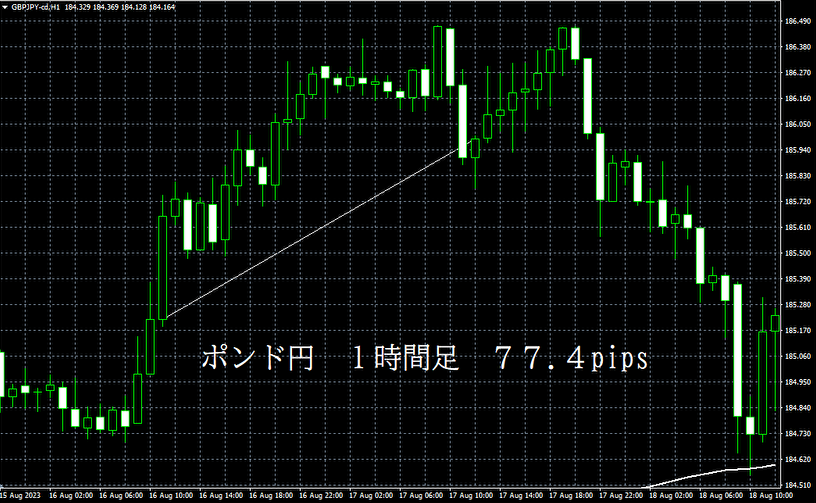
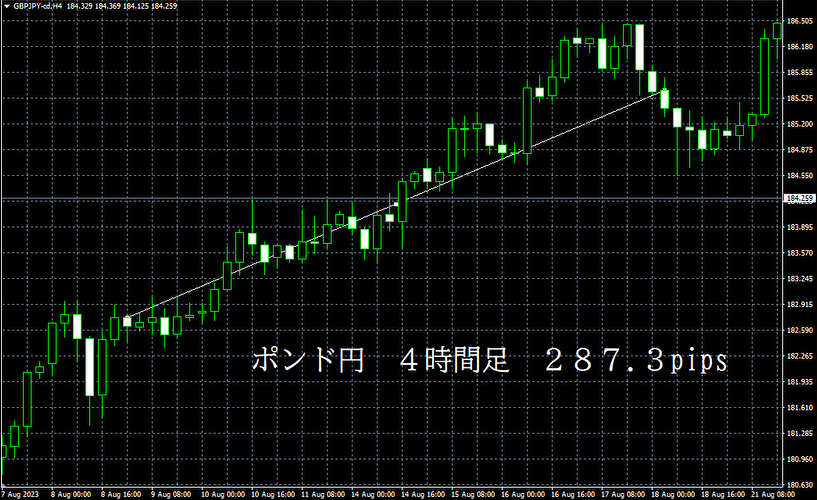
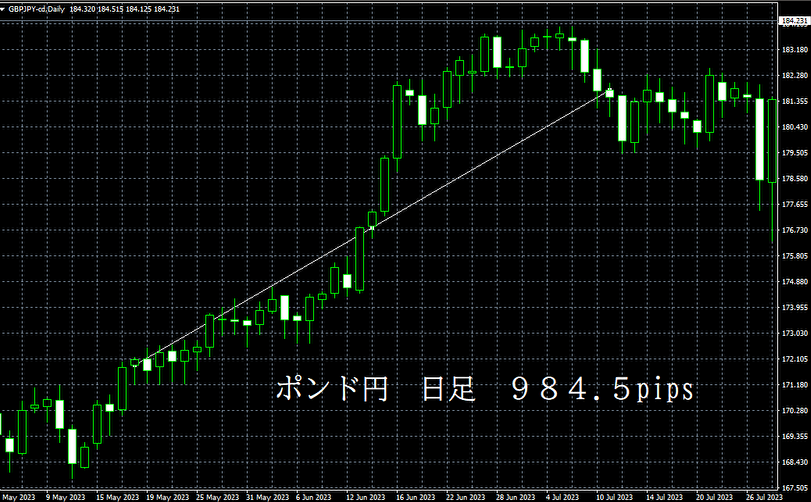
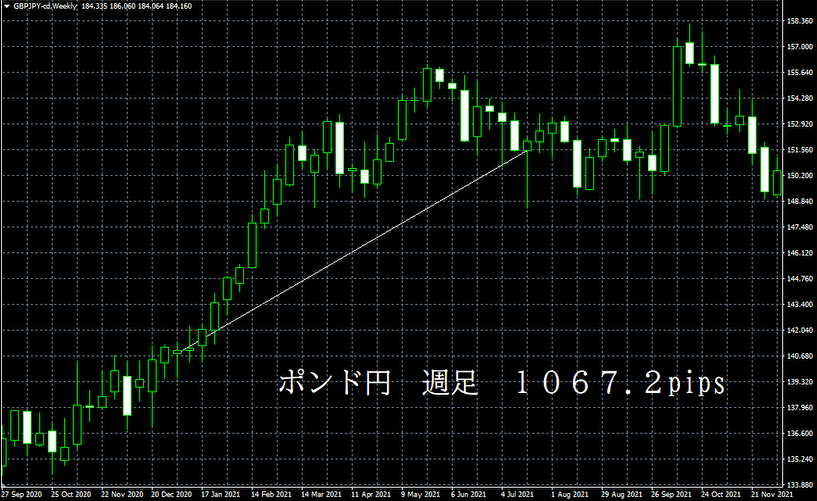
It also works well on higher timeframes as well ↓
Reference currency pair: GBP/JPY, 1-hour chart to monthly chart

If you want to see more detailed details of this logic, please search within this site in the "e-book" section for “MA-15 strongest theory! Recommendation for a moving average method that works well”

“MA-15 strongest theory! Recommendation for a moving average method that works well” is an electronic book that explains the method content in an easy-to-understand way with text and images.
This logic uses a moving average (MA) derived from parameters that I independently developed for trading.
The logic is so simple that beginners can use it right away, and it yields exactly the same judgments for anyone, on any currency pair and any time frame, making it a versatile moving average method that performs well across all trading styles.
As a bonus, there is also an explanation of a separate existing technical indicator using our own parameters to easily determine range-bound market conditions with no volatility, which can greatly reduce wasted losses from over-trading.
Conversely, for those who want to trade within a range, it easily determines a range market, effectively making it a trading paradise in that sense.
Furthermore, for short-term timeframes like 1-minute or 5-minute charts in scalping, you can visually identify when the price breaks out of a range and a trend begins, so you won't miss large trade opportunities when volatility rises.
Additionally, stop-loss placement is clearly defined, minimizing losses even in the unlikely event of repainting.
Please take a look at the details at least once.

by Technical General Research Institute

We also have the following logic ↓
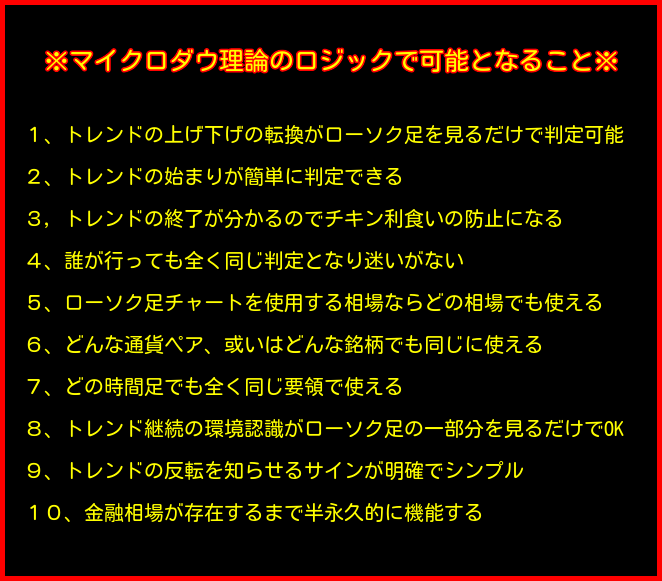
A logic that makes it easy to tell market up or down just by looking at candlesticks
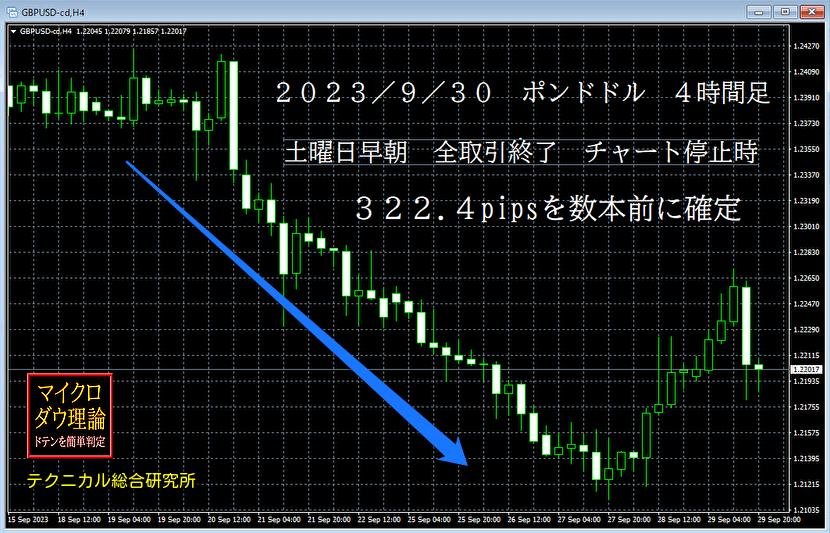
The Dow Theory of candlestick sizes, Micro Dow Theory

September reference results: all are from Saturdays' early-morning chart stoppages
※The published results are true results that cannot be falsified or tampered with for purchasing users
September 2, 2023 – September 30, 2023

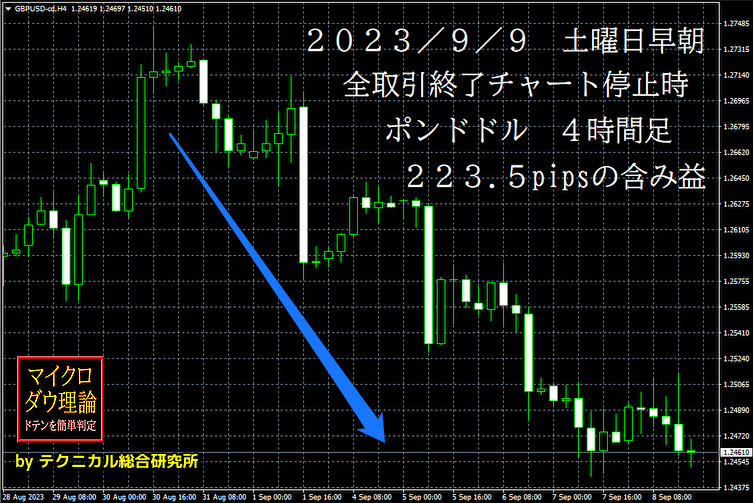
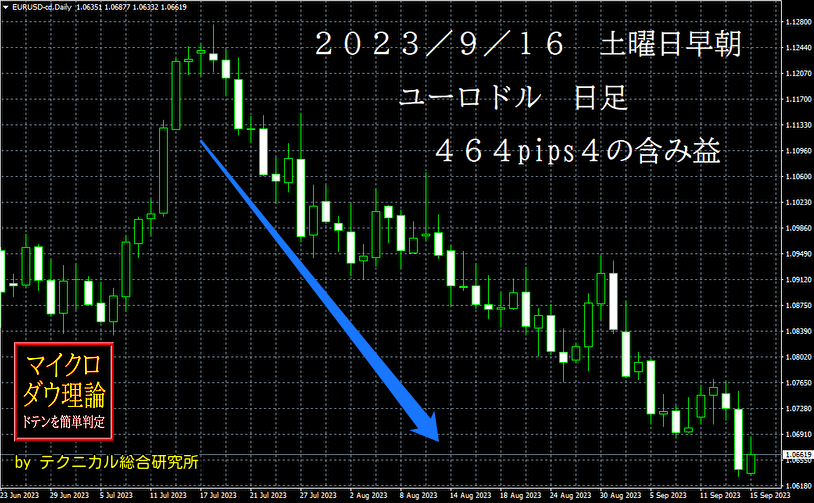
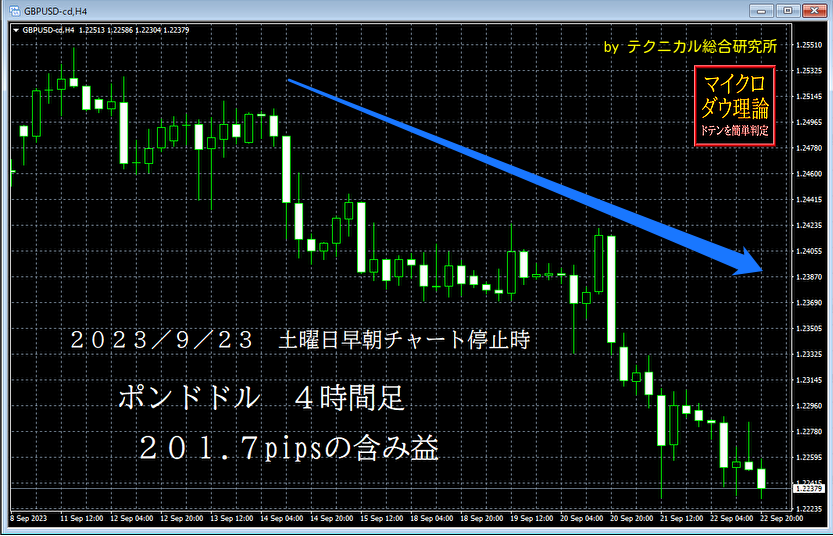
The reference results are on the 1-hour and 4-hour charts, but this logic can be used on any time frame and any currency pair
This product is also in the e-book section and is an electronic book that explains the method content in text and images clearly
Including sales on other sites, there are several hundred users to date, making this a proven logic

by Technical General Research Institute