

【September 28, 2023】Result of using the strongest method for sky and earth indicators, “15-minute chart + 4-hour chart simultaneous monitoring method”
This time【September 24, 2023】I have examined the follow-up of the 6 currency pairs that were posted.
In terms of results, among the 6 currency pairs from the previous analysis, over the four days from September 25 to 28, out of 25 entry points there were 23 wins and 2 losses. I will explain this verification result in detail. I will also introduce the biggest advantage of the article's title, “15-minute chart + 4-hour chart simultaneous monitoring method.”
・This article mainly uses the “Heaven and Earth Indicator”“ for chart analysis and past verification.
・The content is based on using the most accurate tool“15-minute + 4-hour simultaneous monitoring method”.
・This tool is a groundbreaking trading tool that can be used without understanding the classic FX theories (Elliott Wave, Dow Theory, GANN’s laws, cycle theory, price action, Fibonacci, support/resistance, channels, etc.).

Heaven and Earth Indicator is a trading method using an original indicator I, A-busan, released in February 2022.
Thanks to everyone's support,「GogoJungle Award 2022を受賞しました。
■Heaven and Earth Indicator
https://www.gogojungle.co.jp/tools/indicators/35780
■Heaven and Earth Mountain
https://www.gogojungle.co.jp/tools/indicators/37744
■Heaven and Earth EA ~ Semi-discretionary Auto Trading System ~
https://www.gogojungle.co.jp/tools/indicators/43213
■Heaven and Earth Dashboard
https://www.gogojungle.co.jp/tools/indicators/46257
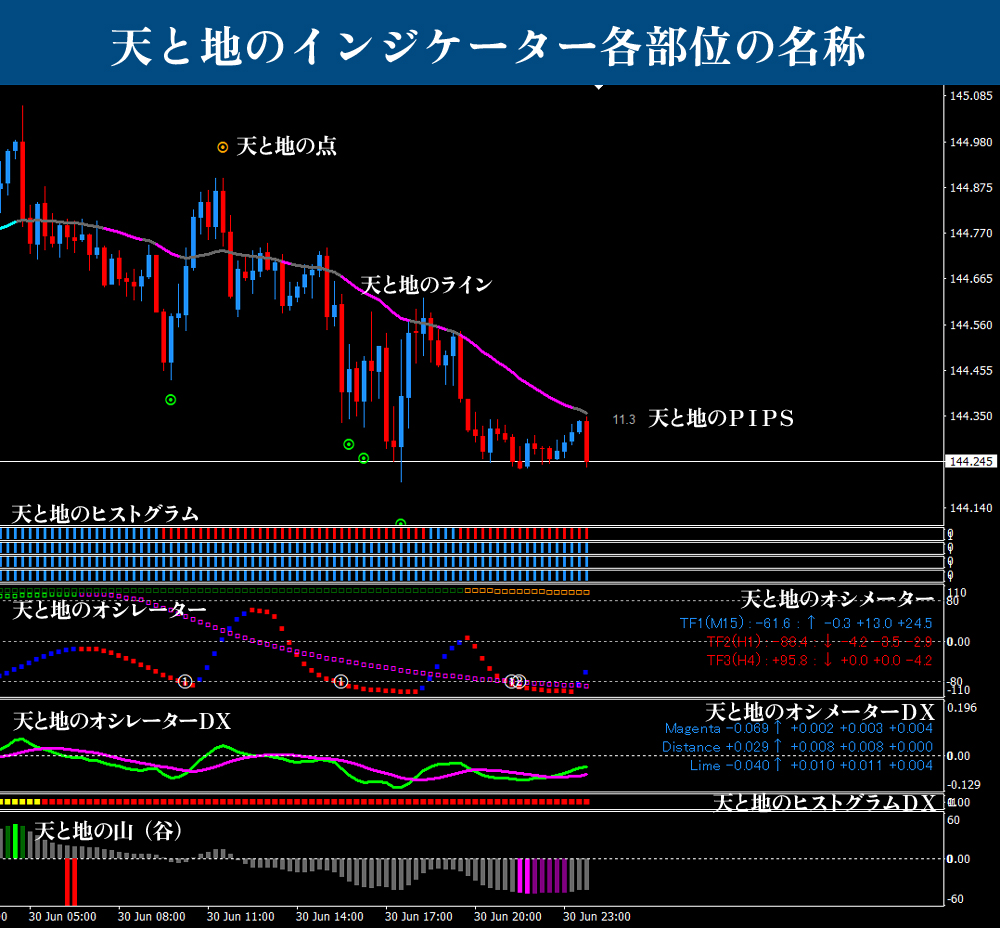
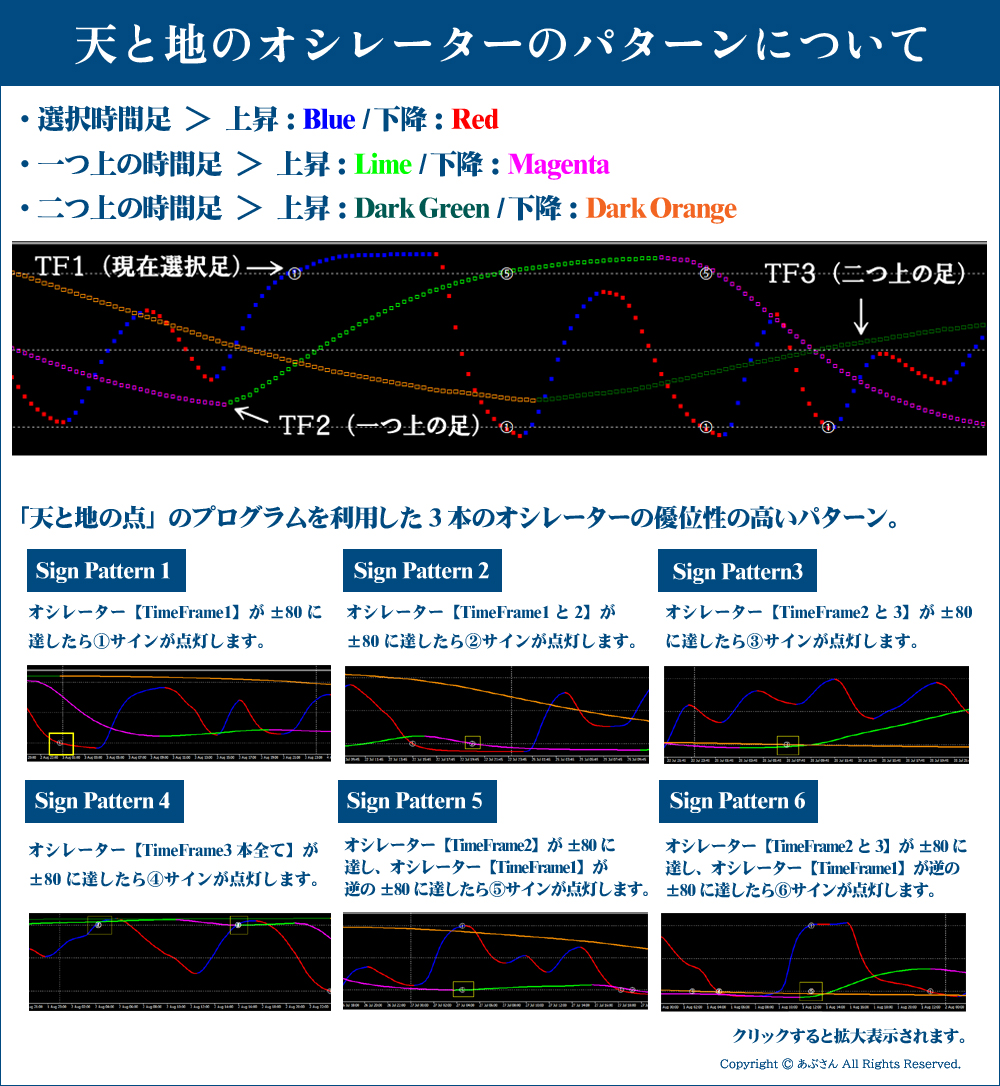
※Regarding the specialized terms used in this blog, please refer to the below “Names of the Parts of Heaven and Earth Indicator” and “Patterns of Heaven and Earth Oscillator.” If you have any other questions, please refer to the Heaven and Earth Indicator sales page. Existing users should have no problem by reading the user manual.
Now, I would like to move on to the verification.
Thank you!
※ All images can be enlarged by clicking.

Before entering the verification results, I will explain the greatest advantage of the “15-minute + 4-hour simultaneous monitoring method.”
The “15-minute + 4-hour simultaneous monitoring method” uses the 4-hour chart as the environment recognition chart and the 15-minute chart as the entry chart. Enter on the 15-minute chart without going against the direction of the 4-hour chart—a so-called“alignment of the lower time frame with the higher time frame”, a very high-safety method.
On the other hand, Heaven and Earth Indicator excels particularly in the two aspects of “clear environment recognition” and “entry point accuracy.” The combination with the “15-minute + 4-hour simultaneous monitoring method” is the most compatible.
For example, if the 4-hour chart environment recognition indicates an uptrend and then the forecast fails and it declines,however, when using the “15-minute + 4-hour simultaneous monitoring method,” there will be almost no entry points in the 15-minute chart in the direction that was forecast (long). This is the greatest advantage of this method. In other words, even if the 4-hour forecast fails, there are no entry points on the 15-minute chart, so there is no pain in entering.
This is largely due to the oscillator TF2 acting as a filter for 15-minute entries.The 15-minute oscillator TF2 is formed on the 1-hour chart. The relationship among 15-minute, 1-hour, and 4-hour is extremely important. It is a core aspect of Heaven and Earth Indicator.
Unless there is a major misjudgment on the 4-hour environment recognition, you will not end up entering on the opposite side on the 15-minute chart.
Now then,I will verify the follow-up of the previous articlefor the six currency pairs.

Dokka-na 15-minute + 4-hour past verification(From September 26, 2023)
※ Please note the yellow vertical line. There is a yellow vertical line at a similar location on the 15-minute chart as well. (Using LINK LINE)
■4-hour chart (environment recognition)
Please refer to the previous Dokkana consideration article here.
The yellow vertical line indicates the place where the Oscillator DX formed a downward cross, judged as bearish. It is not a particularly good downward cross, so normally I would skip it, but this time I will stay true to the article.
After judging bearish, it unfortunately rose. When Oscillator DX formed an upward cross again, the bearish outlook was reset.
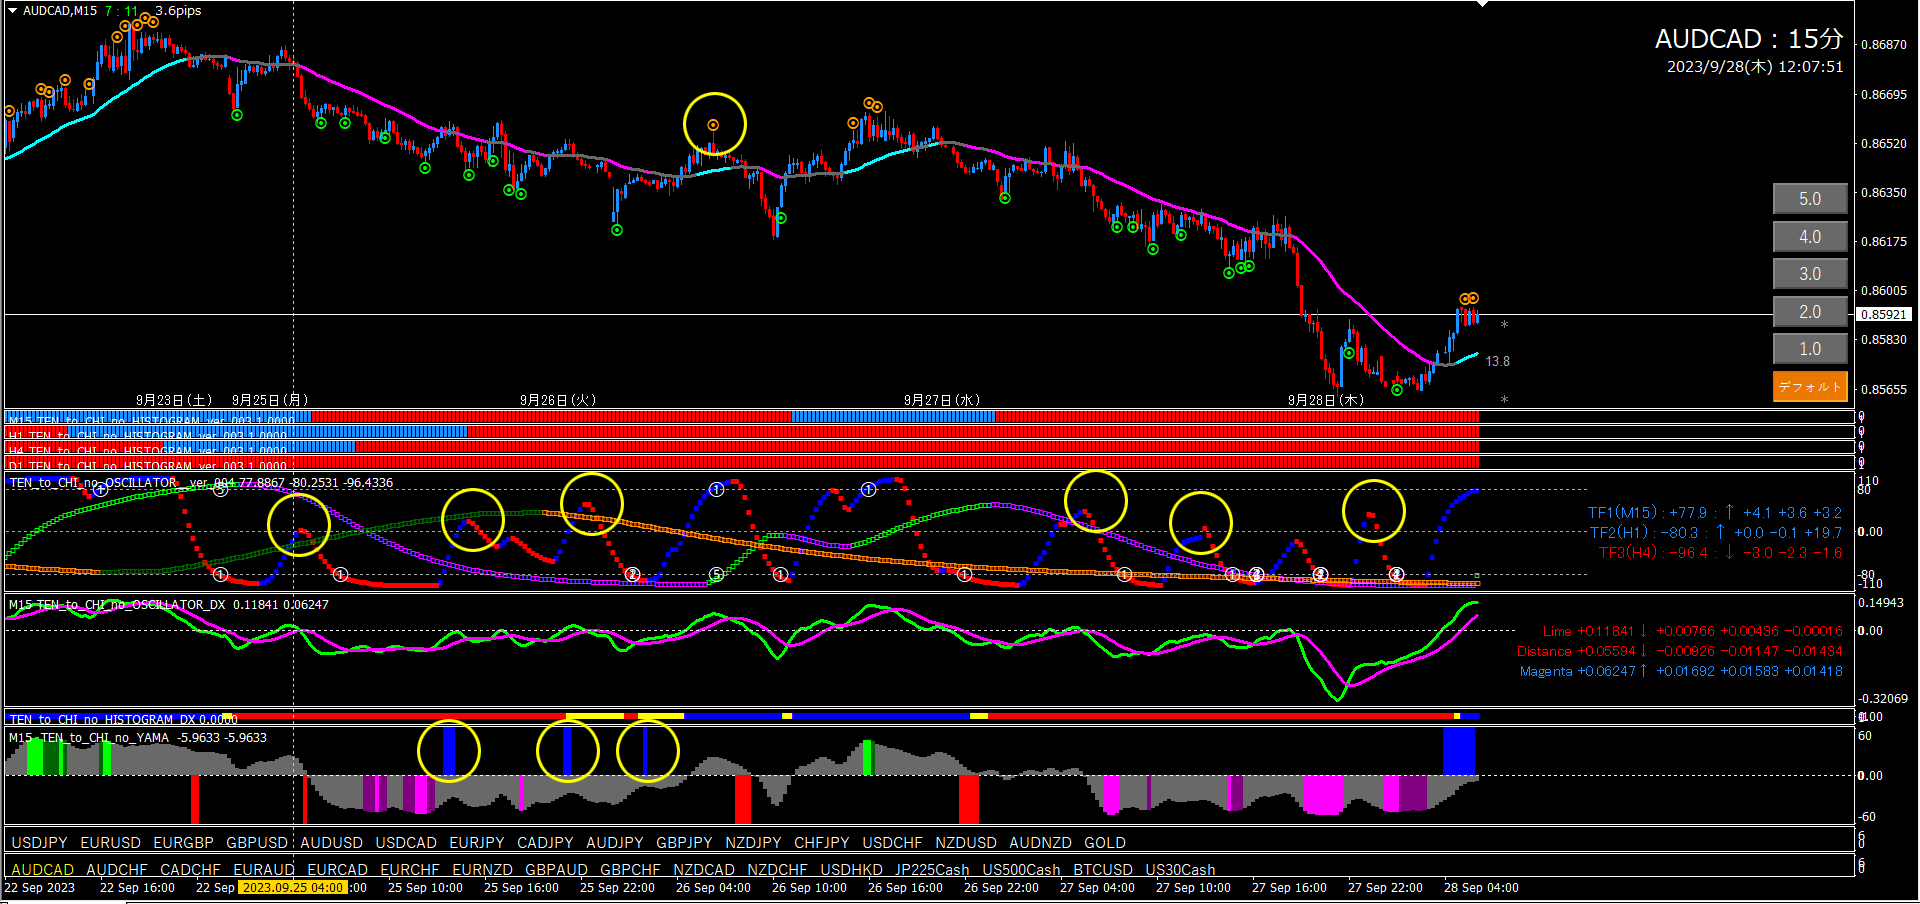
■15-minute chart (entry trigger)
The yellow vertical line area is where I judged bearish on the 4-hour chart.
Since I am bearish, I will only aim for a short entry.Oscillator TF2 acts as a filter, so there are no short entry points at all.Even though I misread the trend on the 4-hour chart, it turned out to be a great result with no loss.Even though I misread the trend on the 4-hour chart, it turned out to be a great result with no loss.


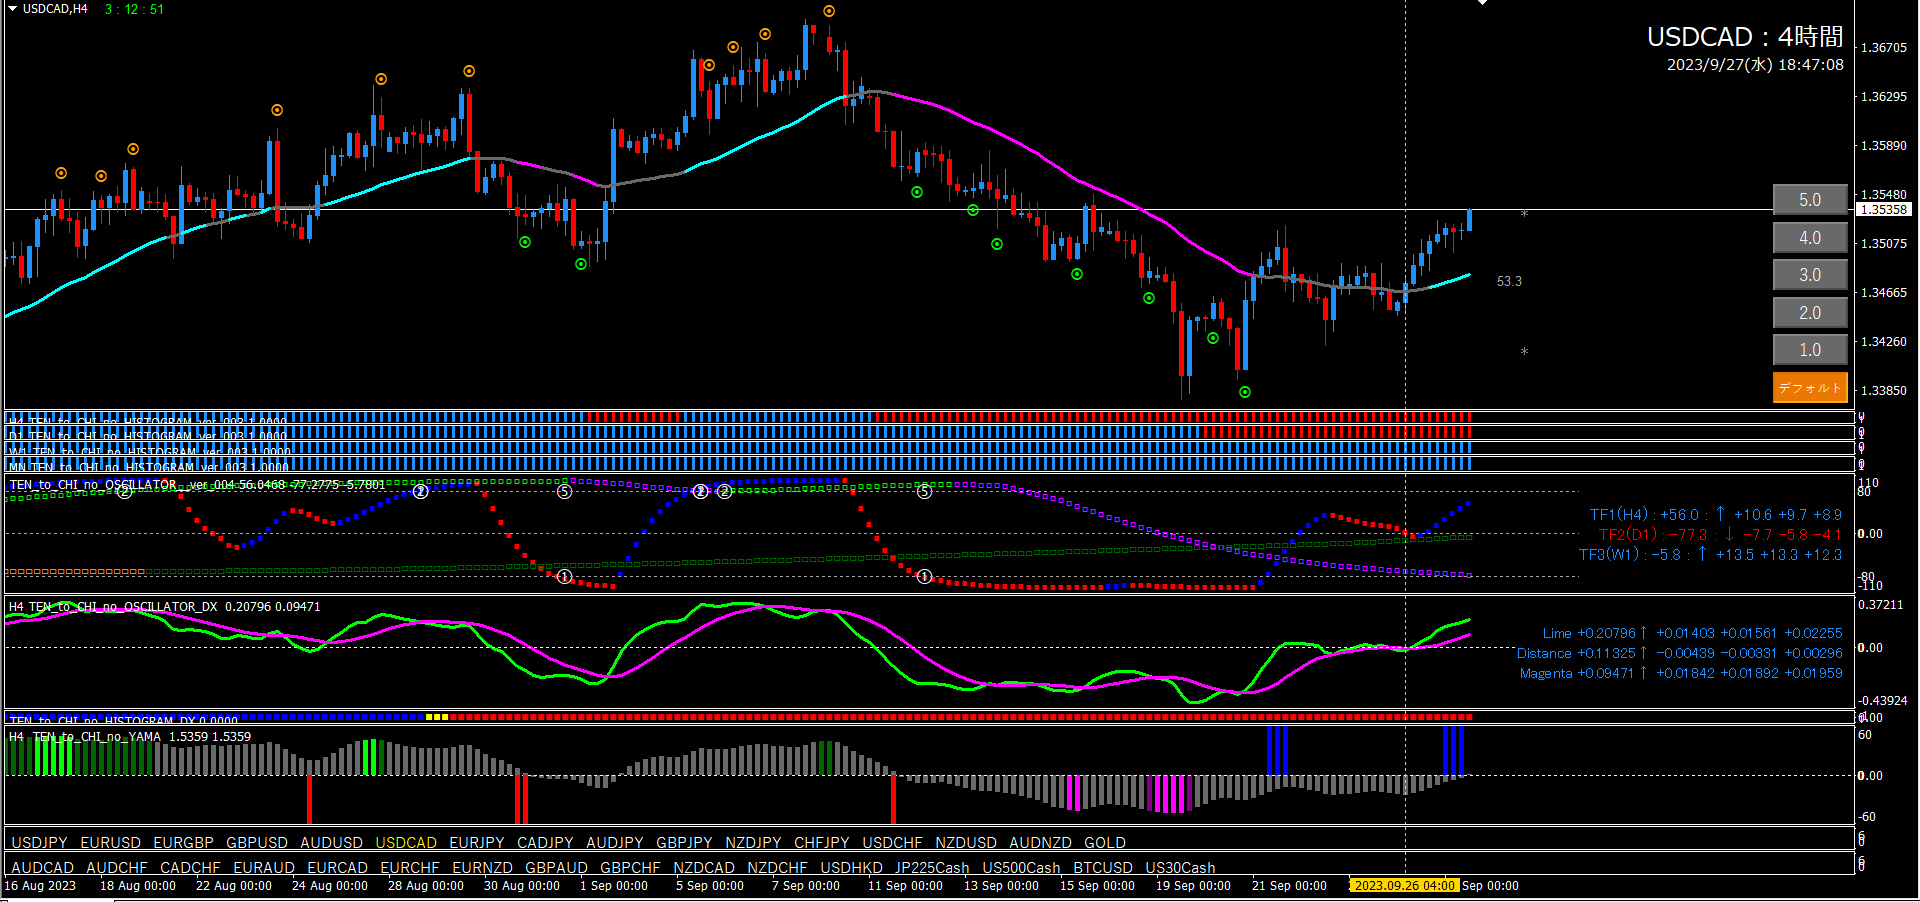
Aza Kana15-minute + 4-hour past verification(From September 27, 2023)
※ Please note the yellow vertical line. There is a yellow vertical line at a similar location on the 15-minute chart as well. (Using LINK LINE)
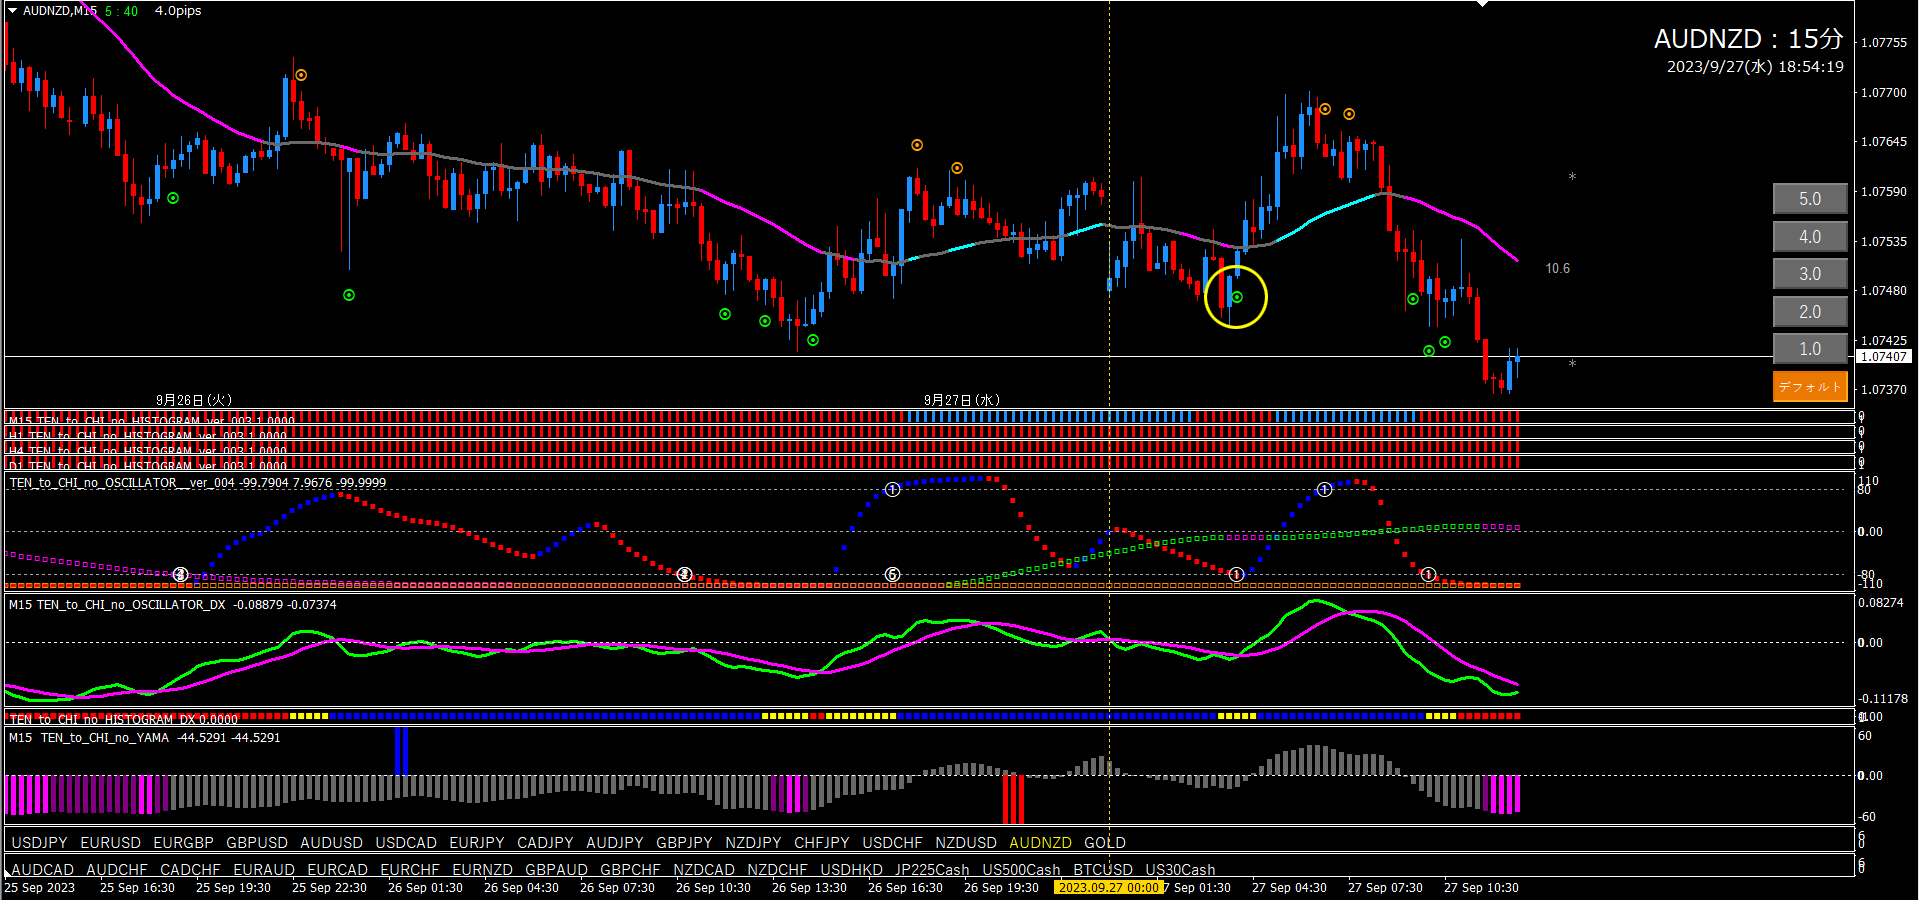
■4-hour chart (environment recognition)
Please refer to the previous Oji Kana analysis article here.
The yellow vertical line indicates that according to the previous analysis Oscillator DX showed an upward cross, so I judged an uptrend. However, TF2 had dropped to this extent, so the uptrend should have been reset long ago, but I will stay faithful to the article.
After judging uptrend, it unfortunately declined.
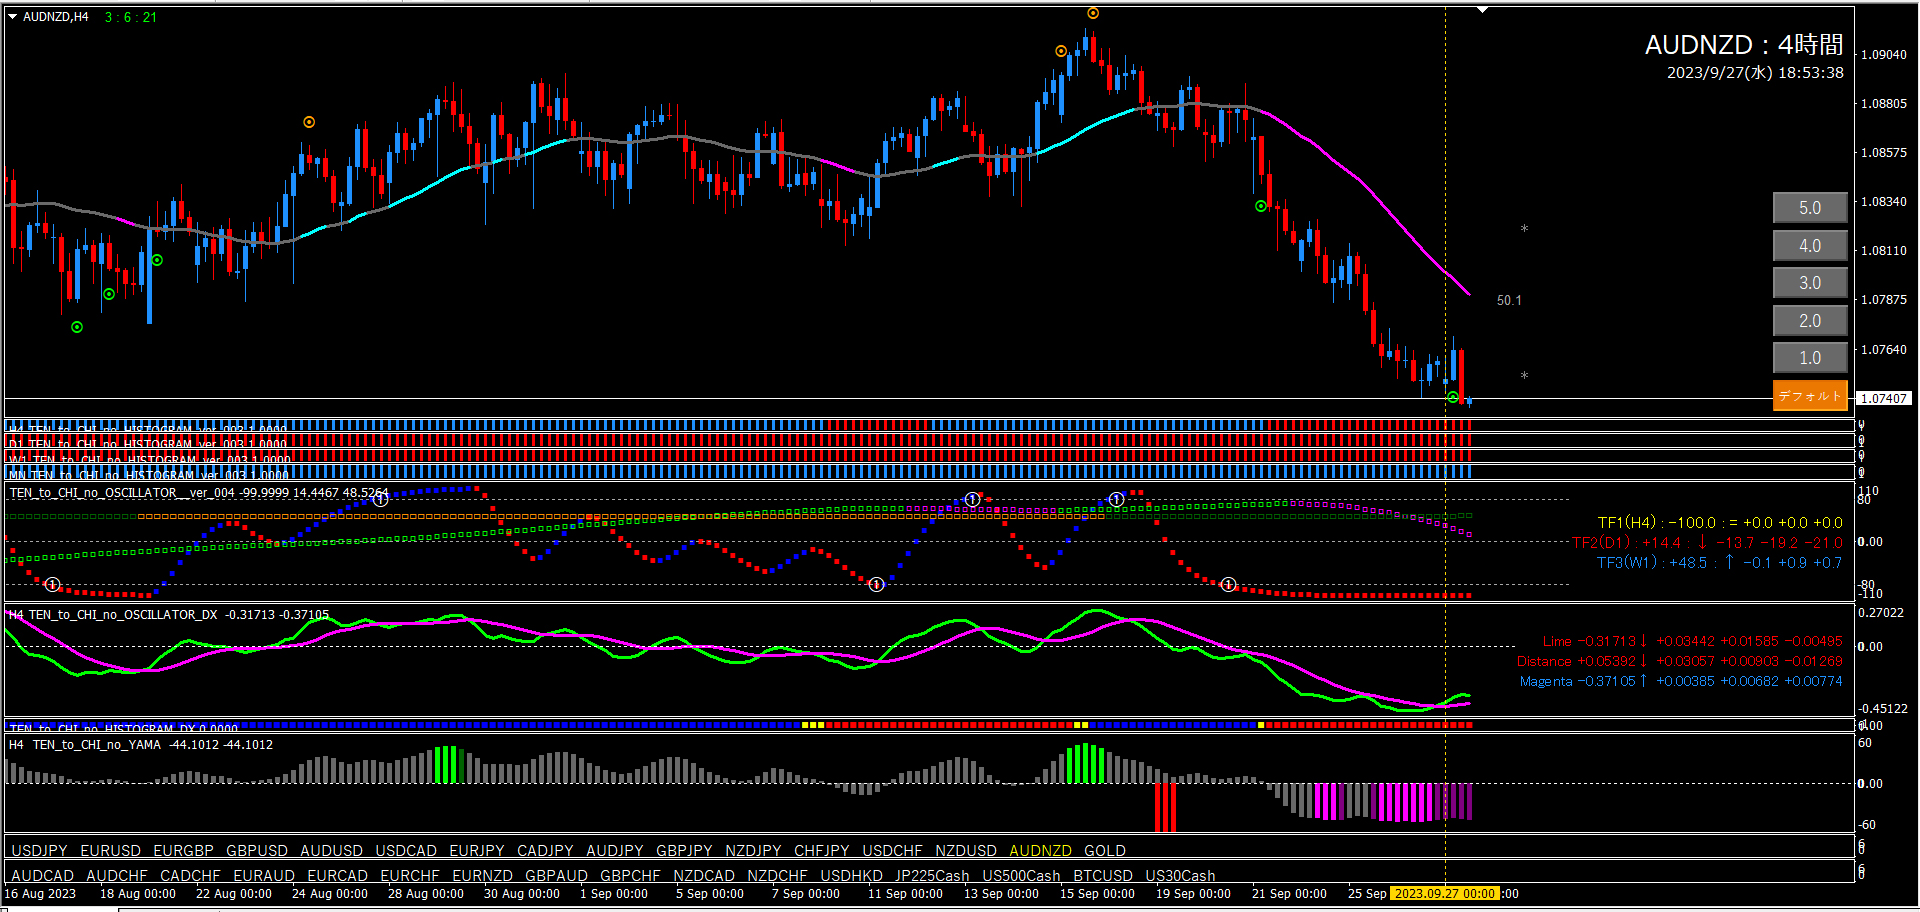
■15-minute chart (entry trigger)
The yellow vertical line area is where I judged uptrend on the 4-hour chart.
Since I judged uptrend, I will target only long entries.
The yellow circle area shows where Oscillator TF2 has turned downward, but since it is near the zero line, I consider it noise and still enter long. As per the 4-hour chart analysis, long entries were successfully captured. This indicates the influence of the 4-hour analysis.
By carefully analyzing the environment, results like these can be achieved. This requires using multiple indicators. In the environment recognition, even if not all indicators agree, if one agrees it can influence the entry chart.

Ozikana 15-minute + 4-hour past verification(From September 25, 2023)
※ Please note the yellow vertical line. There is a yellow vertical line at a similar location on the 15-minute chart as well. (Using LINK LINE)
■4-hour chart (environment recognition)
Please refer to the previous Oj Kana analysis article here.
The yellow vertical line indicates that according to the previous analysis, Oscillator shows “Lime↓Distance↓Magenta↑,” so I judged bearish at that moment. The analysis correctly showed a decline.
■15-minute chart (entry trigger)
The yellow vertical line area is where I judged bearish on the 4-hour chart.
Since I judged bearish, I will target only short entries.
The yellow circle area is an entry point that aligns with TF2. The three triggers are dot, TF1, and valley.As predicted by the 4-hour analysis, the price declined properly, so there are many entry points on the 15-minute chart. If you set the dot level to 1.0, entry points increase further. Profit-taking is the opposite dot signs. I think all 10 entries are positive.
Euro-Oji 15-minute + 4-hour past verification(From September 22, 2023)
※ Please note the yellow vertical line. There is a yellow vertical line at a similar location on the 15-minute chart as well. (Using LINK LINE)
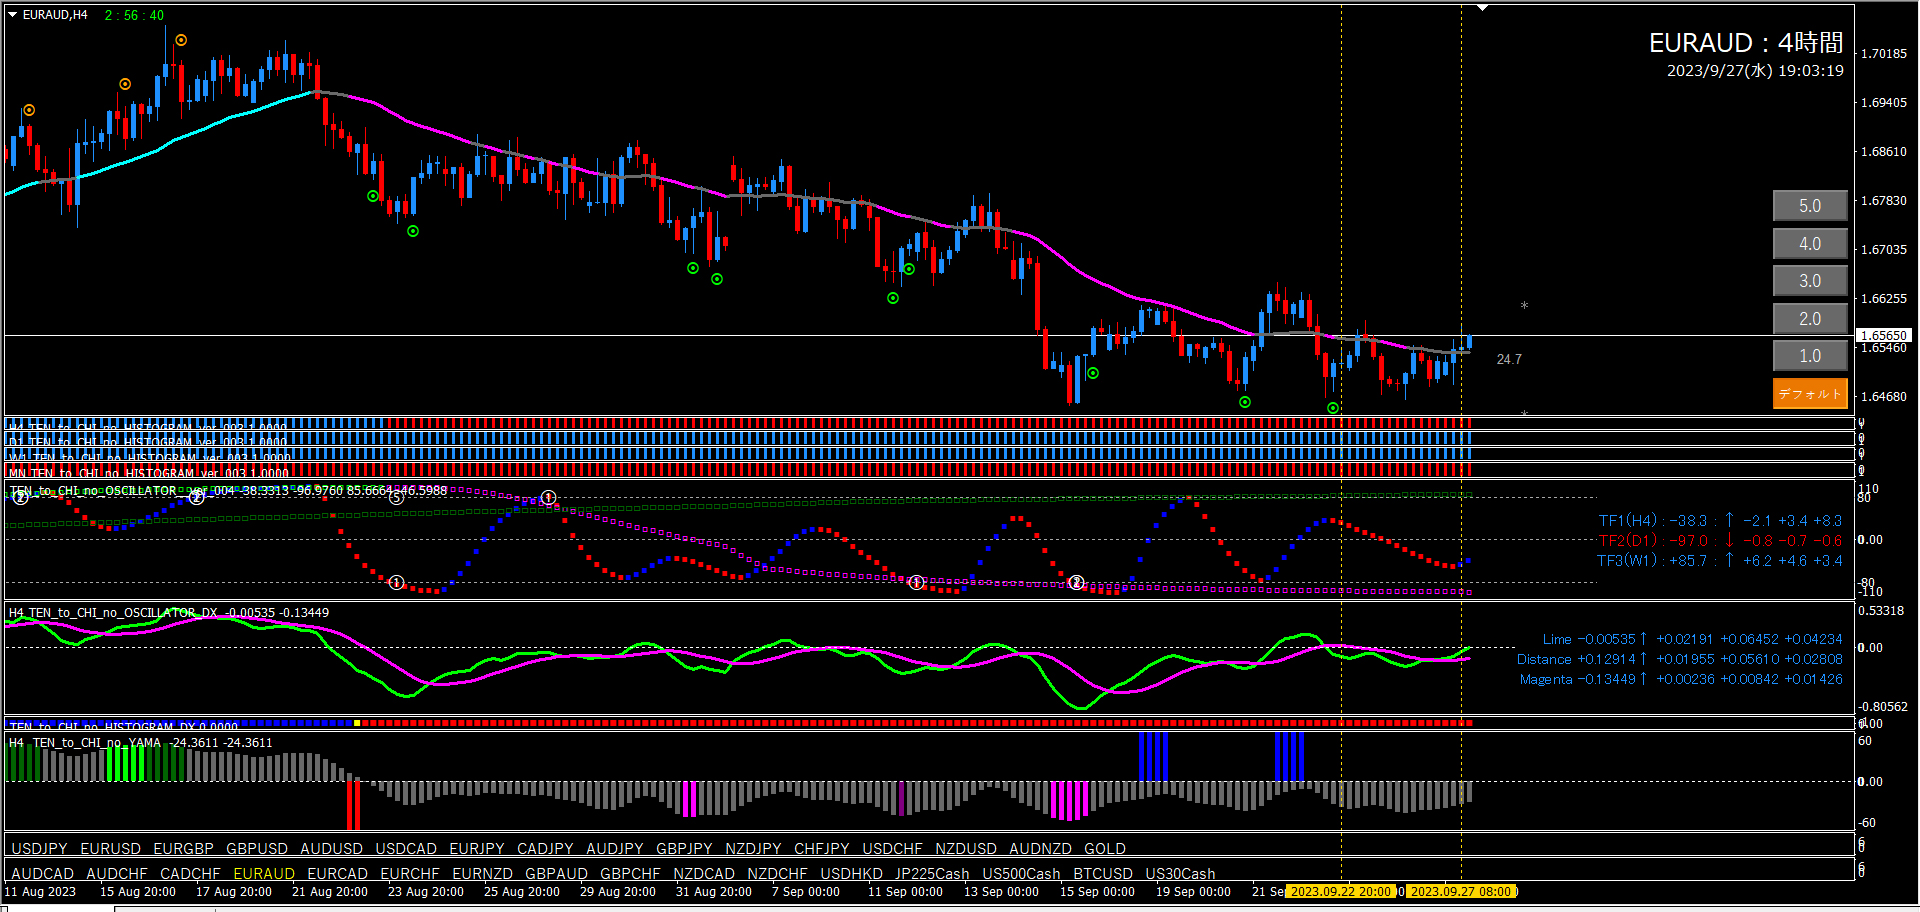
■4-hour chart (environment recognition)
Please refer to the previous Euro-Oji analysis article here.
The left vertical line indicates bearish according to the previous analysis. The right vertical line is where the candle broke above Heaven and Earth line. This was the scenario where bearish outlook would be reset. As noted in the analysis, this chart was difficult and normally would not be touched.
■15-minute chart (entry trigger)
The right yellow vertical line indicates bearish on the 4-hour chart. The left indicates where bearish outlook was reset.
Since I judged bearish, I will target only short entries.
The yellow circle area aligns with TF2 and is an entry point. The three triggers are dot, TF1, and valley. As per the 4-hour analysis, the price declined firmly, so there are many entry points on the 15-minute chart. If you set the dot level to 1.0, entry points increase further. All profits are from the inverse dot signs. I think all 10 entries are positive.

New Zealand Dollar (NZD) 15-minute + 4-hour past verification(From September 25, 2023)
※ Please note the yellow vertical line. There is a yellow vertical line at a similar location on the 15-minute chart as well. (Using LINK LINE)
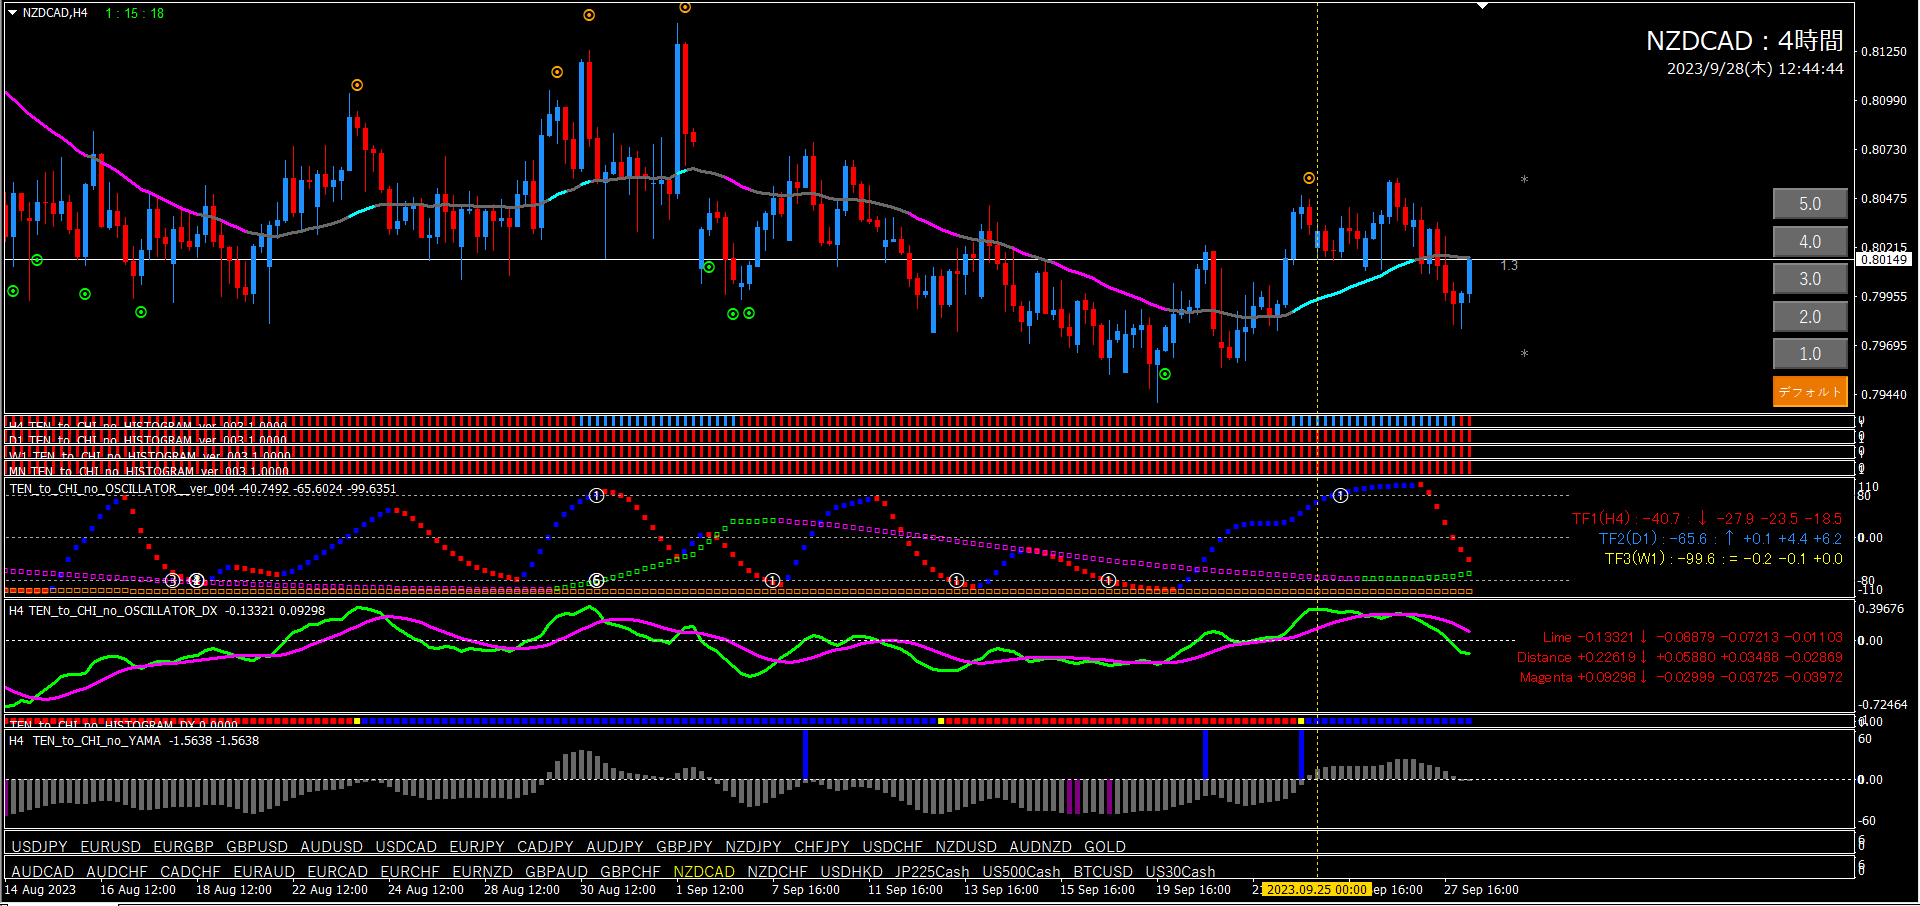
■4-hour chart (environment recognition)
Please refer to the previous New Zealand Dollar analysis article here.
The yellow vertical line indicates bearish according to the previous analysis.
There were declines, then rises, then declines again.
■15-minute chart (entry trigger)
The yellow vertical line area is where I judged bearish on the 4-hour chart.
Since I judged bearish, I will target only short entries.
The yellow circle matches TF2 as a short entry point. I think all 9 entries are positive.

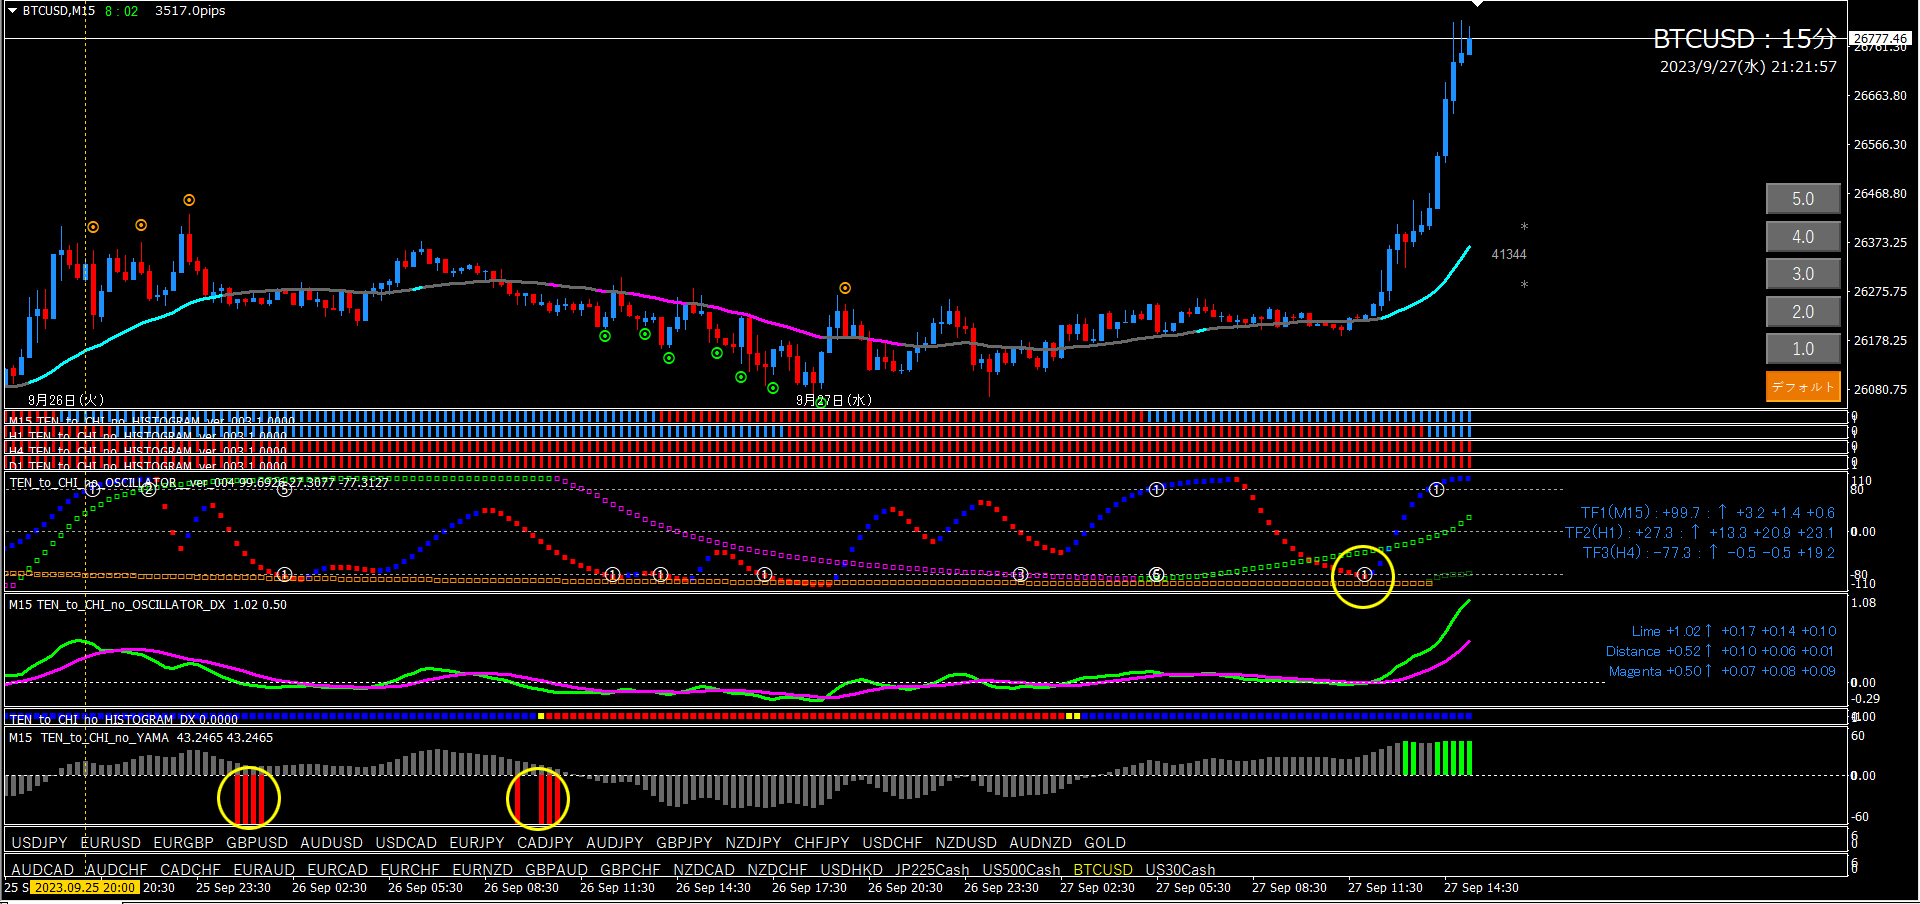
Bitcoin15-minute + 4-hour past verification(From September 25, 2023)
※ Please note the yellow vertical line. There is a yellow vertical line at a similar location on the 15-minute chart as well. (Using LINK LINE)
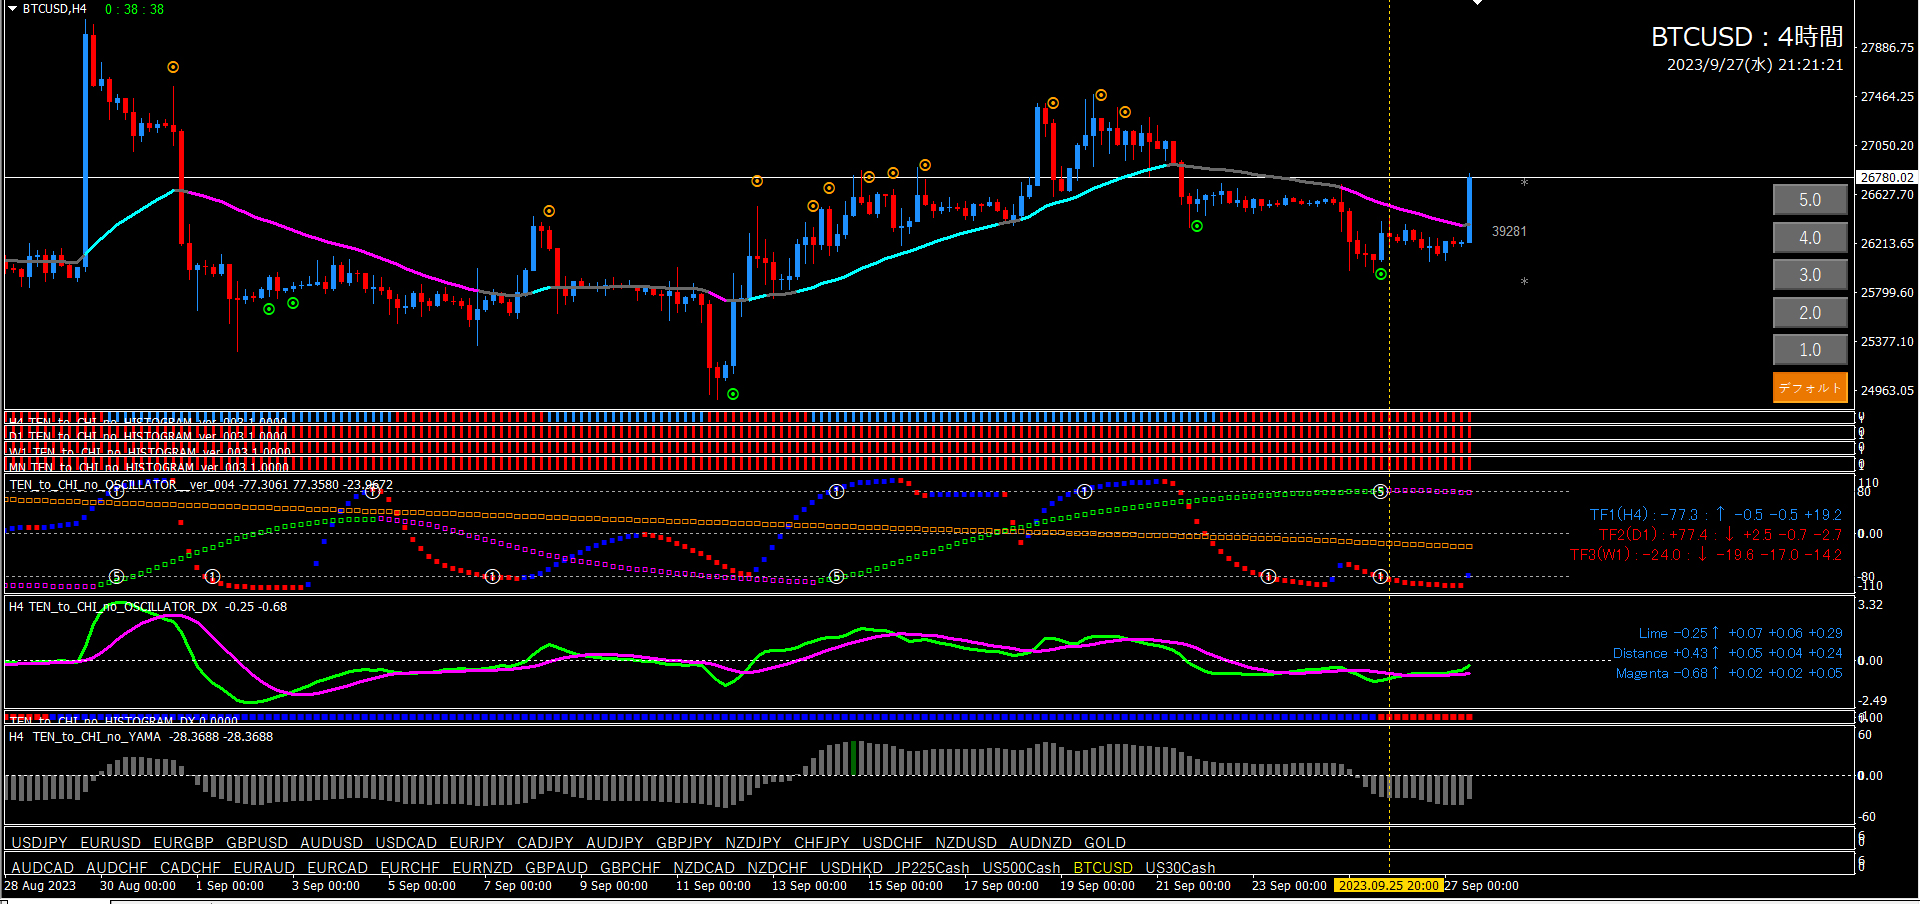
■4-hour chart (environment recognition)
Please refer to the previous Bitcoin analysis article here.HerePlease refer to.
This is the place where the 4-hour chart analysis judged an uptrend.
Prices surged after a period of consolidation.
■15-minute chart (entry trigger)
The yellow vertical line area is where I judged uptrend on the 4-hour chart.
The yellow circle area indicates a TF2-aligned long entry point. The valley long entries are at break-even or stop loss, but the final TF1 long entry was successfully captured.
That concludes the results for the six currency pairs from the previous analysis.
From September 25 to 28, over four days, out of 25 entry points, there were
23 wins and 2 losses
The result is as stated.
By solidly performing environmental recognition, you can narrow entries to advantageous points.
By the way, I use the 15-minute and 4-hour charts, but the concept remains the same if you change the time frame.
・1-minute + 15-minute
5-minute + 1-hour
15-minute + 4-hour
4-hour + weekly
Daily + Monthly
These are the combinations. The time frame two levels above the entry chart is used as the environment recognition.
That concludes it.
I hope this is of some help to everyone.
