

Stardust Edge Trade September 24, 2023 Nikkei Chart
"Stardust Edge Trade"
Thank you for viewing.
GoGoJungle interview part 3 has been published.
https://www.gogojungle.co.jp/info/20895
Today, I would like to review the Nikkei 225 chart.
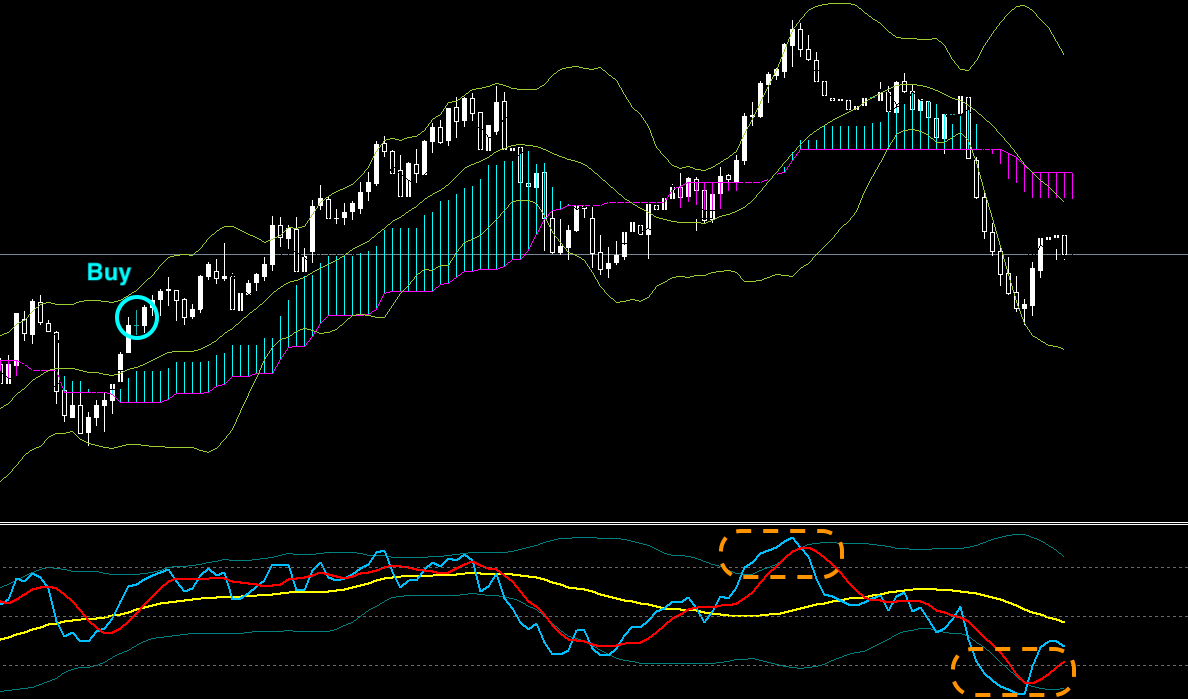
NIKKEI225 4-hour chart
The first buying point on the chart is a point where there is little doubt and trading is possible.
Recently, there are signals of both uptrend and downtrend, but the oscillators both indicate "overbought/oversold," so you can ignore them.
Going forward, depending on oscillator signals, you may consider a "sell."
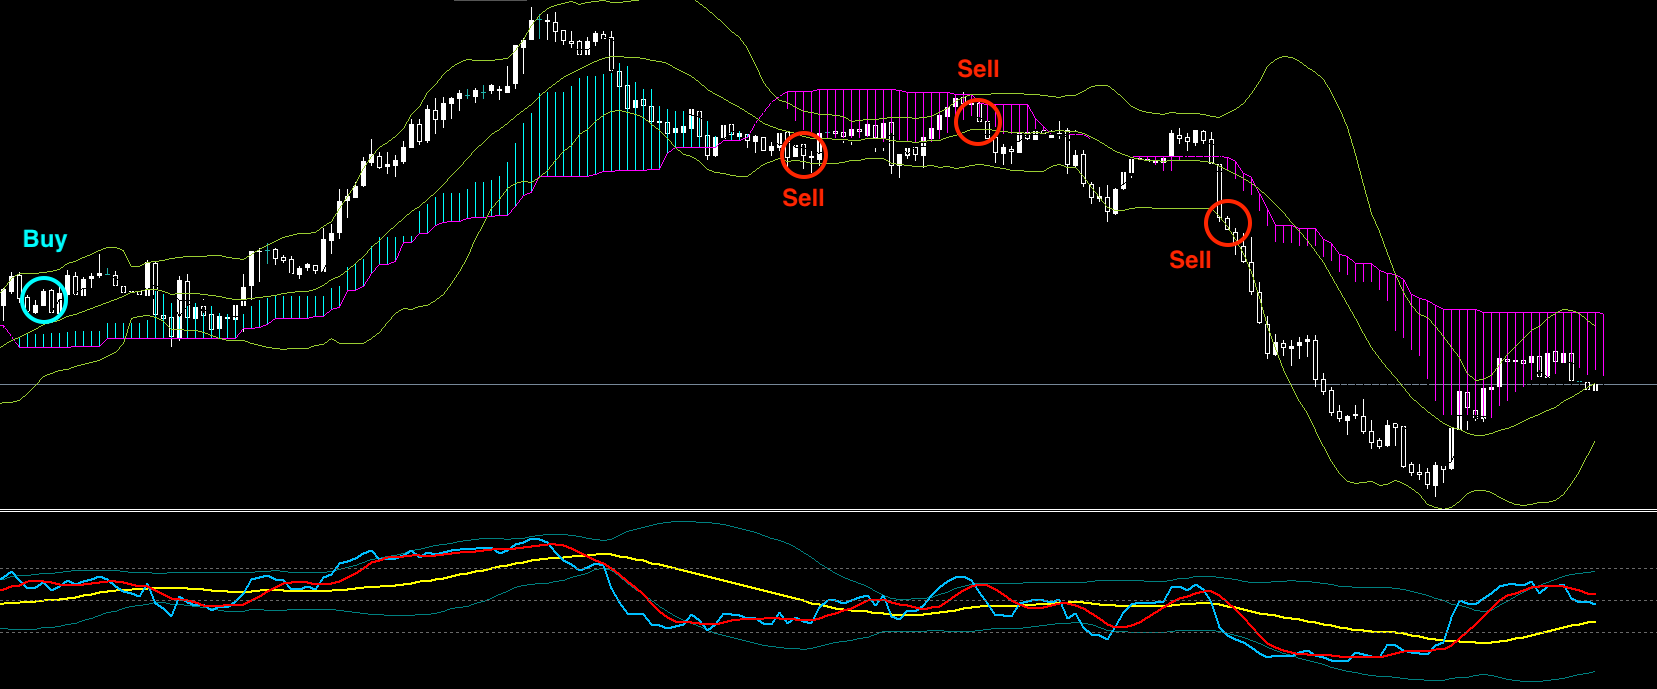
NIKKEI225 1-hour chart
Here, the trend signals appear very cleanly.
For reference, it shows buying and selling points, but with such solid trends, as long as you don't miss the direction and timing, any method should have a high win rate.
Lately, the oscillator gives a good basis for judgment as well.
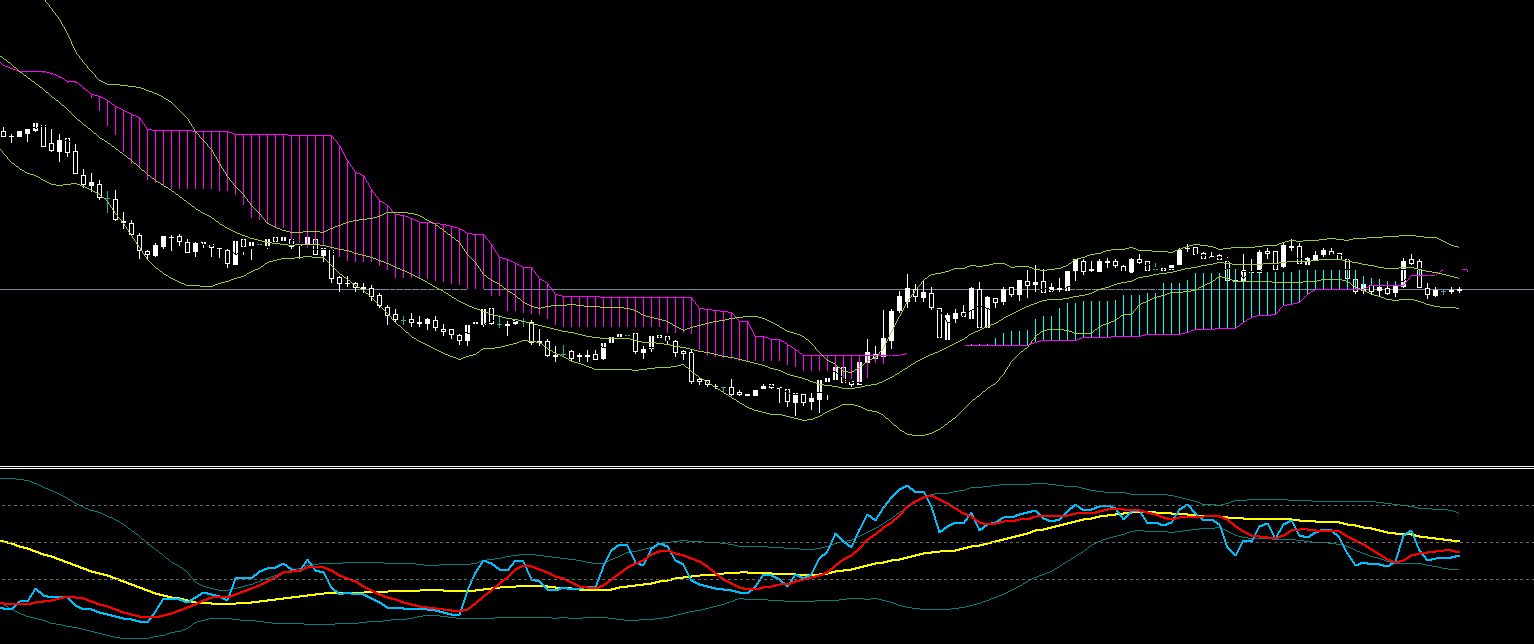
NIKKEI225 15-minute chart
This chart also makes the trend very easy to understand.
The buy/sell points can be clearly realized with the TP/SL settings according to the "Stardust Edge Trade" method, yielding solid profits.
"Stardust Edge Trade"