[September 24, 2023] Chart considerations using the indicators of heaven and earth
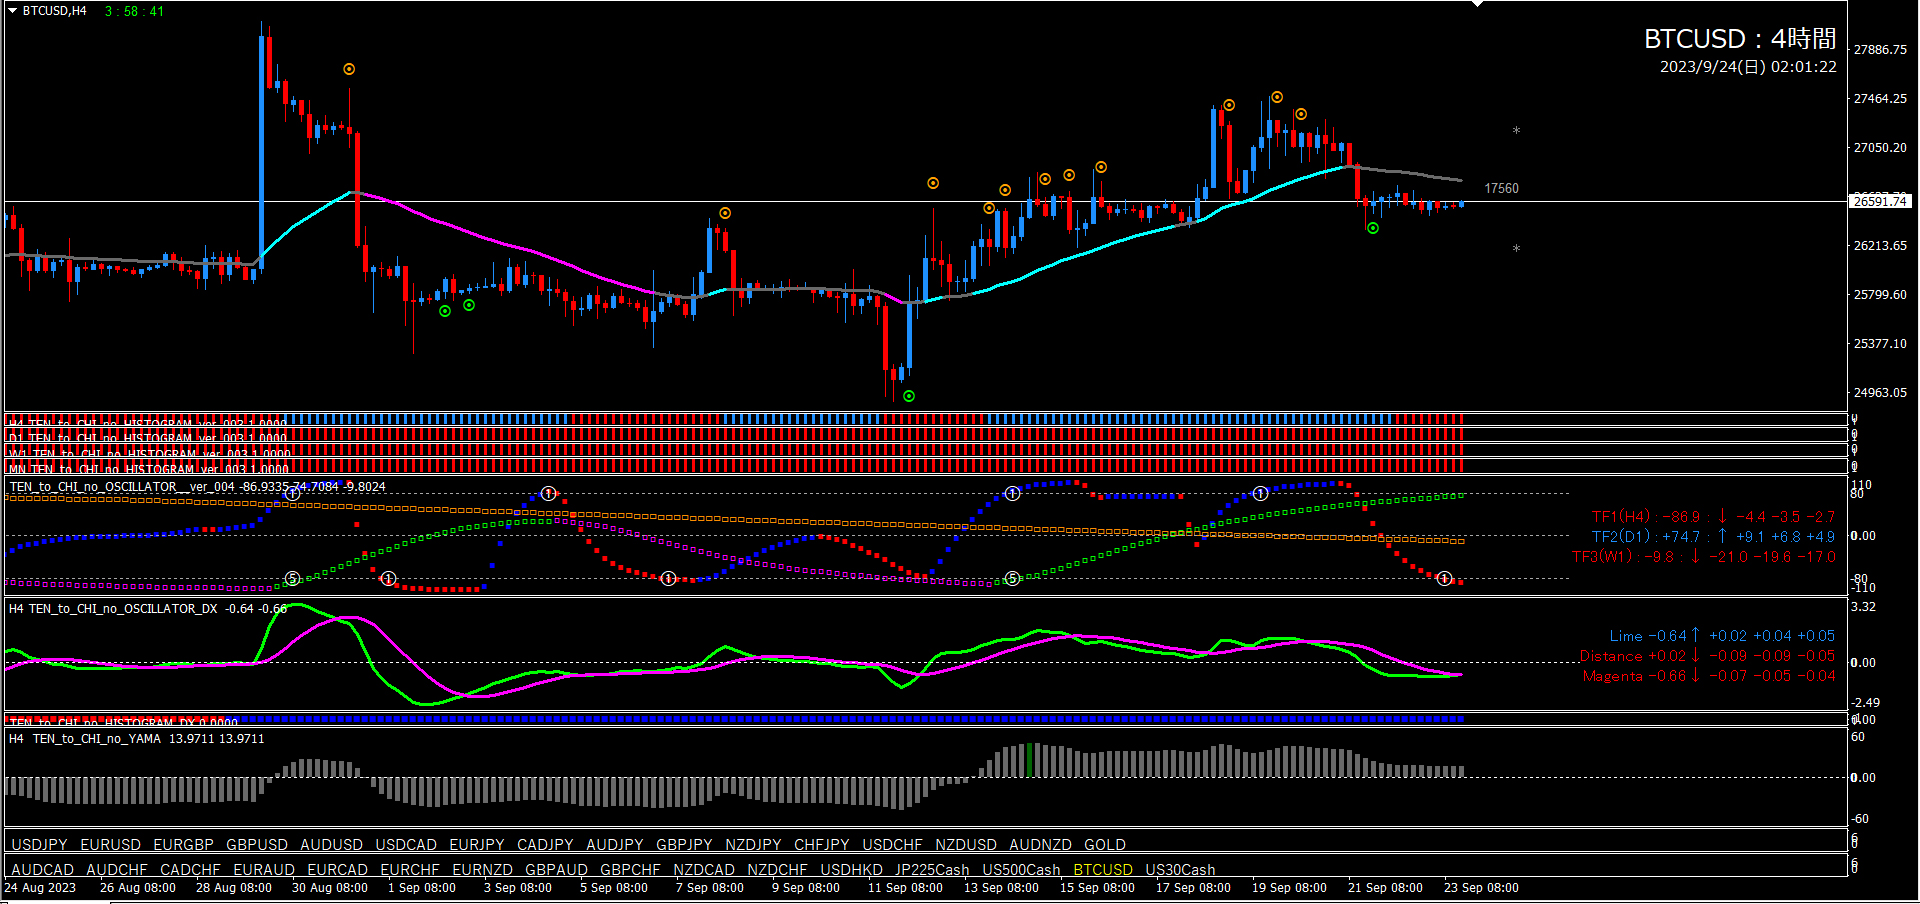
This time we will examine six currency pairs: Dolcan, Aussie NZ, Oz Cana, Euro OZ, New Zealand Canada, and Bitcoin charts.Isn’t it the first time we’re covering Bitcoin in an article? This tool demonstrates similar power across all MT4-tradable instruments (stocks, forex, CFDs, futures, cryptocurrencies), so it functions reliably even for Bitcoin.
I apologize for the personal note, but following last year, this year as well Gogojan Award 2023 nomination has been made. This is entirely thanks to everyone who supports us. I am sincerely grateful.※ Last year, among a total of 7,476 candidates, we were selected as one of 13.
This time, to commemorate the Gogojan Award 2023 midlist, we have prepared a special coupon for the first 20 people. ※ Please note that this campaign is subject to change or termination without notice.
If you are considering the Ten-to-Chi Indicator, please take this opportunity to use it.

Special coupon: 3,000 yen off for Ten-to-Chi Indicator is here

Table of Contents

・This article mainly discusses chart analysis and backtesting using the “Ten-to-Chi Indicator.”
・The highest accuracy within this tool is based on the“15-minute chart + 4-hour chart simultaneous monitoring method”as the assumed approach.
・This tool is a groundbreaking trading tool that can be used without understanding classic FX theories (Elliott Wave, Dow Theory, Granger’s Law, cycle theory, price action, Fibonacci, support/resistance, channels, etc.).

Ten-to-Chi Indicator is a trading method using the original indicator developed by Abe-san released in February 2022.
Thanks to everyone's support, we received the“GogoJungle Award 2022”.
■ Ten-to-Chi Indicator
https://www.gogojungle.co.jp/tools/indicators/35780
■ Ten-to-Chi Mountain
https://www.gogojungle.co.jp/tools/indicators/37744
■ Ten-to-Chi EA ~ Semi-automatic trading system ~
https://www.gogojungle.co.jp/tools/indicators/43213
■ Ten-to-Chi Dashboard
https://www.gogojungle.co.jp/tools/indicators/46257">https://www.gogojungle.co.jp/tools/indicators/46257">https://www.gogojungle.co.jp/tools/indicators/46257https://www.gogojungle.co.jp/tools/indicators/46257
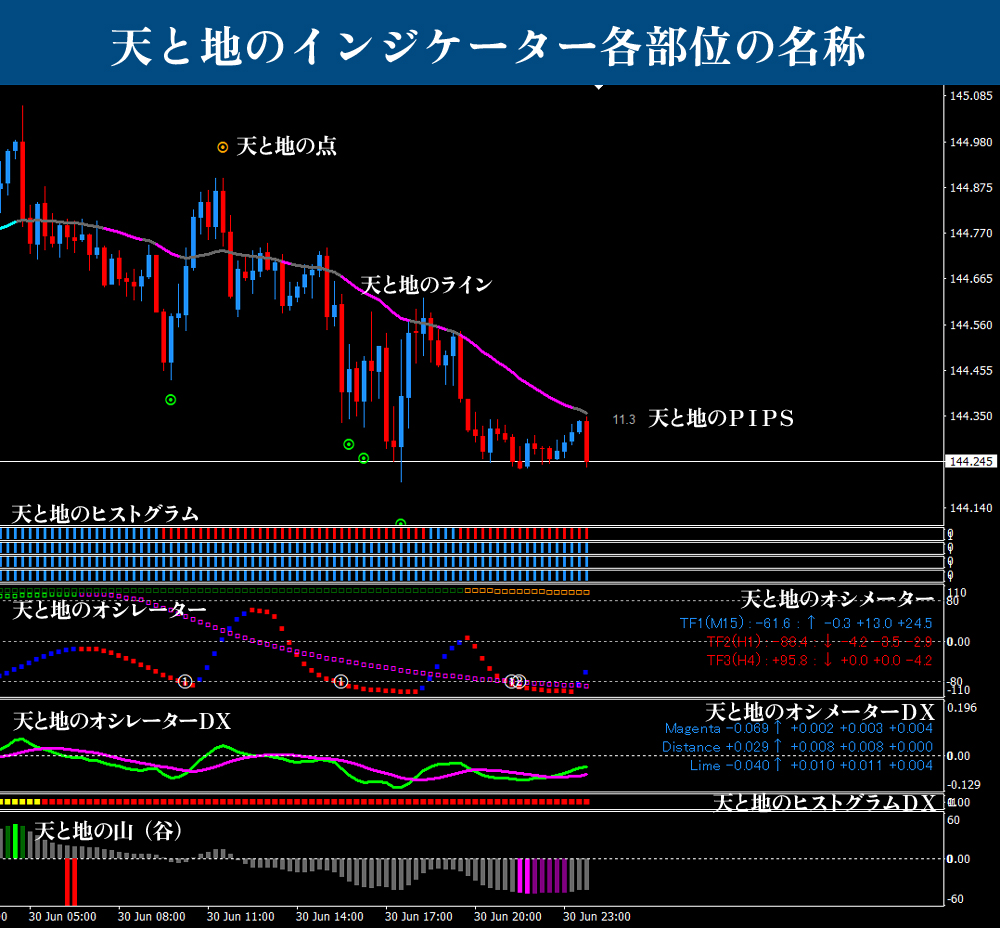
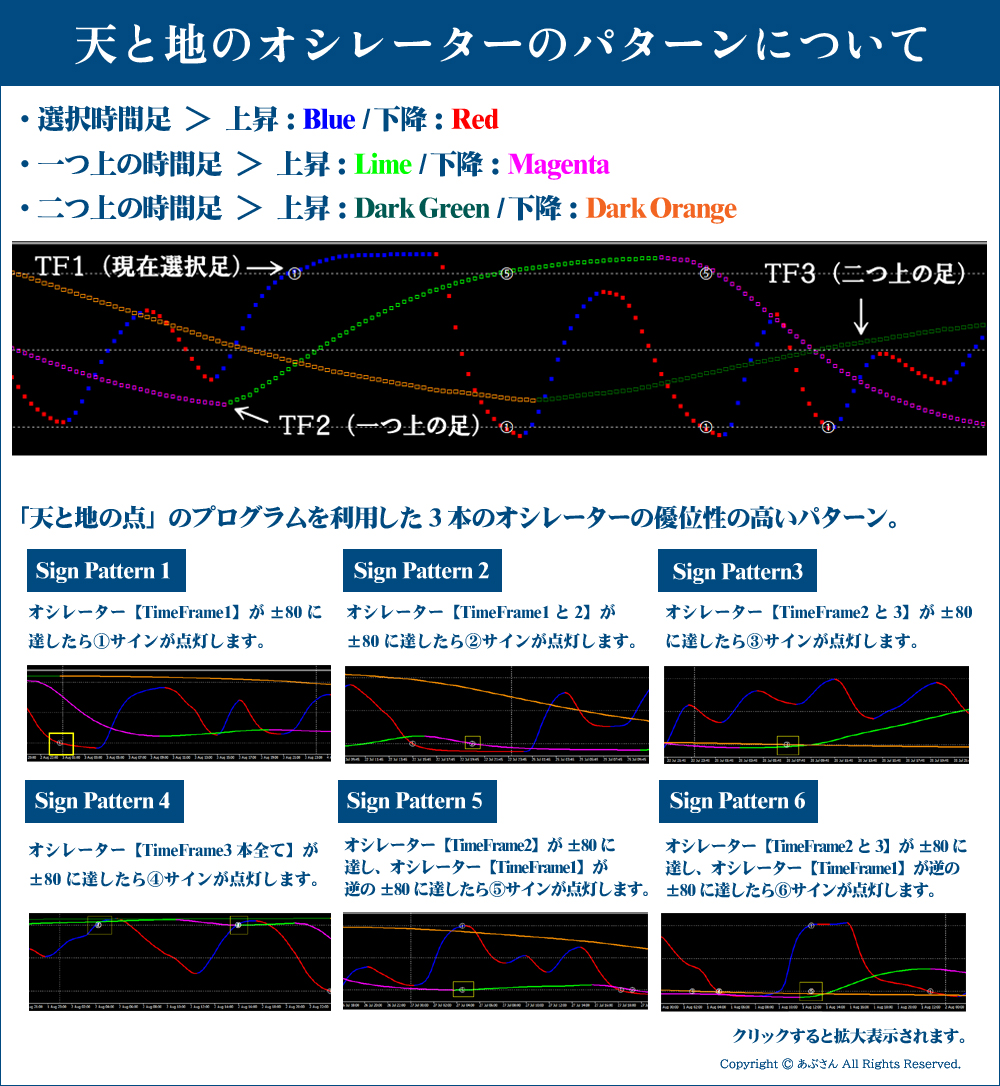
※For terminology used in this blog, please refer to the sections below: “Names of each part of Ten-to-Chi Indicator” and “Patterns of Ten-to-Chi Oscillator.” If you have any questions, please refer to the Ten-to-Chi Indicator sales page. Users should have no problem by reading the user manual. If you’re already a user, it’s fine to read the instruction manual.
Now, let’s move on to the analysis.
Thank you in advance!
※ All images enlarge when clicked.

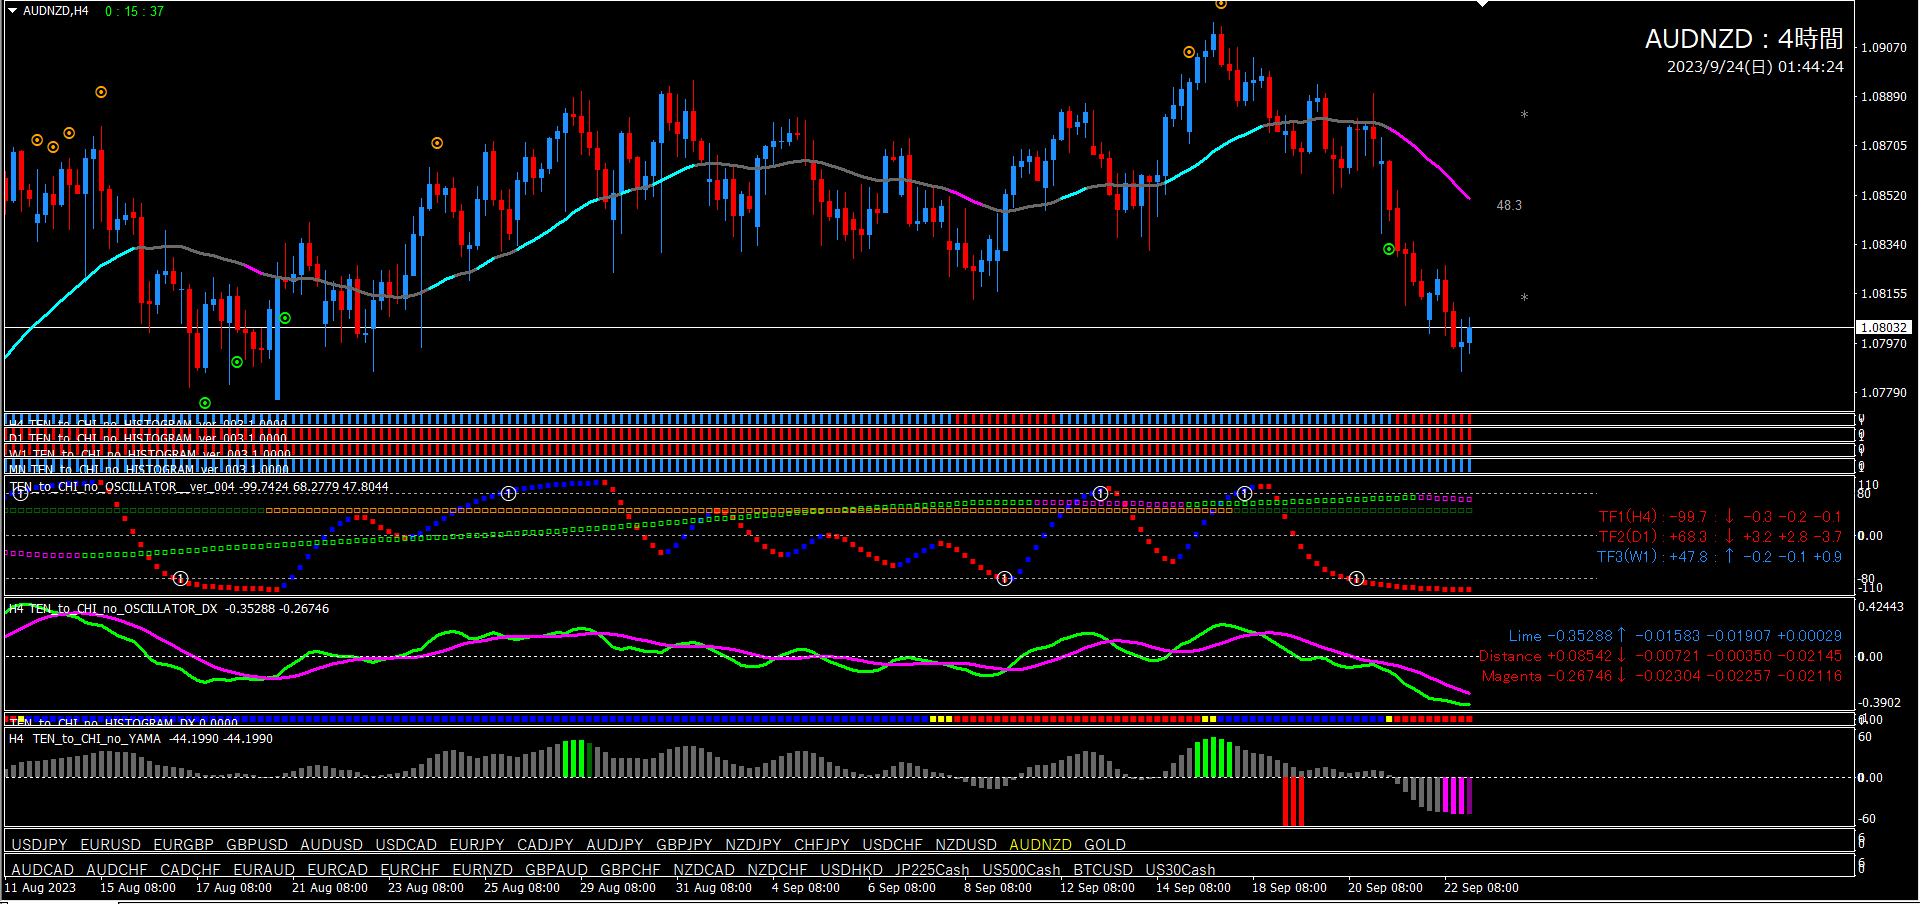
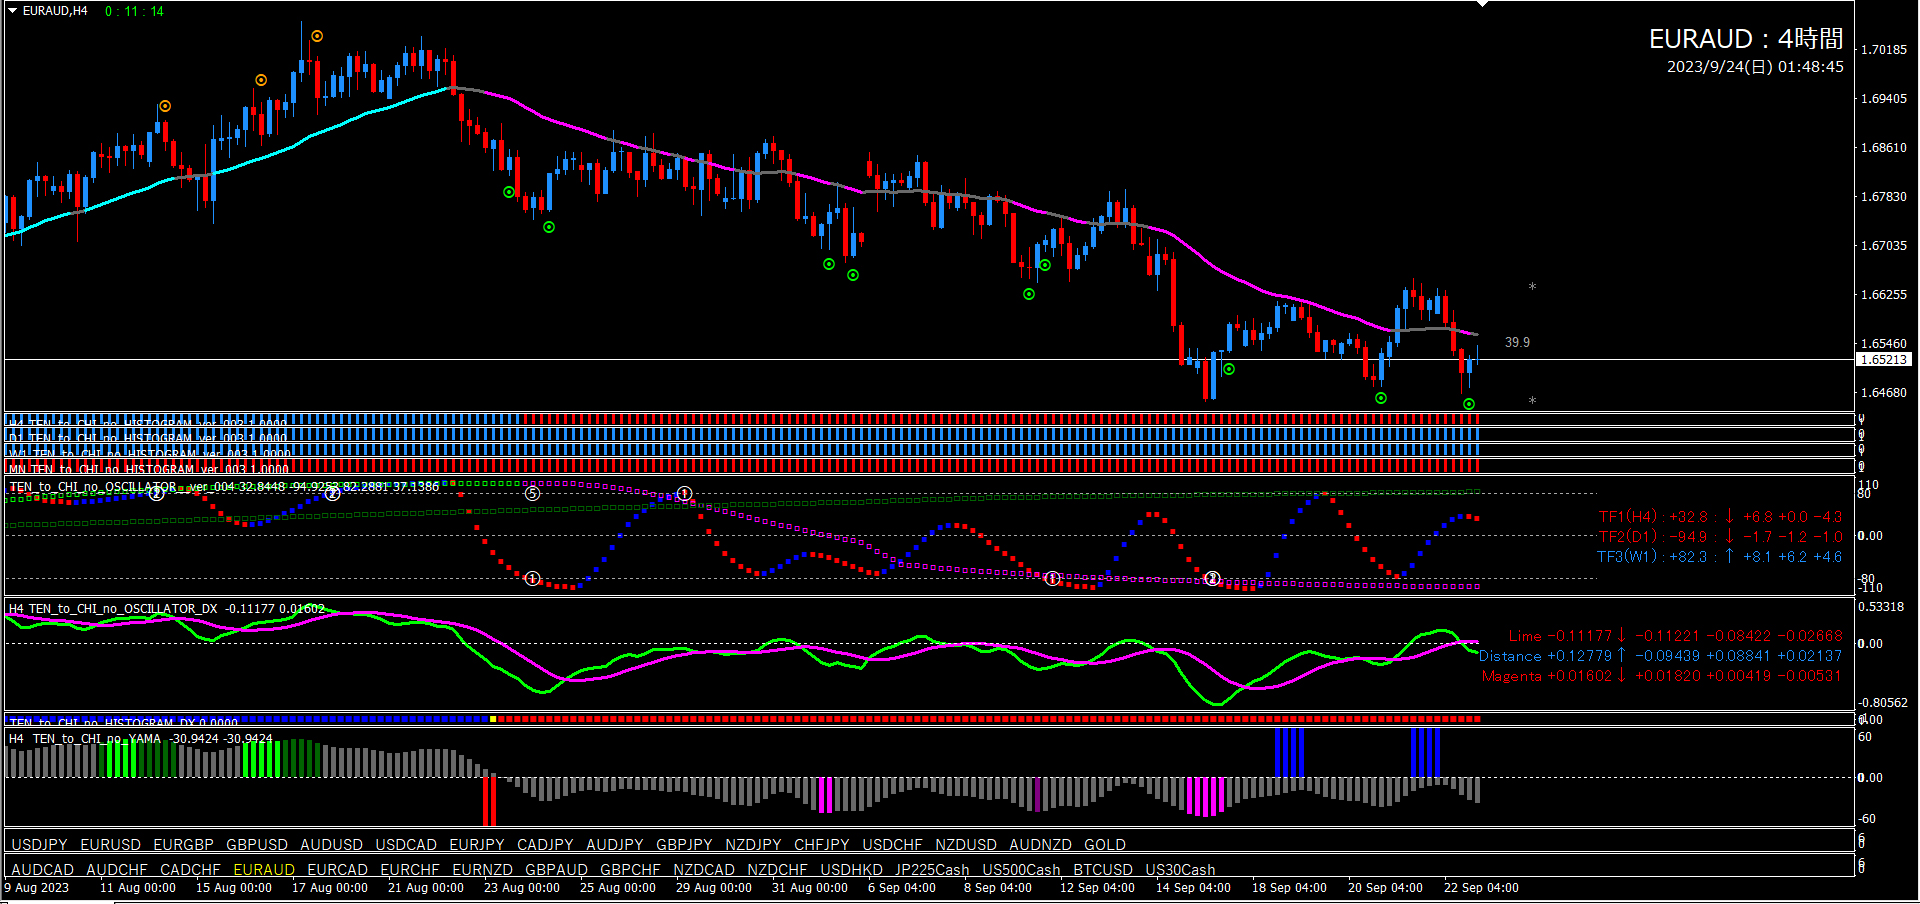
■ 4-hour chart (environment recognition)
First, check the position and direction of Oscillator TF2. It’s in a downtrend. TF1 also turns downward. Conditions look good, but I’m concerned about the DX shape (Lime is rising), so I will consider a bearish bias only after a complete downward cross. A recent valley has appeared as well.

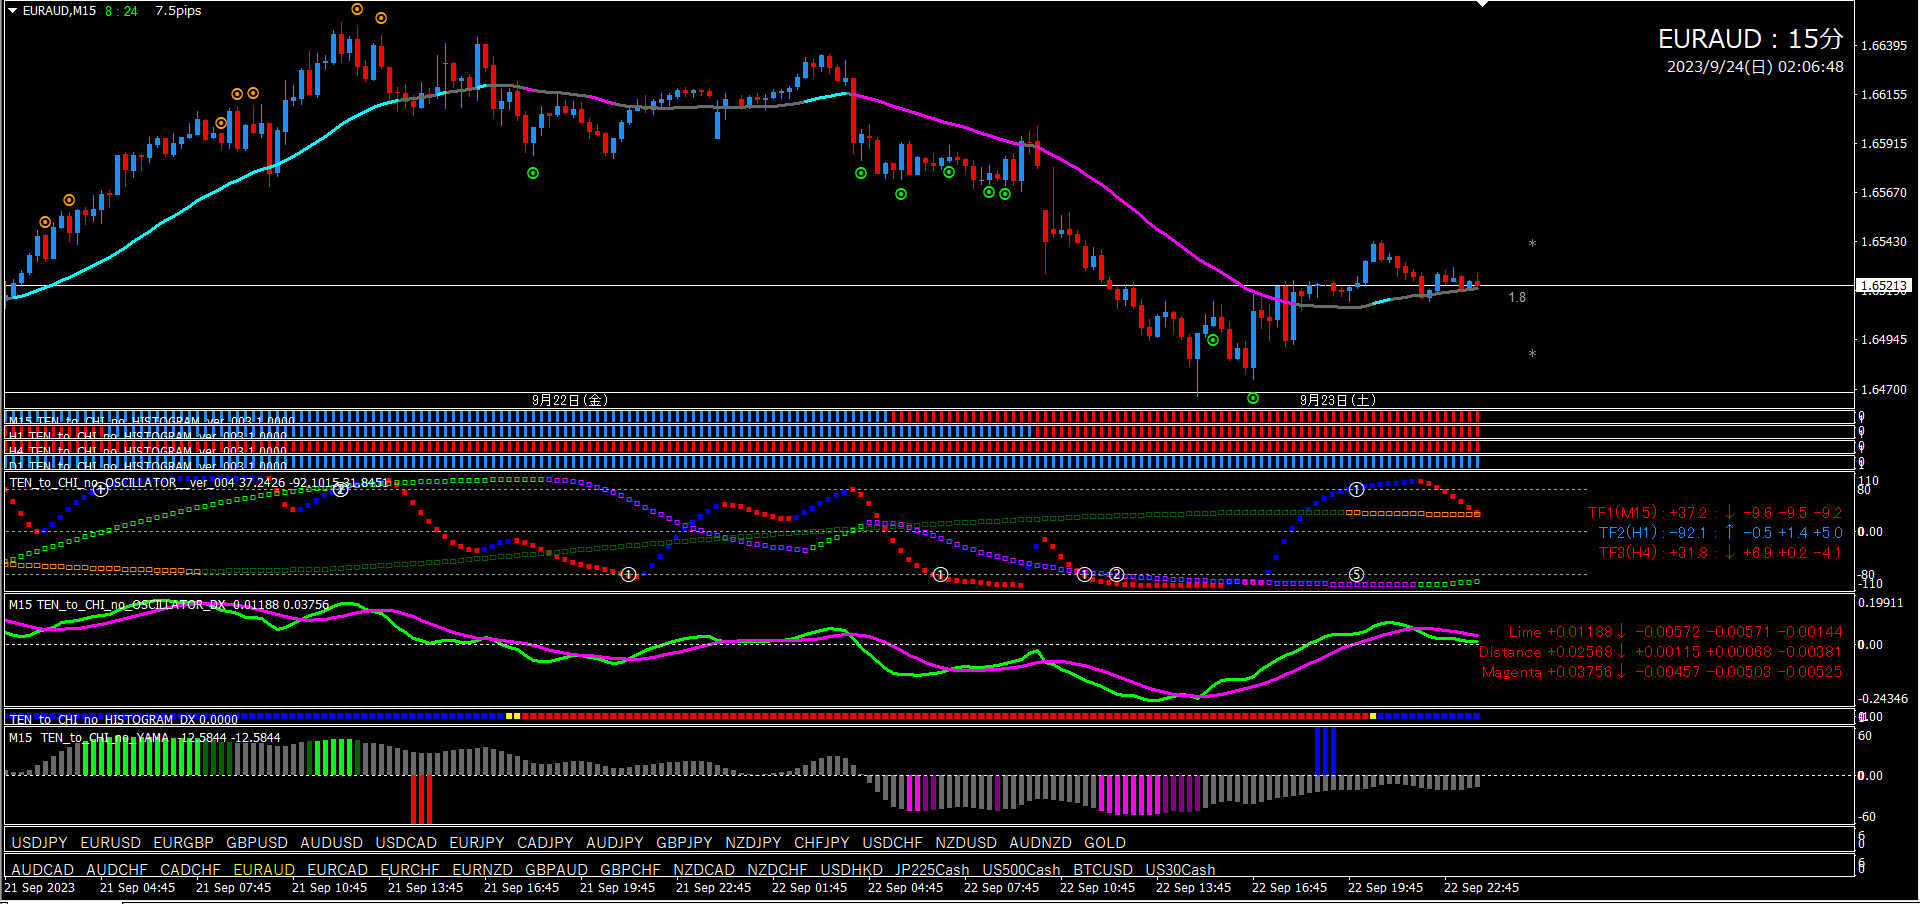
■ 15-minute chart (entry trigger)
When the 4-hour chart is bearish, we’ll only target short entries on the 15-minute chart.
Again, start by checking Oscillator TF2. It’s currently rising, so you need to wait for a downturn.When TF2 turns downward, enter on a short-entry signal as the basic flow.
Since Oscillator DX has already formed a downward cross, if a short-entry signal appears before TF2 turns downward, you may enter (going against TF2’s direction). The manual explains the advantage of DX for such scenarios, so please refer to that for users.
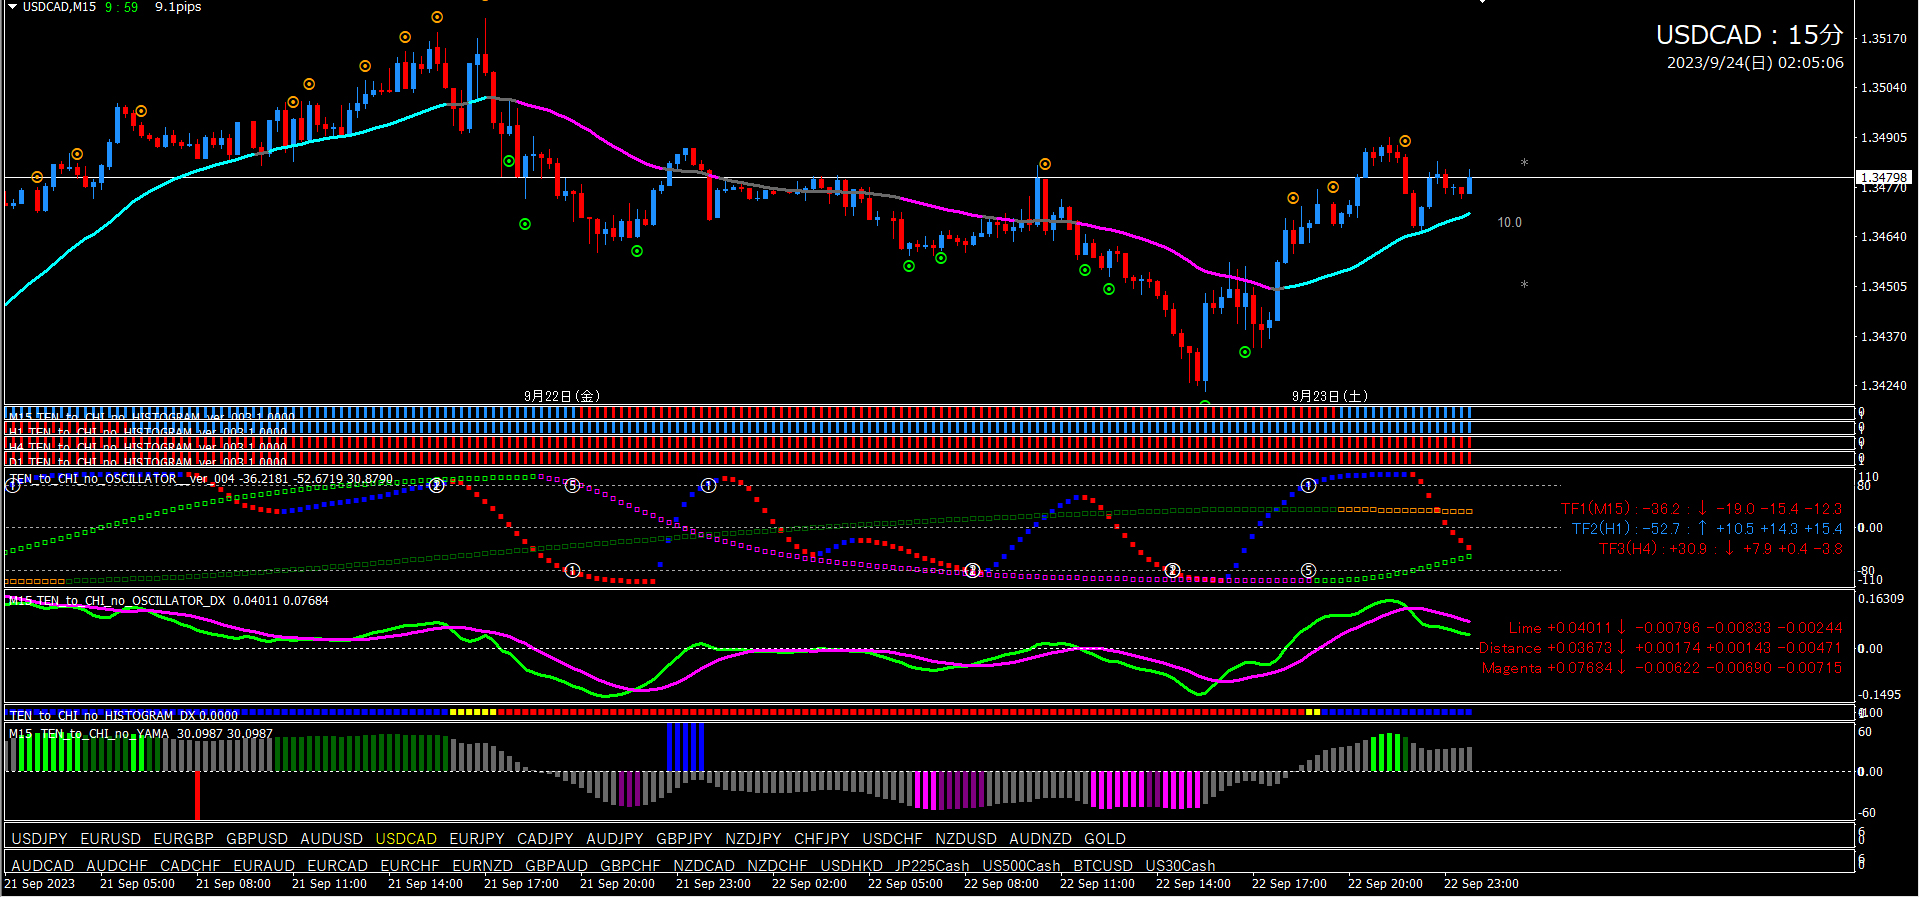
■If using Ten-to-Chi EA (on 15-minute chart)
Since the current candlestick is above the line (indicating a possible short-entry signal), once TF2 downward turn is confirmed, set EA Pattern ①. However TF2 has just started rising, so depending on chart conditions at the time of the turn, final decision on which EA pattern to use will be made.
■If using Abe-san Signal (on 15-minute chart)
For those who have Abe-san Signal, you can long-entry on Signal 1 after waiting for Signal 2. In Abe-san Signals, if the 4-hour trend is clearly established, you can ignore the direction of Oscillator TF2 and other evidence. It is a very strong signal, so no issue. The usage method is the same for other currency pairs, so I will omit it from the following analysis.

■ 4-hour chart (environment recognition)
■ 15-minute chart (entry trigger)
When the 4-hour chart is bullish, only target long entries on the 15-minute chart.
The 15-minute chart provides a good short-entry point, but we’re aiming for a long position. First, wait for Oscillator TF2 to rise.Then look for signal points, TF1, DX, valleys, for long triggers.

■Ten-to-Chi EA (on 15-minute chart)
First, wait for Oscillator TF2 to turn upward. When TF2 starts rising, decide which EA pattern to use based on the current situation. For example, if TF2 begins rising and the current candlestick is below the line, a long-entry signal is likely, so set EA Pattern ①. Depending on Oscillator TF1’s position, EA Pattern ② may be preferable. At present, it’s not possible to determine which to use.

■ 4-hour chart (environment recognition)
Oscillator TF2 is descending, overall bearish bias.. Lime↓Distance↓, Magenta↑ combination, so bearish bias is acceptable. It’s better to wait for a downward cross, but looking at recent DX movement, the cross’s edge seems weak.
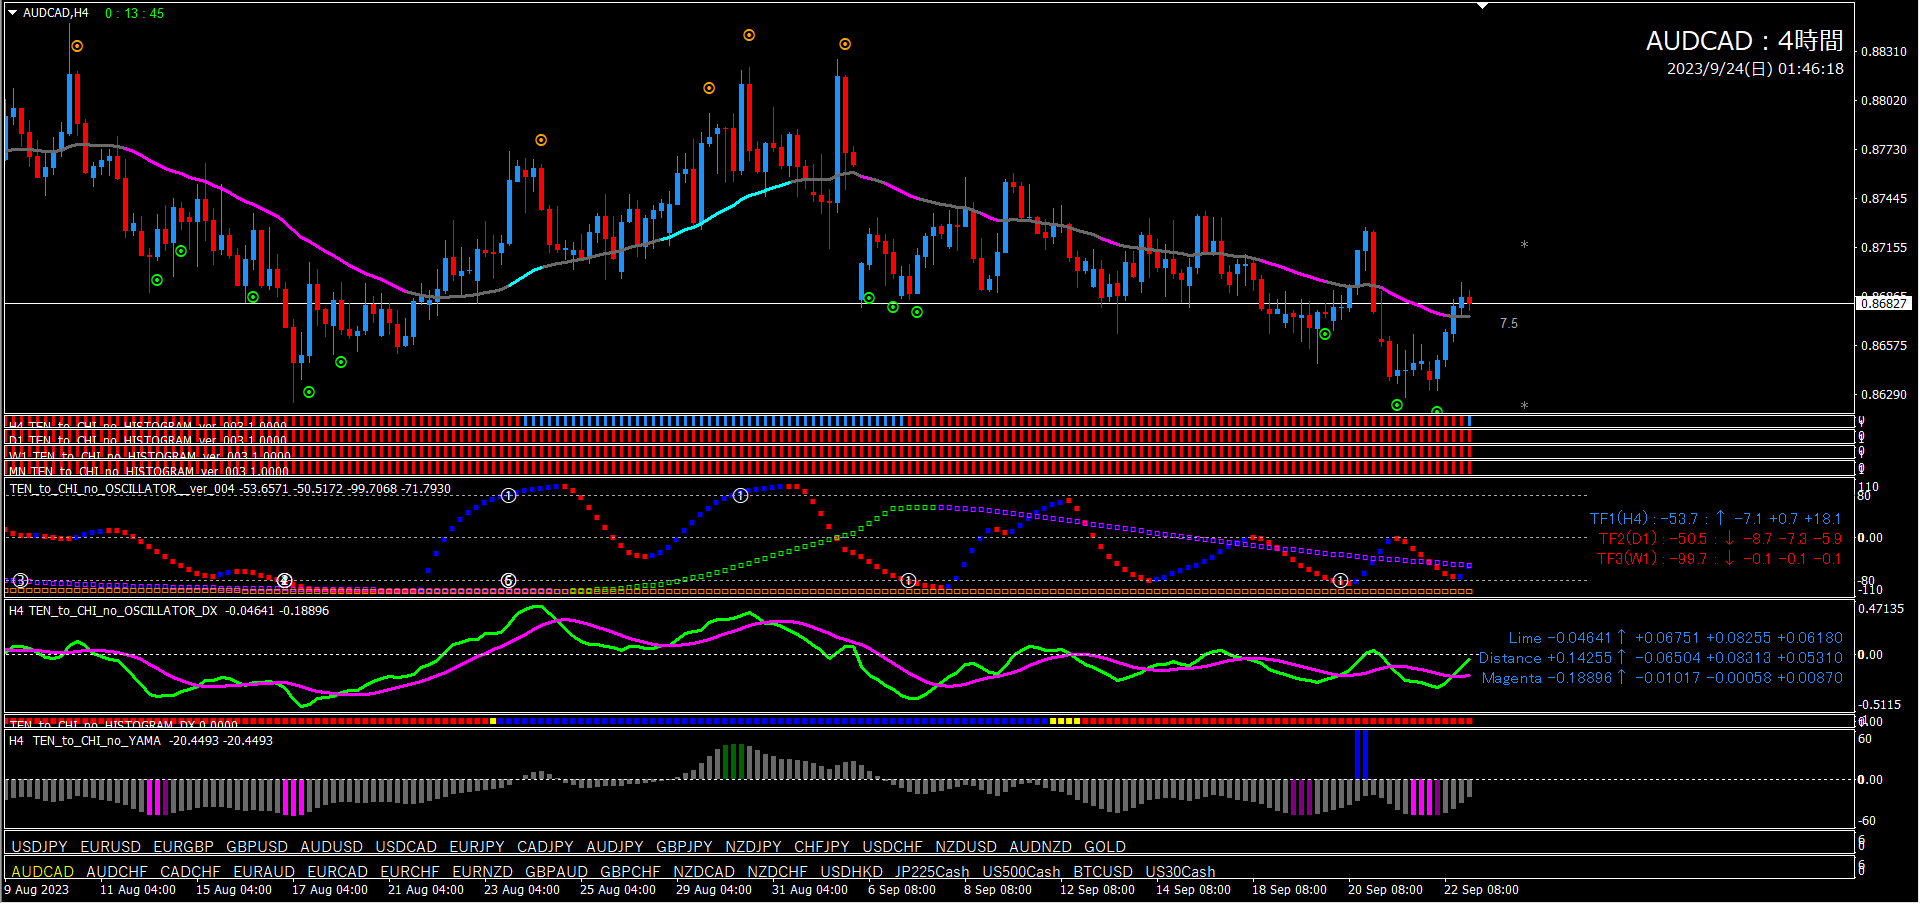
■ 15-minute chart (entry trigger)
When the 4-hour chart indicates bearish, only target short entries on the 15-minute chart.
Currently the scene is long-entry favorable, but we ignore it since bias is down.Future scenario: once Oscillator TF2 turns downward, attack with short triggers (signal, TF1, DX, valley).
■Ten-to-Chi EA (on 15-minute chart)
First, wait for Oscillator TF2 to turn downward. When TF2 begins to fall, decide which EA pattern to use based on the situation. Currently it is most similar to EA Pattern ①. If a valley occurs, we will enter EA pattern ④ at that time. When the valley turns off, automatic entry occurs.

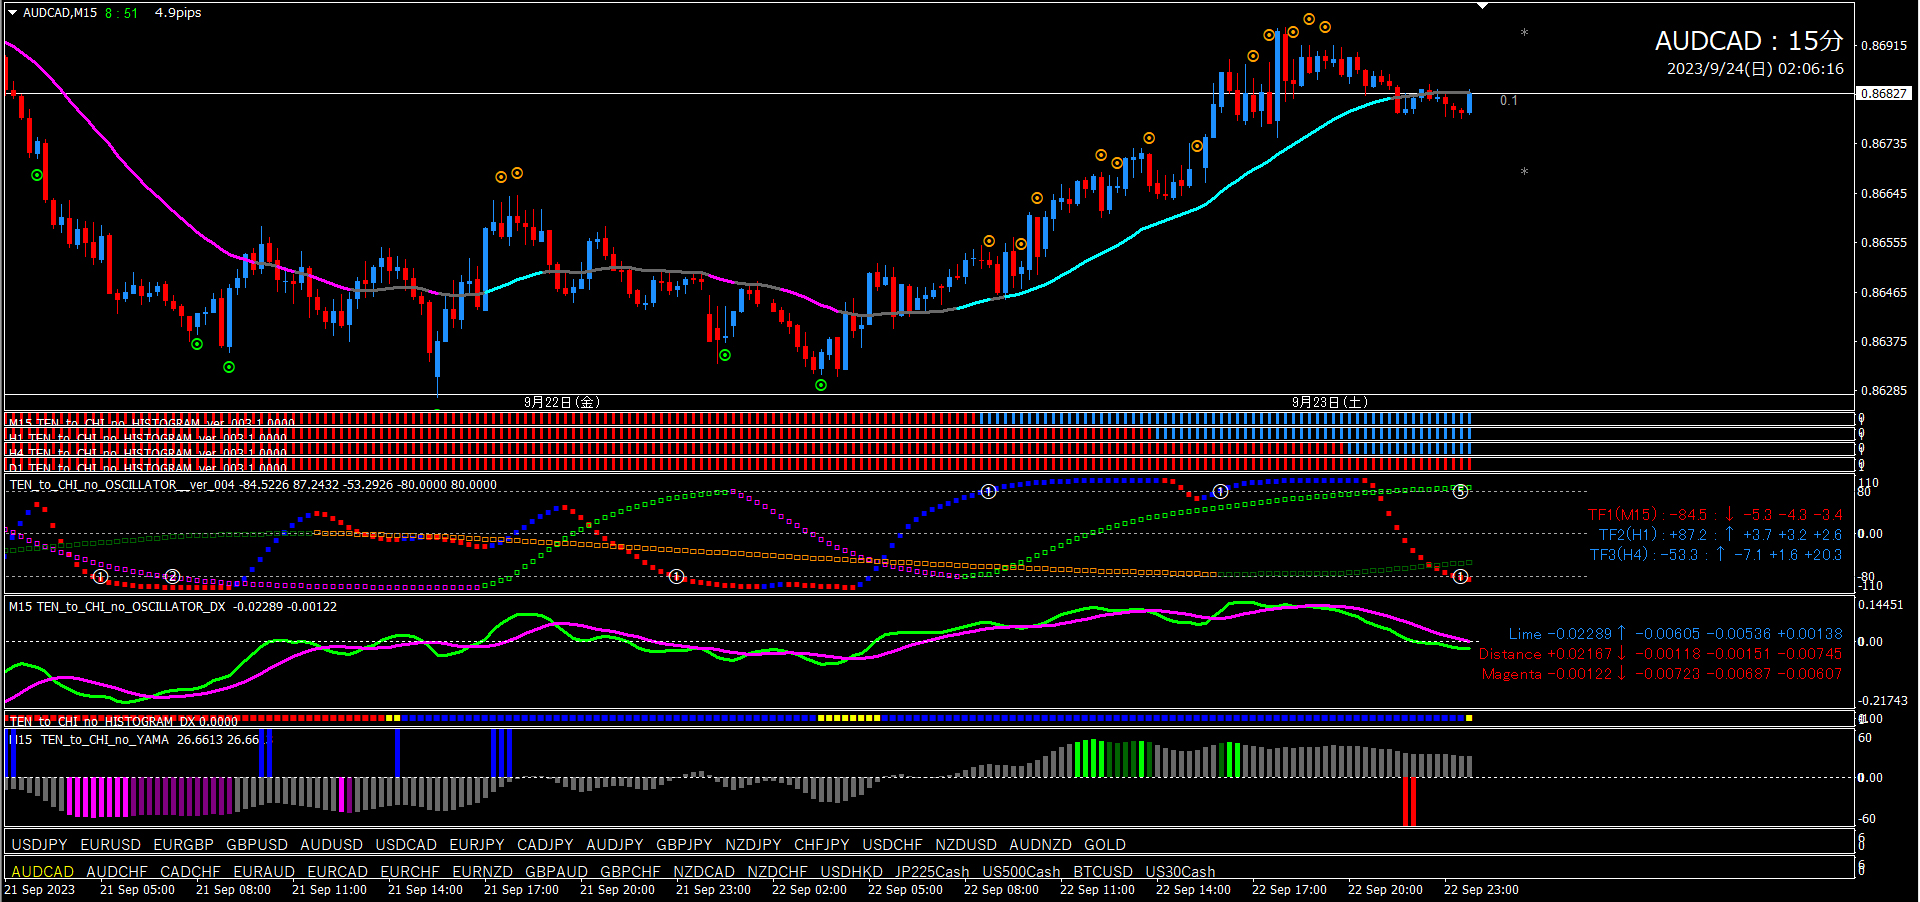
Oscillator TF2 is descending, TF1 also turning downward, a classic pullback selling pattern. However one important risk factor exists. A long-entry signal recently appeared. Historically, a signal’s bounce power is very strong. In such cases, if the candlestick fully breaks below the line, bearish bias is reset.
■ 15-minute chart (entry trigger)
Since the 4-hour chart shows bearish, we will only target short entries on the 15-minute chart.
Right now the 15-minute chart is a prime long-entry point. But we’re aiming for a short entry this time. Long-entry opportunities should be ignored. If the price rises in this scenario, there’s no need to regret: experience shows such moves often occur as irregular 4-hour movements. Aligning entries with the 4-hour trend has much greater edge.

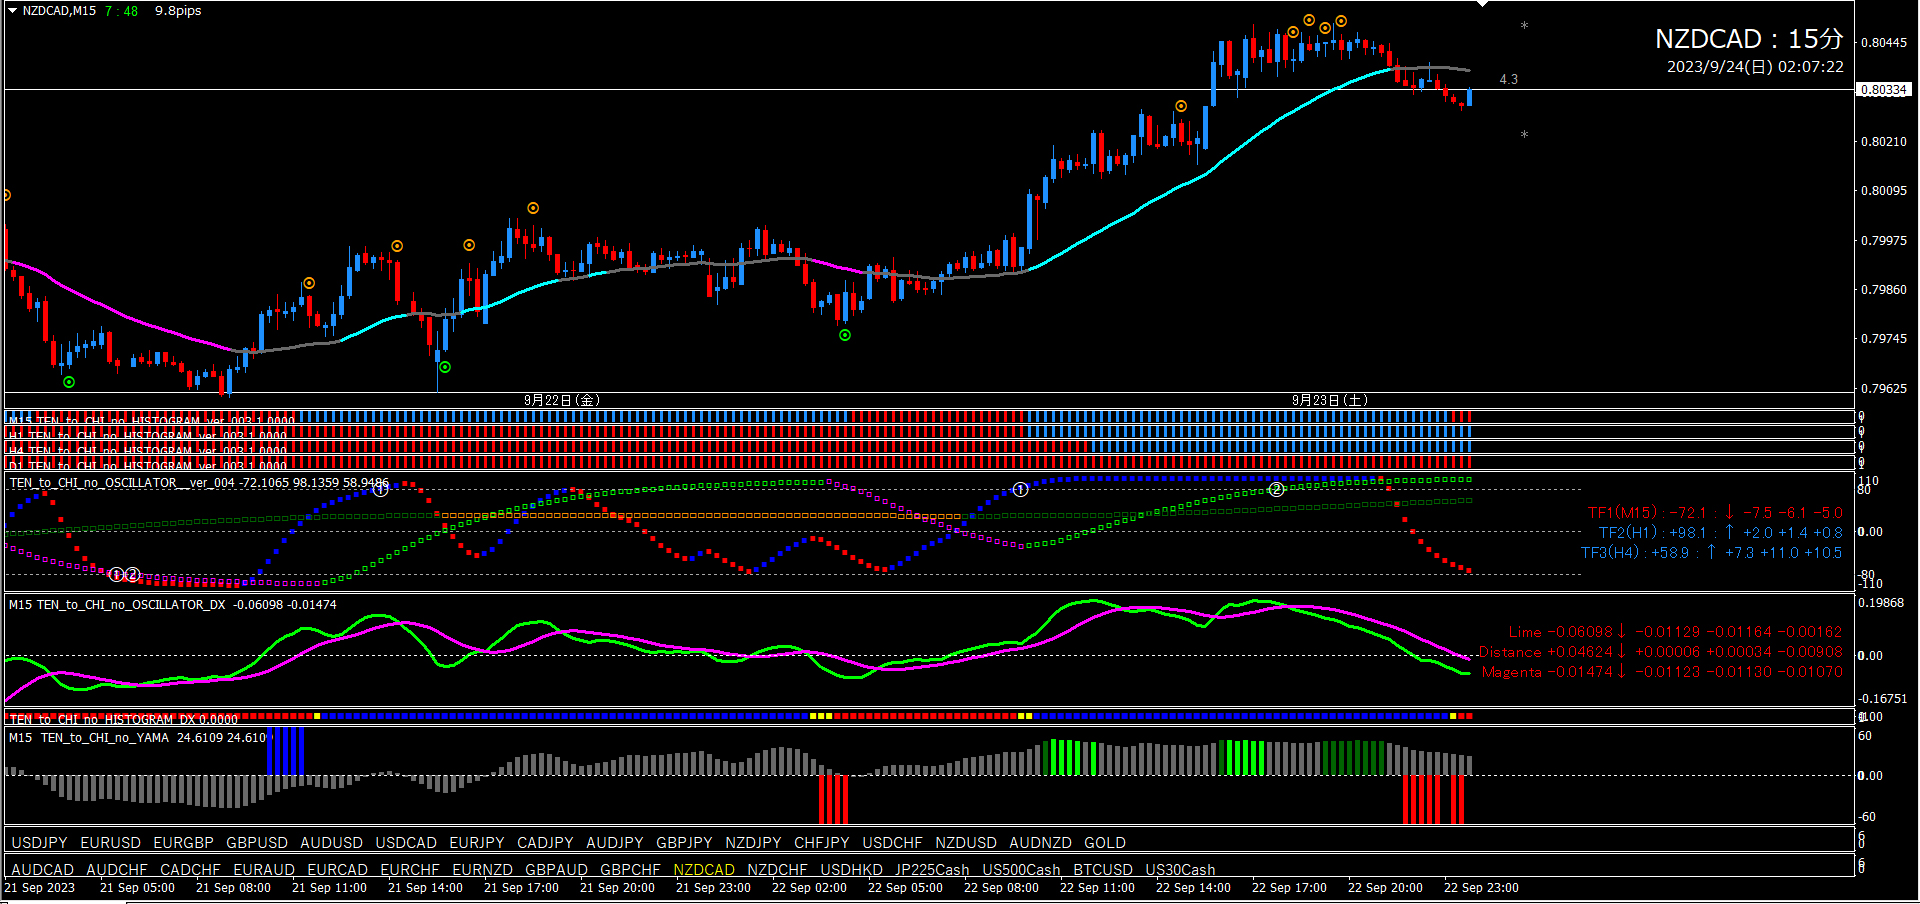
Oscillator TF2 is descending, TF1 near +80 (signals potential rebound), suggesting Oscillator signal ⑤. The candle positions indicate a short-entry signal may appear soon. Valleys have formed. Currently bearish bias may be appropriate, but a risk factor is that Oscillator DX is still rising. If this clears, a false breakout risk is reduced. Oscillator DX showsWhen these combine, bearish bias is appropriate. Of course, waiting for a proper downward cross is safest.

■ 15-minute chart (entry trigger)
When the 4-hour chart indicates bearish, only target short entries on the 15-minute chart.
Right now the 15-minute chart is an ideal long-entry setup. However, this time we are aiming for a short entry. If it rises afterward, there’s no need to regret. “I should have gone long” is understandable, but in my experience, such scenarios often occur due to a rare move on the 4-hour chart. Entries that do not go against the 4-hour chart have far greater advantage.If in this situation the price goes up later, there’s nothing to regret.
■■Ten-to-Chi EATen-to-Chi EA (on 15-minute chart) (on 15-minute chart)
First, wait for Oscillator TF2 to turn downward. When TF2 begins to fall, decide which EA pattern to use based on the situation. At this moment EA Pattern ① seems closest.First, wait for Oscillator TF2 to turn downward. When TF2 begins to fall, decide which EA pattern to use based on the situation. Currently EA Pattern ① seems most appropriate.

■ 4-hour chart (environment recognition)