

Usage of the "Visualization Indicator" (Part 113)
“Visualization Indicator” usage (that113)”
1. Advance and develop the “28 Currency Pairs List Indicator” into an indicator
“8CP Visualization Indicator” for NZDJPY. to be drawn
The “8CP Visualization Indicator” includes Oceania version, London version, NewYork version, AnyCP version. This time, I used the Oceania version.
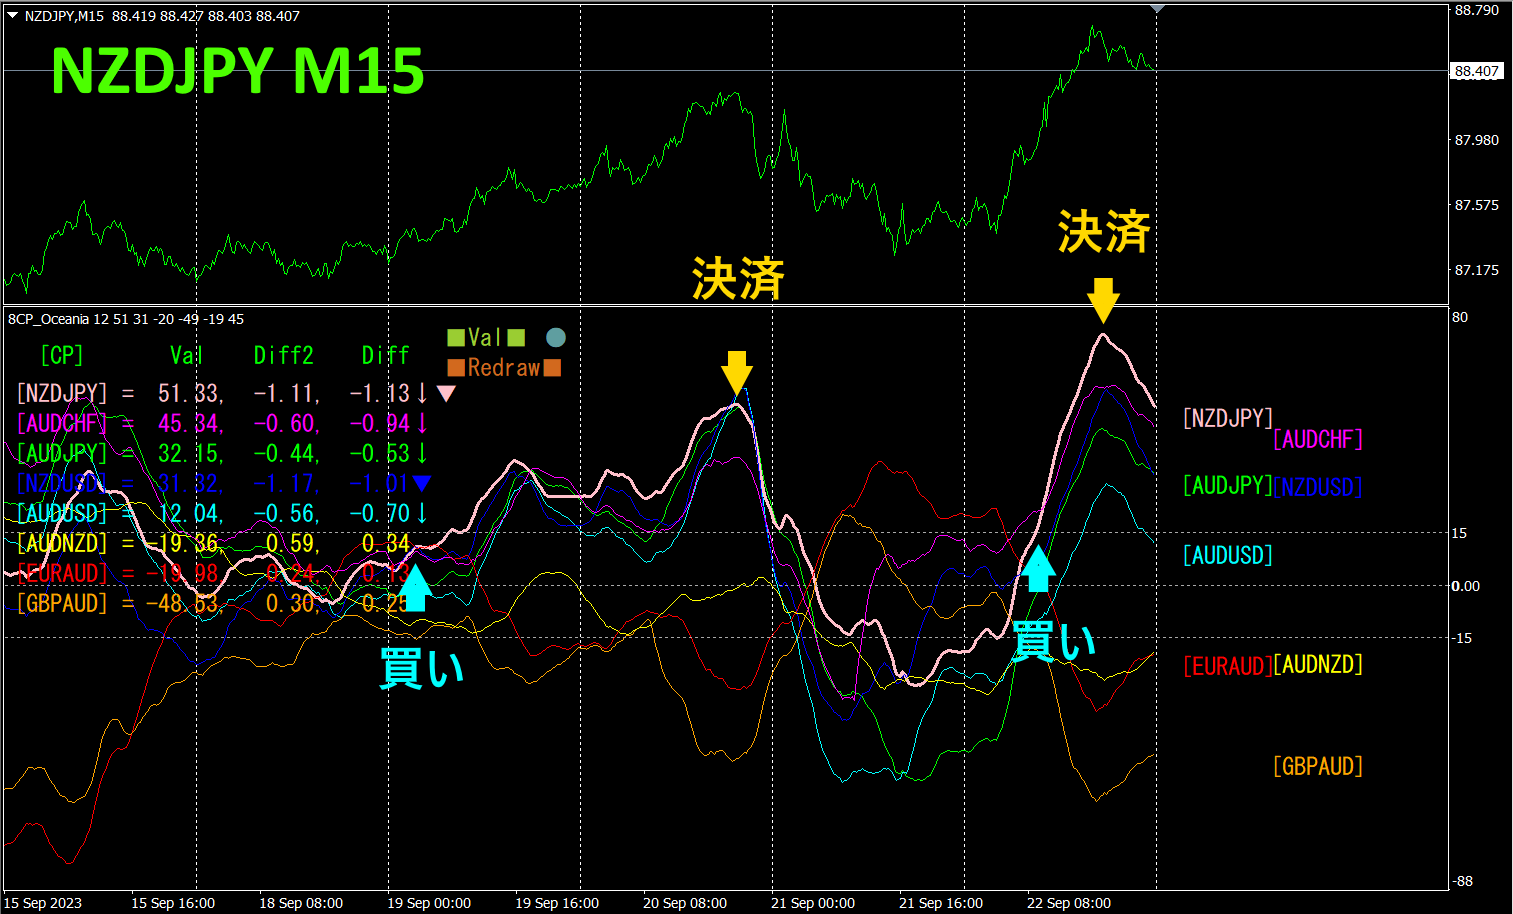
The upper half is the NZDJPY 15-minute chart. The lower half shows the results from the “8CP Visualization Indicator.” The pink thick line chart corresponds to NZDJPY.
Last week there were 2 moments of opportunity. On Tuesday and Friday, NZDJPY broke above other chart groups, so I entered a buy. As the graph reached a peak and reversed, I exited. The first entry yielded about 85 pips in profit, the second entry yielded about 67 pips in profit, for a total 152 pips in profit.
2. Best Select try the indicator
The following figure is a screenshot taken on September 19, 2023 at 22:38 (JST).
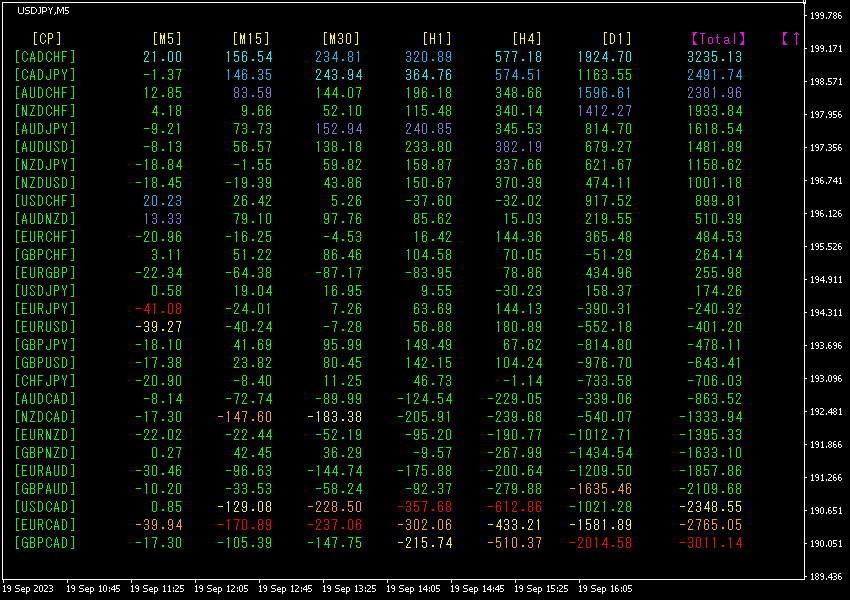
values are sorted in descending order. The topmost row, CADCHF, is blue for all timeframes, and the Total value is 3235.13, a large positive number. shows a strong upward trend.
Now, let’s look at the CADCHF chart.
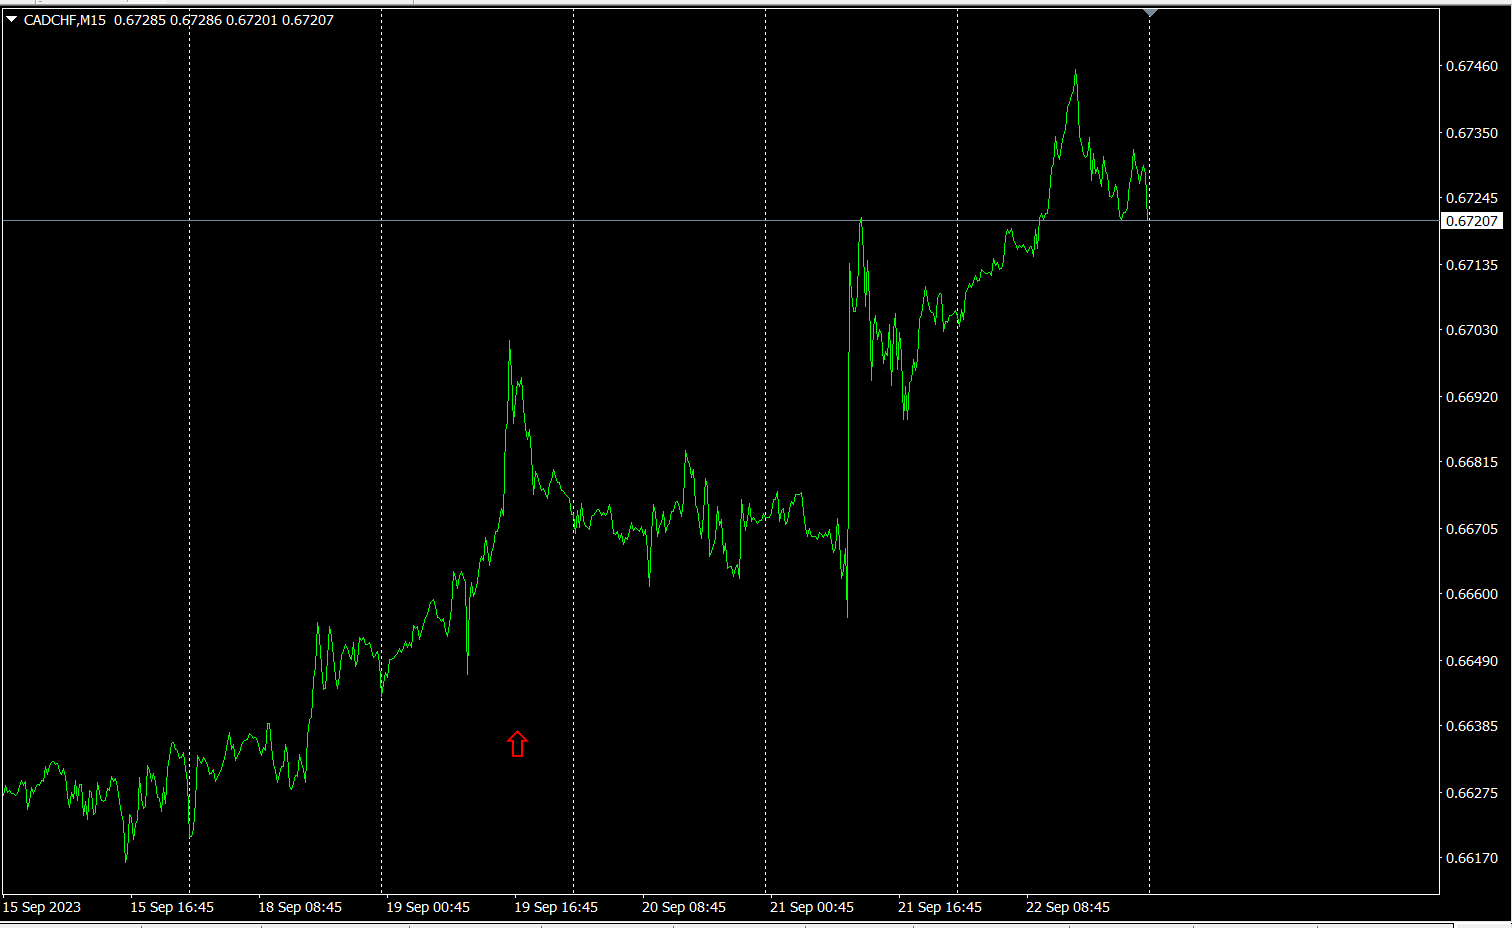
The red arrow marks the point where the screenshot was taken. It captures a sharp rise during the ongoing uptrend.
“28 currency pairs Best Select allows you to easily identify which currency among 28 pairs is experiencing the strongest trend, and also tells you whether to trade now using numeric values and colors. It provides an at-a-glance assessment of all currency pairs.
“28 currency pairs Best Select

https://www.gogojungle.co.jp/tools/indicators/35128
3. What happened to EURJPY, which I have been following since May of the year before last?
year month, I started tracking EURJPY’s moves.
To view the overall trend, I’m drawing the most recent about 3 weeks on a 30-minute chart.
Last time I wrote the following.
EUR tends to be slightly downward, is relatively flat. There is almost no clear direction, butJPY appears somewhat stronger.
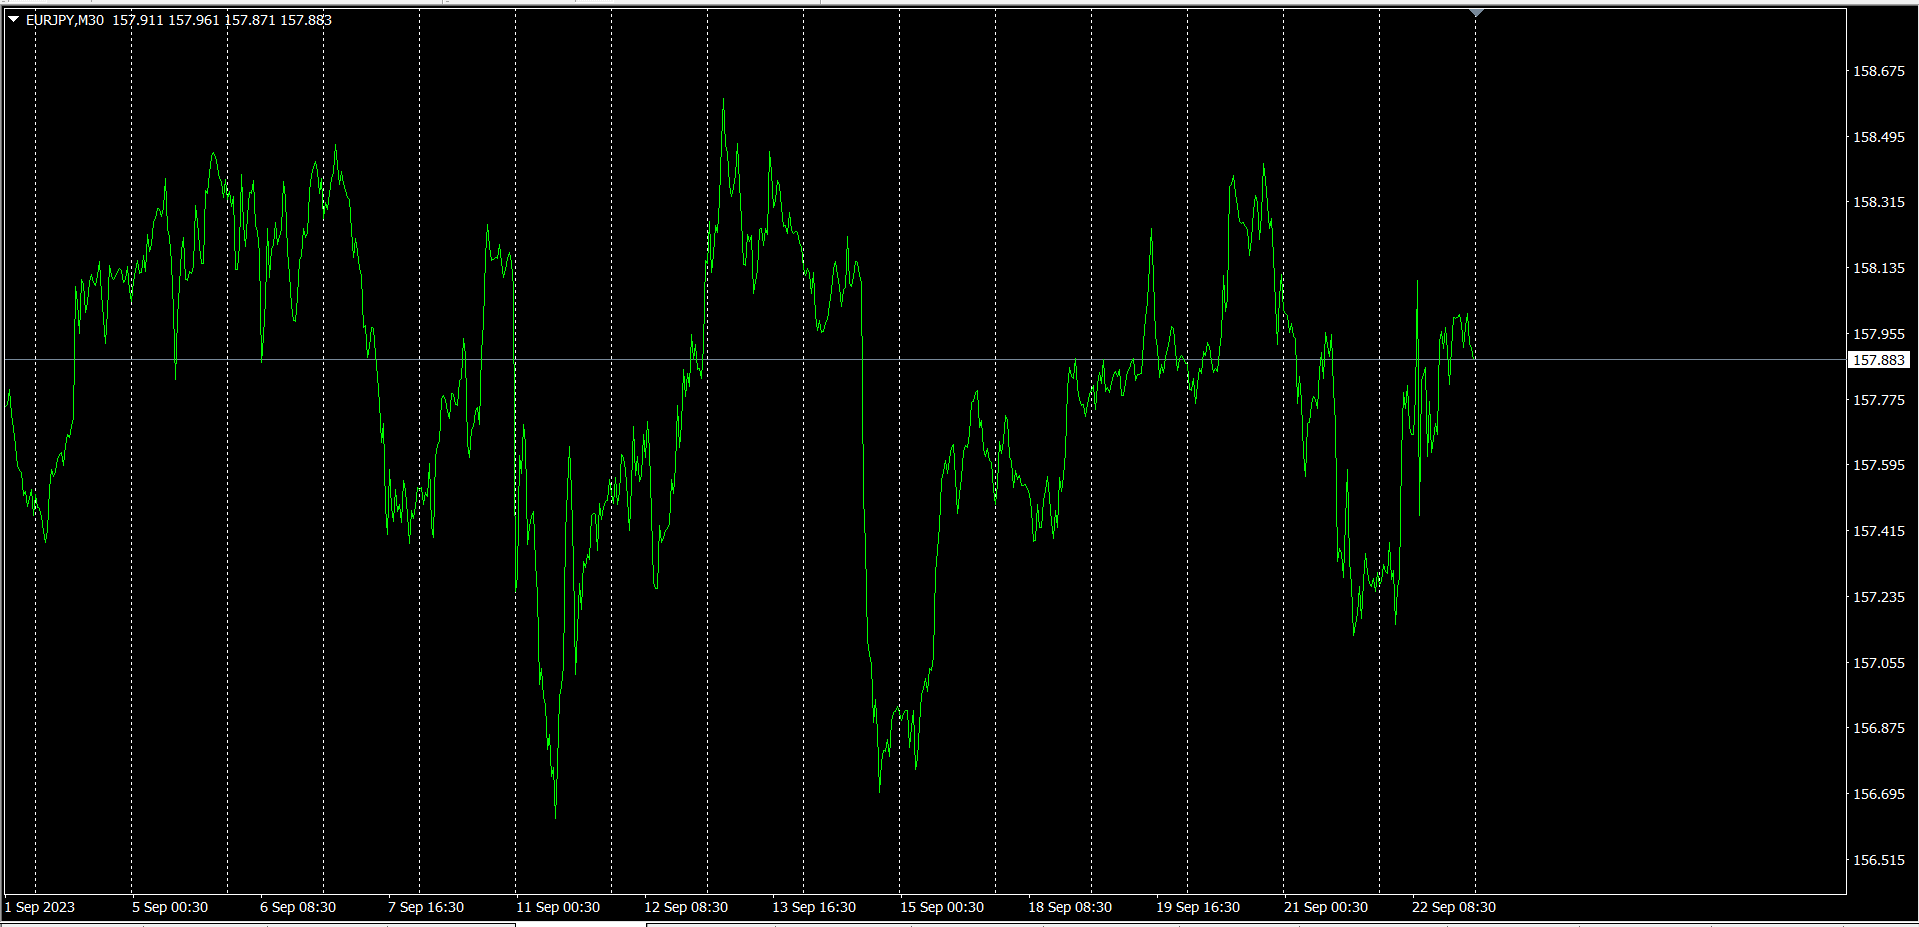
Overall, there is no clear direction. It’s moving in a range.
4 hour currency strength chart.
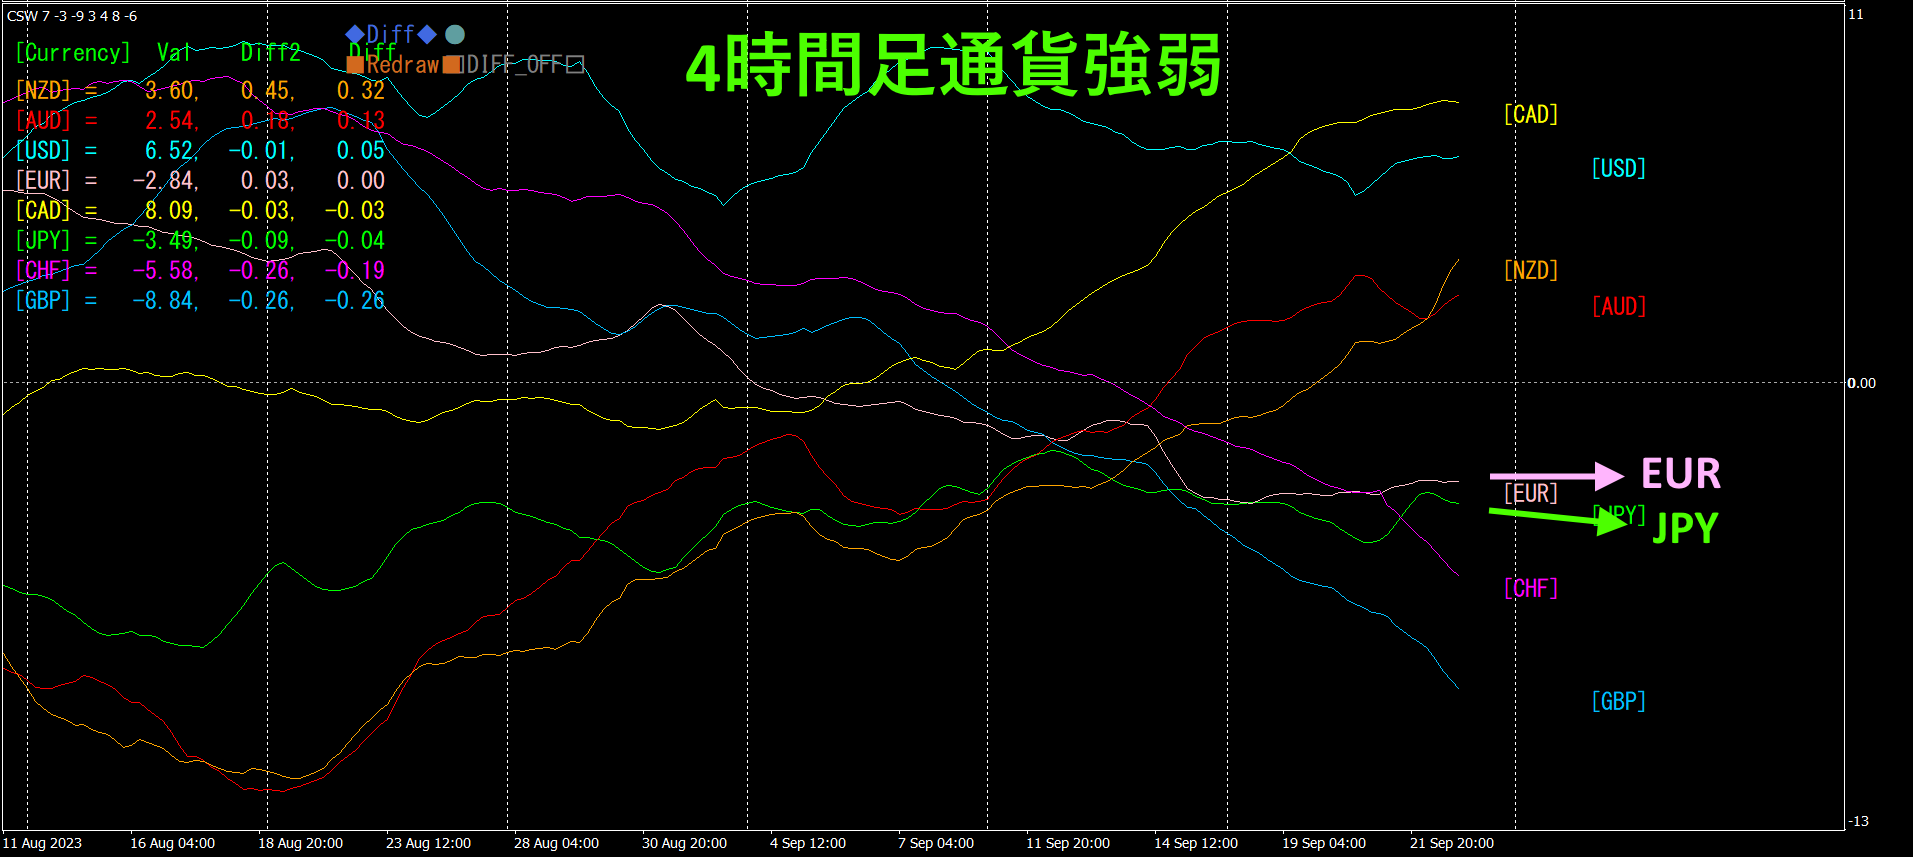
Pink is EUR, green is JPY. is horizontal, is slightly downward. There is little direction, butEUR seems somewhat stronger.
4. Find the bottom across all currency pairs and form a trend strategy (target is USDCHF).
2505“Bottom Search Indicator”, used to identify the next target currency pair as USDCHF.
chart
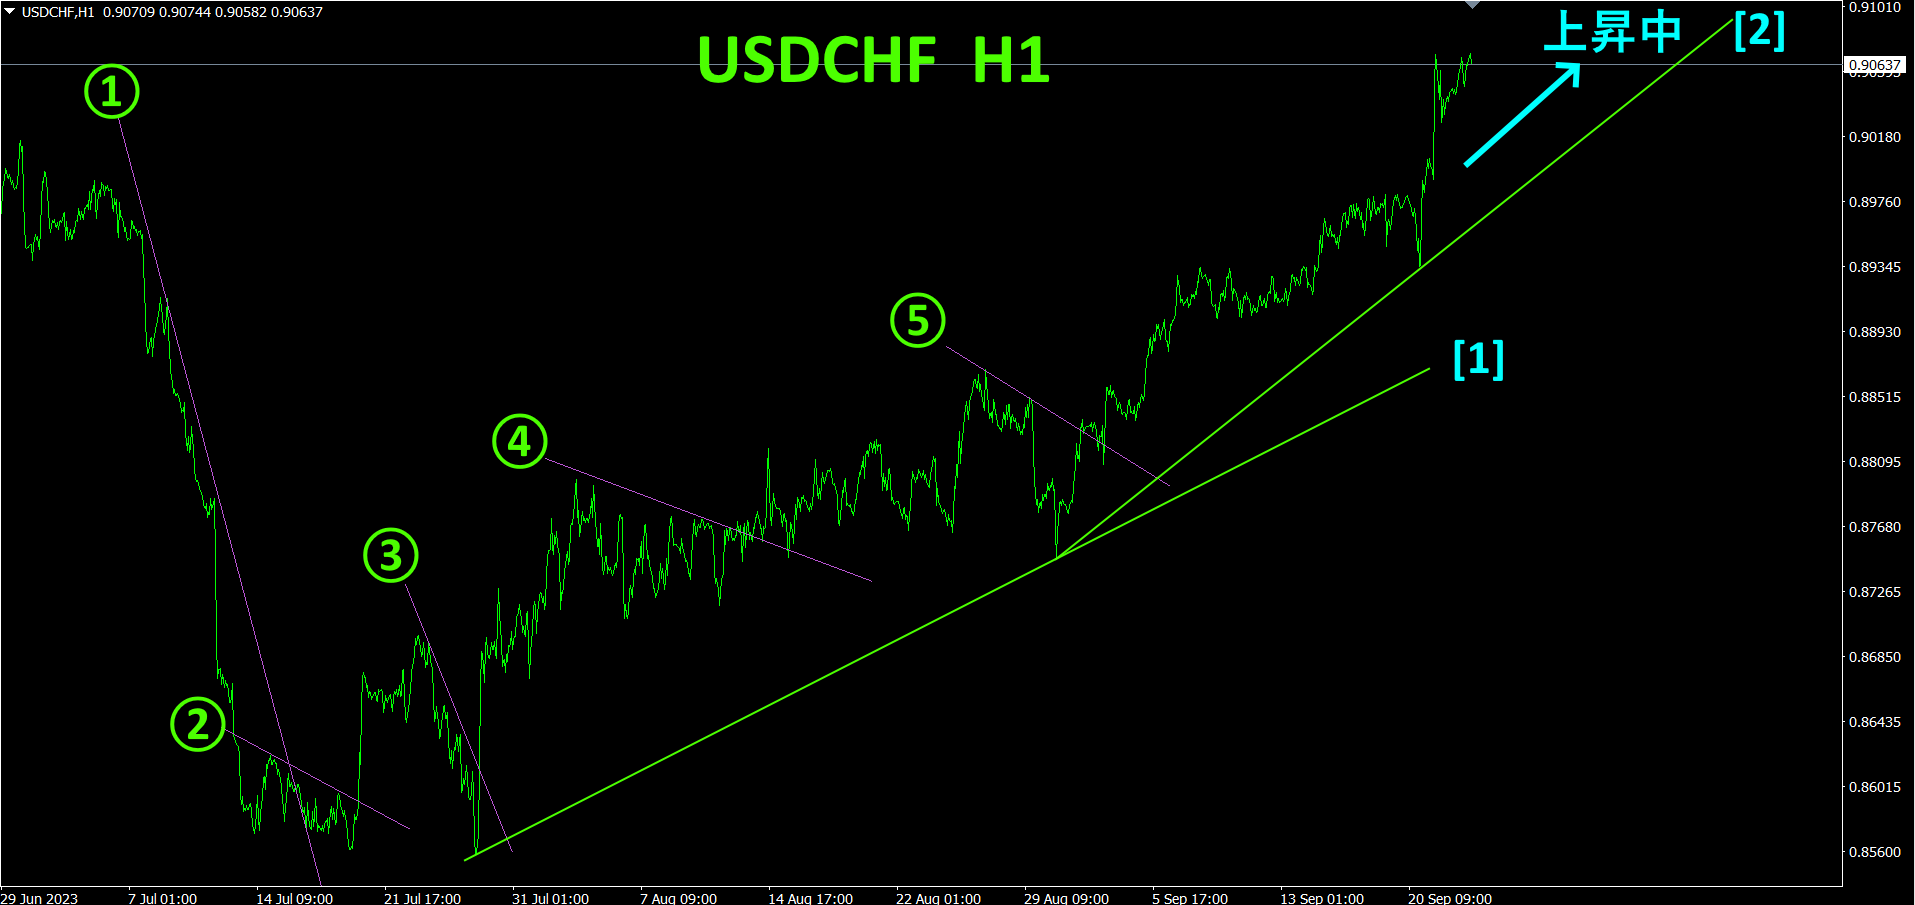
USDCHF is in the phase of “rebound from a bottom.” As shown by ①–⑤, I drew a down-sloping line, and when it breaks above, I entered buys repeatedly. I currently hold a long position. I drew an even steeper rising trend line [2] [2]. I will take profit if this line is broken.
If the rising trend line breaks, exit without hesitation. If you use Trend Line EX, you can have a fully automated, hands-off trade.
If you have “Trend Line EX”, you can draw a diagonal down-sloping line, and when it is broken to the upside, you automatically buy, and when the rising line is broken, you automatically exit, enabling hands-off trading.
※“Trend Line EX”

https://www.gogojungle.co.jp/tools/indicators/42257
“8C Currency Strength Visualization Indicator
MT4 version https://www.gogojungle.co.jp/tools/indicators/39150
MT5 version https://www.gogojungle.co.jp/tools/indicators/39159
【My products for sale】


