

Use of the “Visualization Indicator” (Part 112)
Use of "Visualization Indicator" (その112)
1. Further develop the "28 Currency Pairs List Indicator" into an advanced indicator
“8 CP Visualization Indicator” for drawing EURAUD inEURAUD chart
The “8 CP Visualization Indicator” comes in Oceania version, London version, NewYork version, AnyCP version. This time, the Oceania version was used.
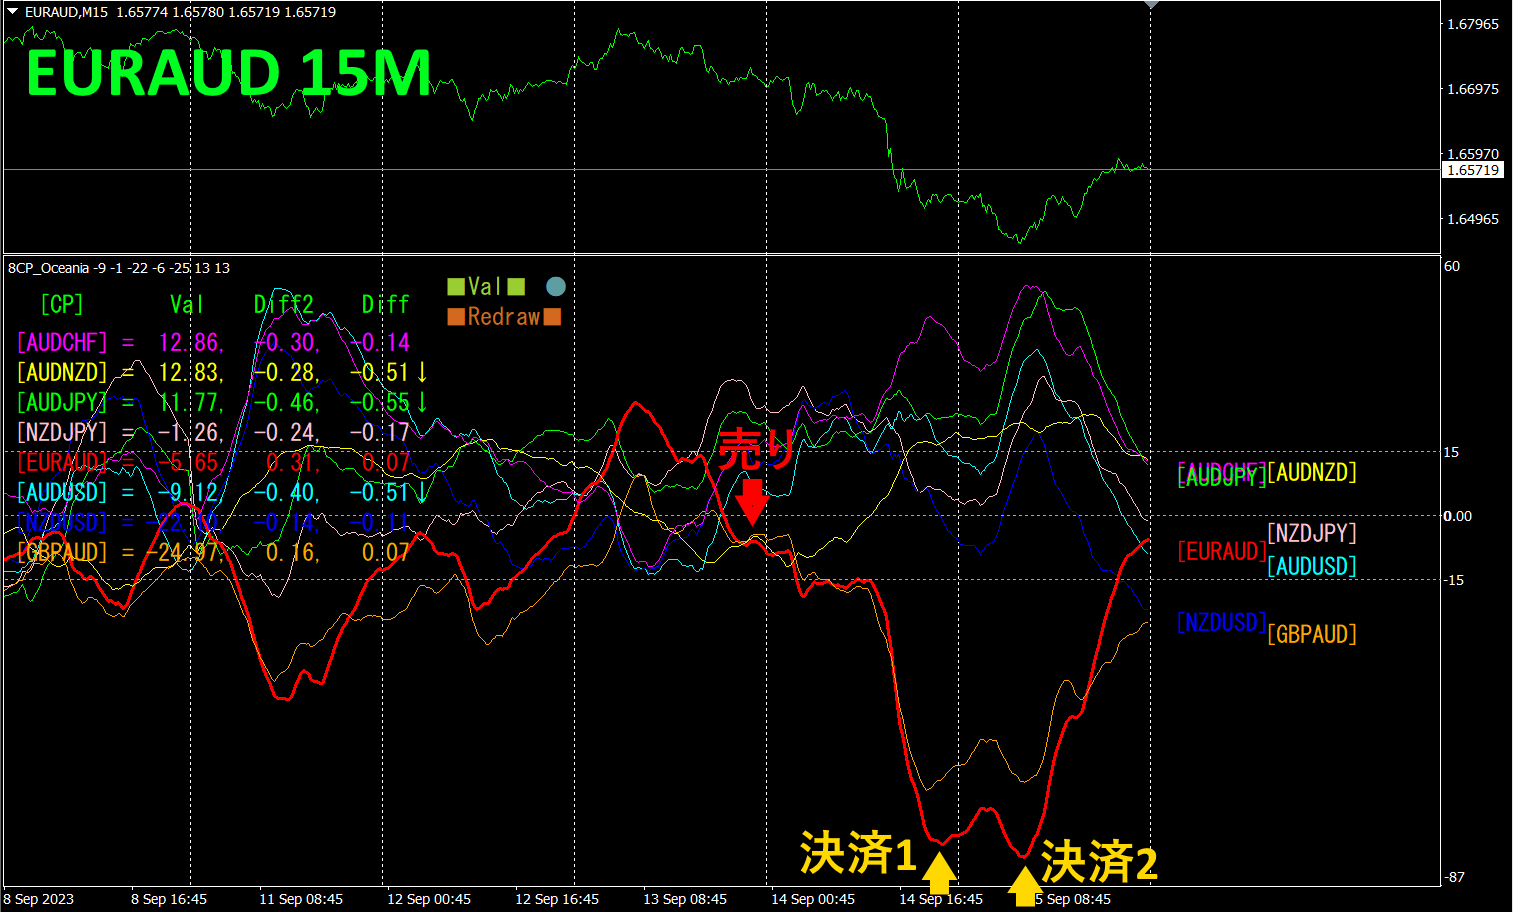
The upper half is the EURAUD 15-minute chart. The lower half is from the “8 CP Visualization Indicator.” The red solid-line graph corresponds to EURAUD.
On Wednesday night, EURAUD fell below other chart groups, so I entered a short. When the chart bottomed and reversed, I closed the position. If closed to the first target, about 200 pips of profit; if closed to the second, about 250 pips of profit were obtained.
2. Best SelectTry the indicator
The image below is a screenshot taken onSeptember,14 2021,2023 at 22:38 (JST).
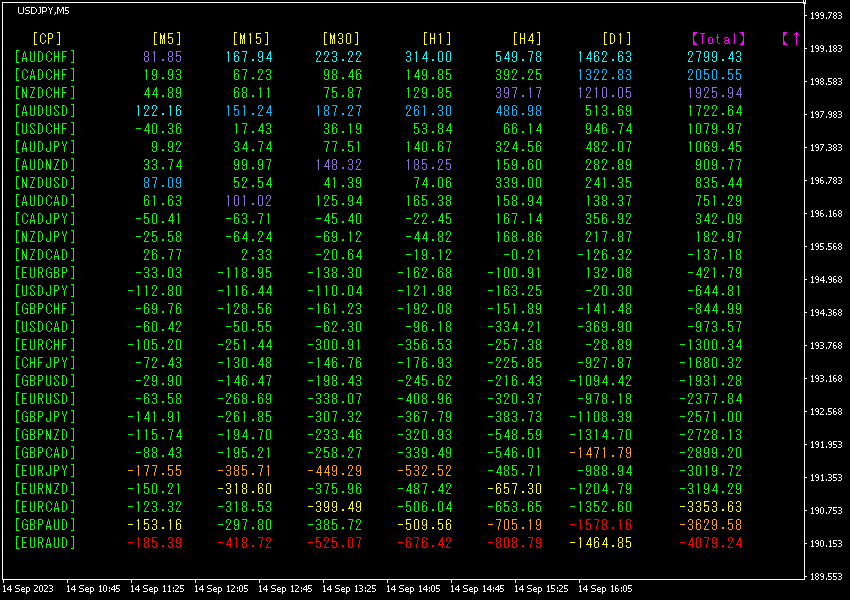
Total numbers are sorted in descending order. The EURAUD at the very bottom is red on all timeframes except the daily chart, and the Total value is-4079.24, a large negative figure. This indicates a strong downward trend in EURAUD.
Now, let’s look at EURAUD’s chart.
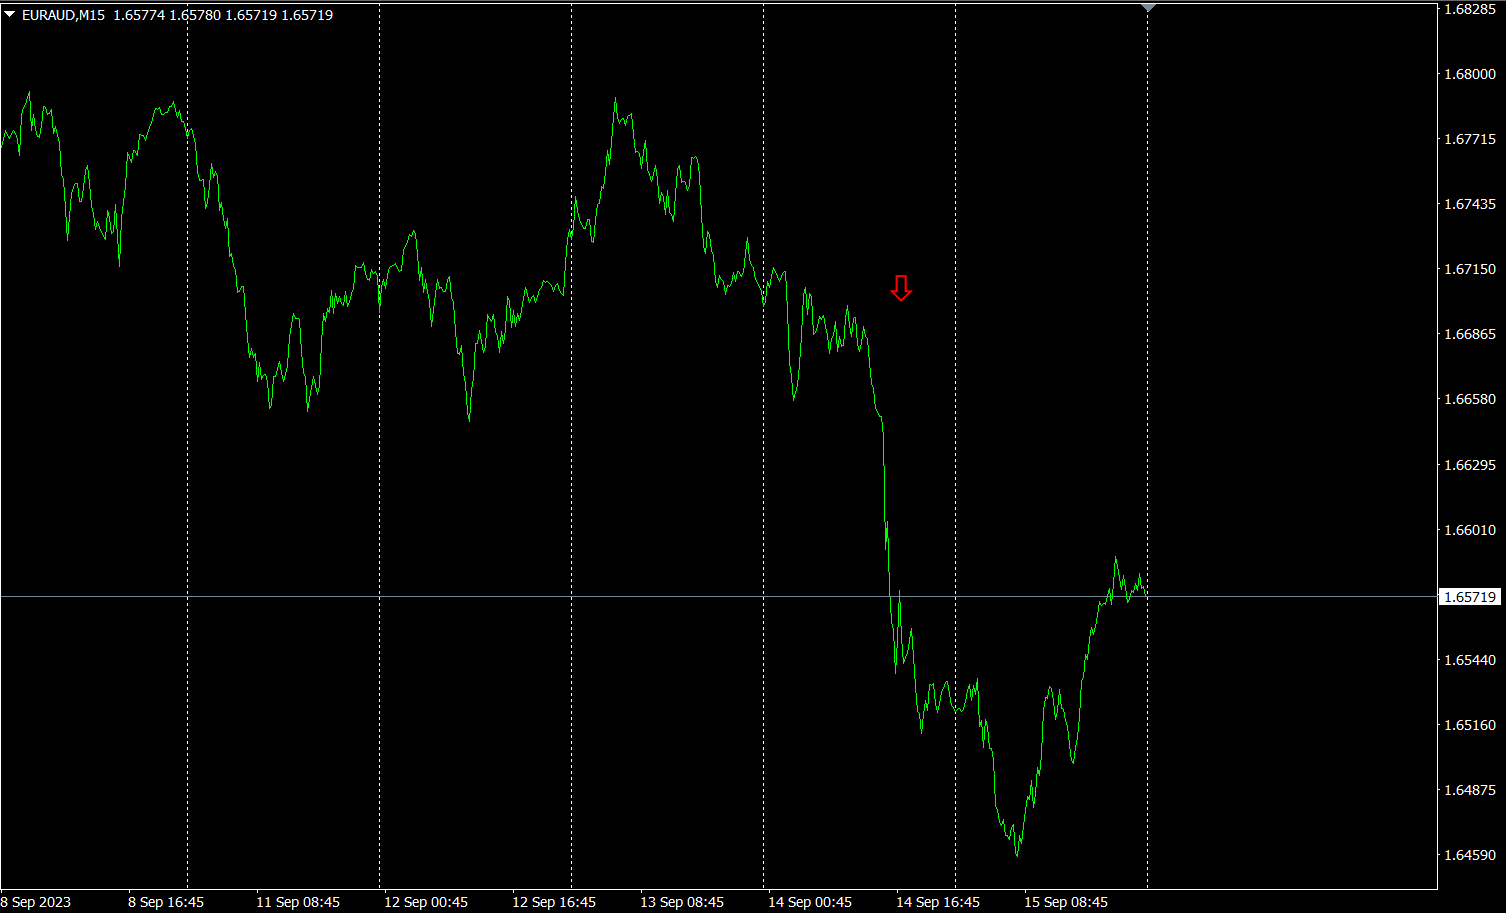
The red arrow marks the point when the screenshot was taken. It captures the sharp drop during a downtrend while the price is heading lower.
“28 Currency Pairs Best Select Indicator makes it easy to identify which currency pair among 28 shows the strongest trend, and tells you whether to trade now with colors and numbers. It allows you to gauge the overall market movement at a glance.
“28 Currency Pairs Best Select Indicator”
https://www.gogojungle.co.jp/tools/indicators/35128

3. What happened to EURJPY, which has been tracked since May of the year before last?
Since May,, EURJPY has been tracked.
To view the overall trend, I’ve drawn about three weeks of 30-minute charts.
Last time, I wrote the following.
tends to move slightly downward, also trends downward slightly. The EUR appears stronger than the JPY, but there is almost no clear direction. For a while, a range-bound movement is expected..
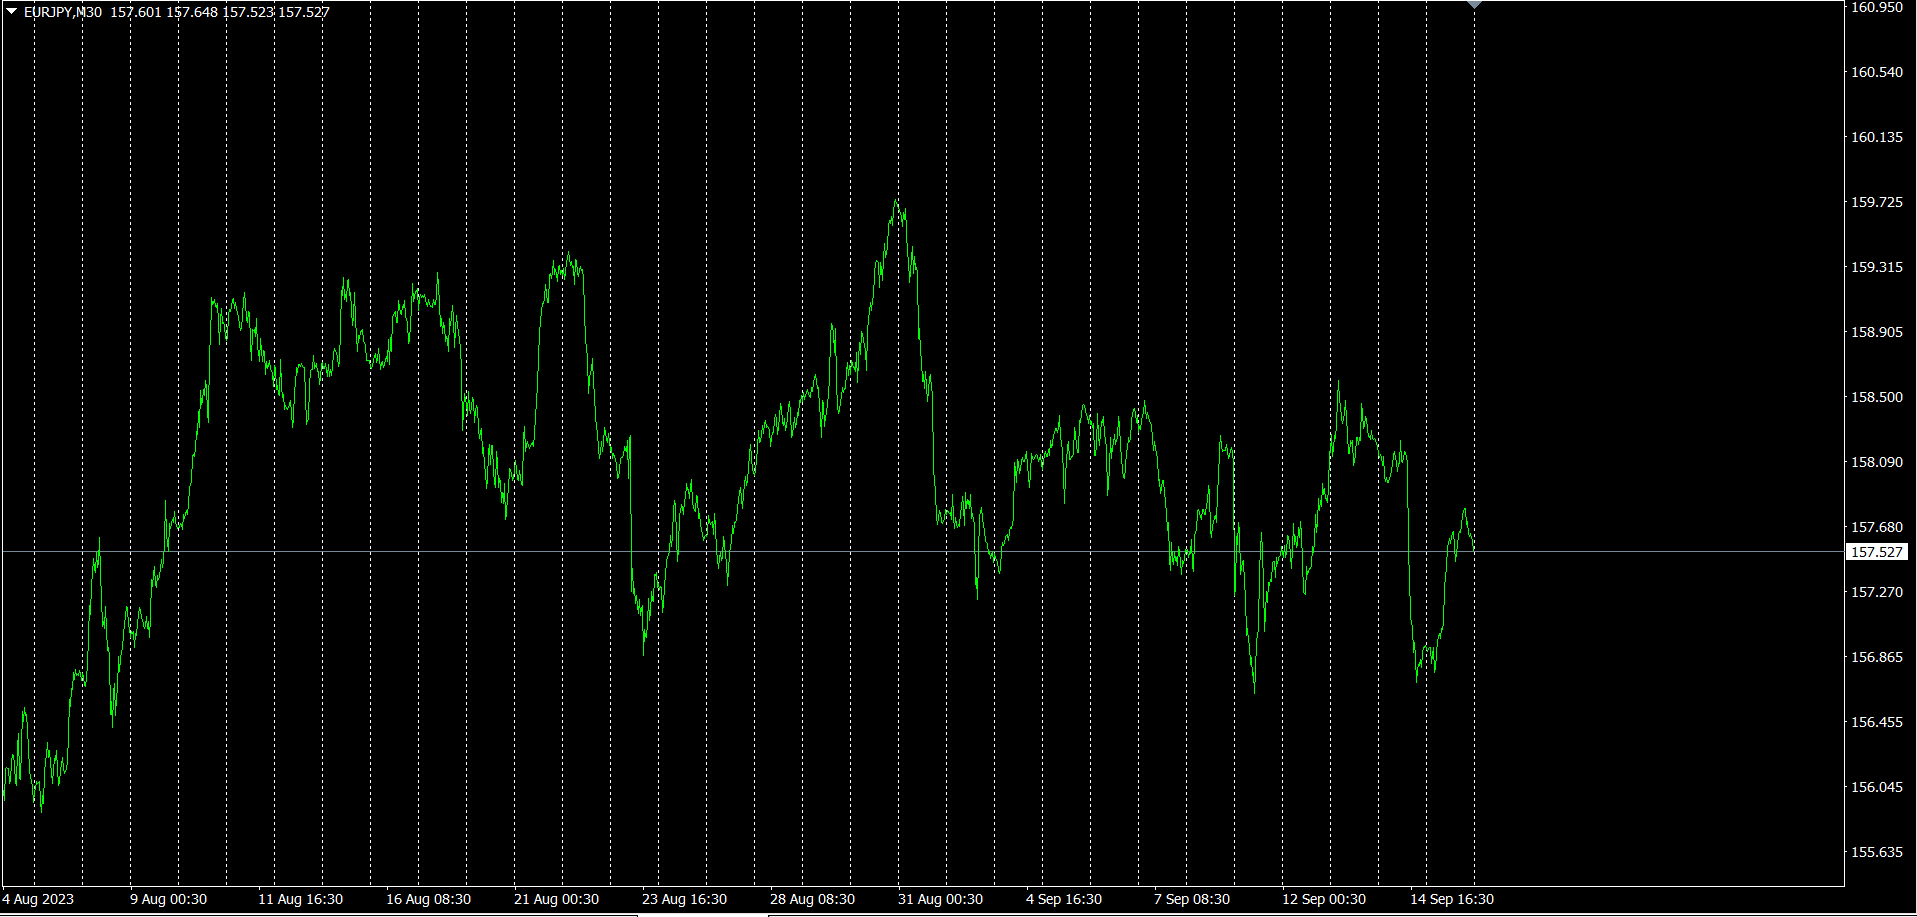
From the week's opening price, it moved down, up, down, up, and the week's closing price ended up roughly at the same level as the opening.
4Timeframe currency strength chart.
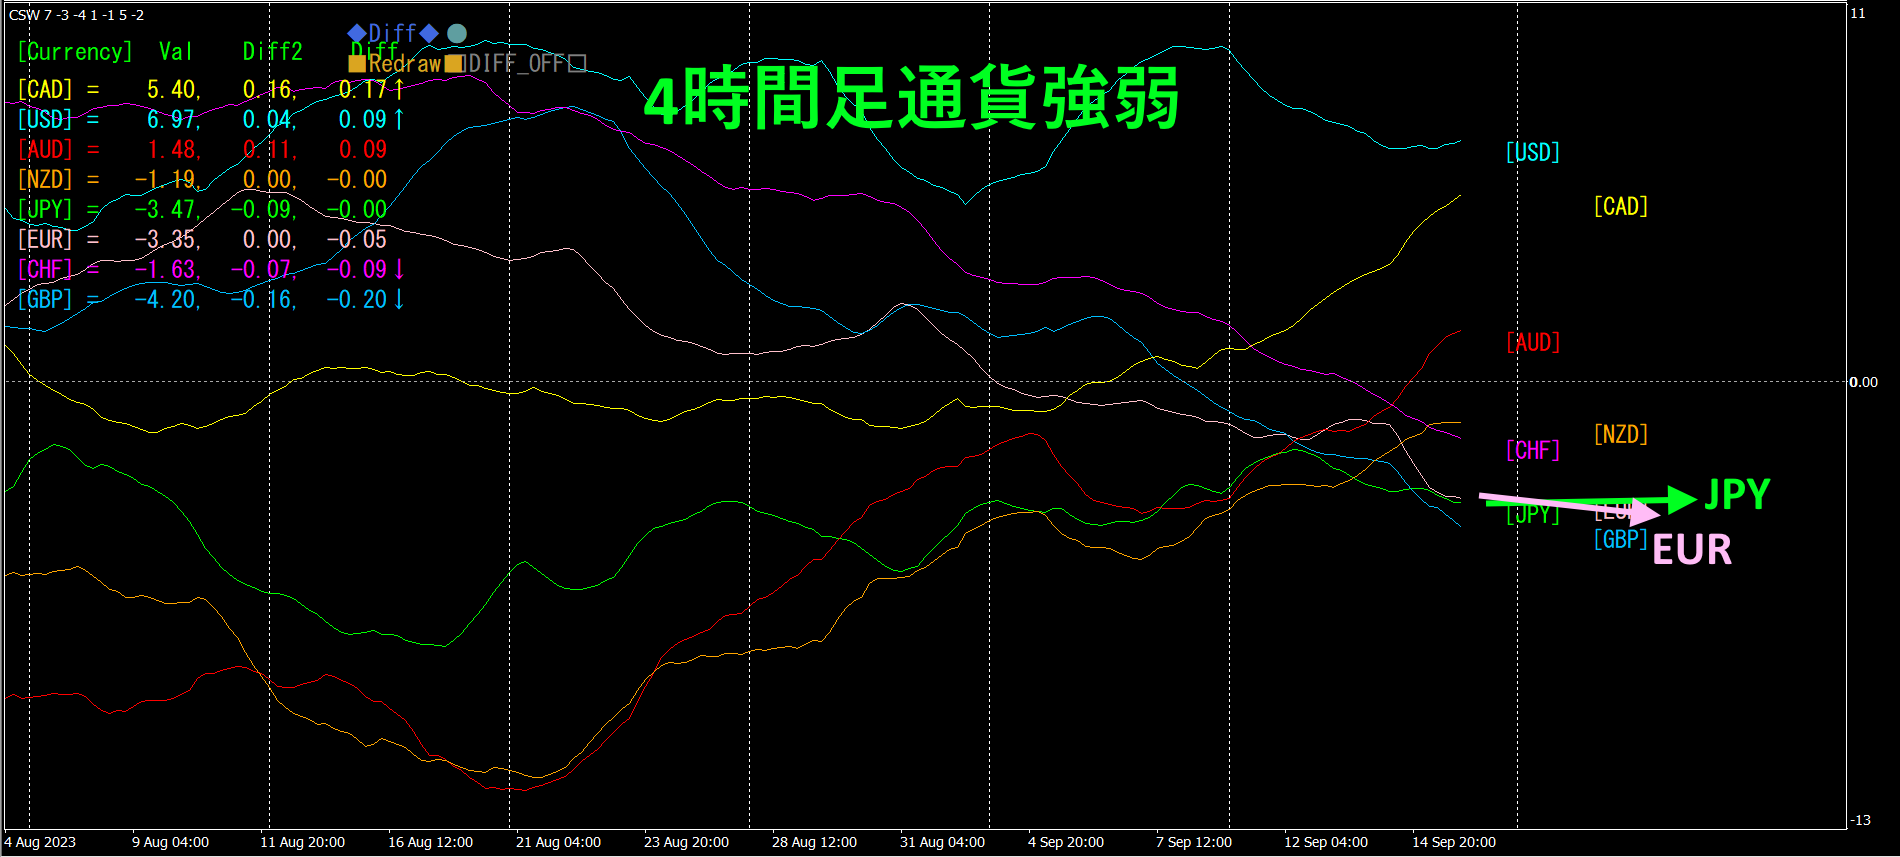
Pink is EUR, green is JPY. is flat. There is little direction, but JPY seems slightly stronger.
4. Find the bottom across all currency pairs and build a trend-following strategy (target: USDCHF)
2505 “Bottom Search Indicator” to extract USDCHF as the next target currency pair.
chart
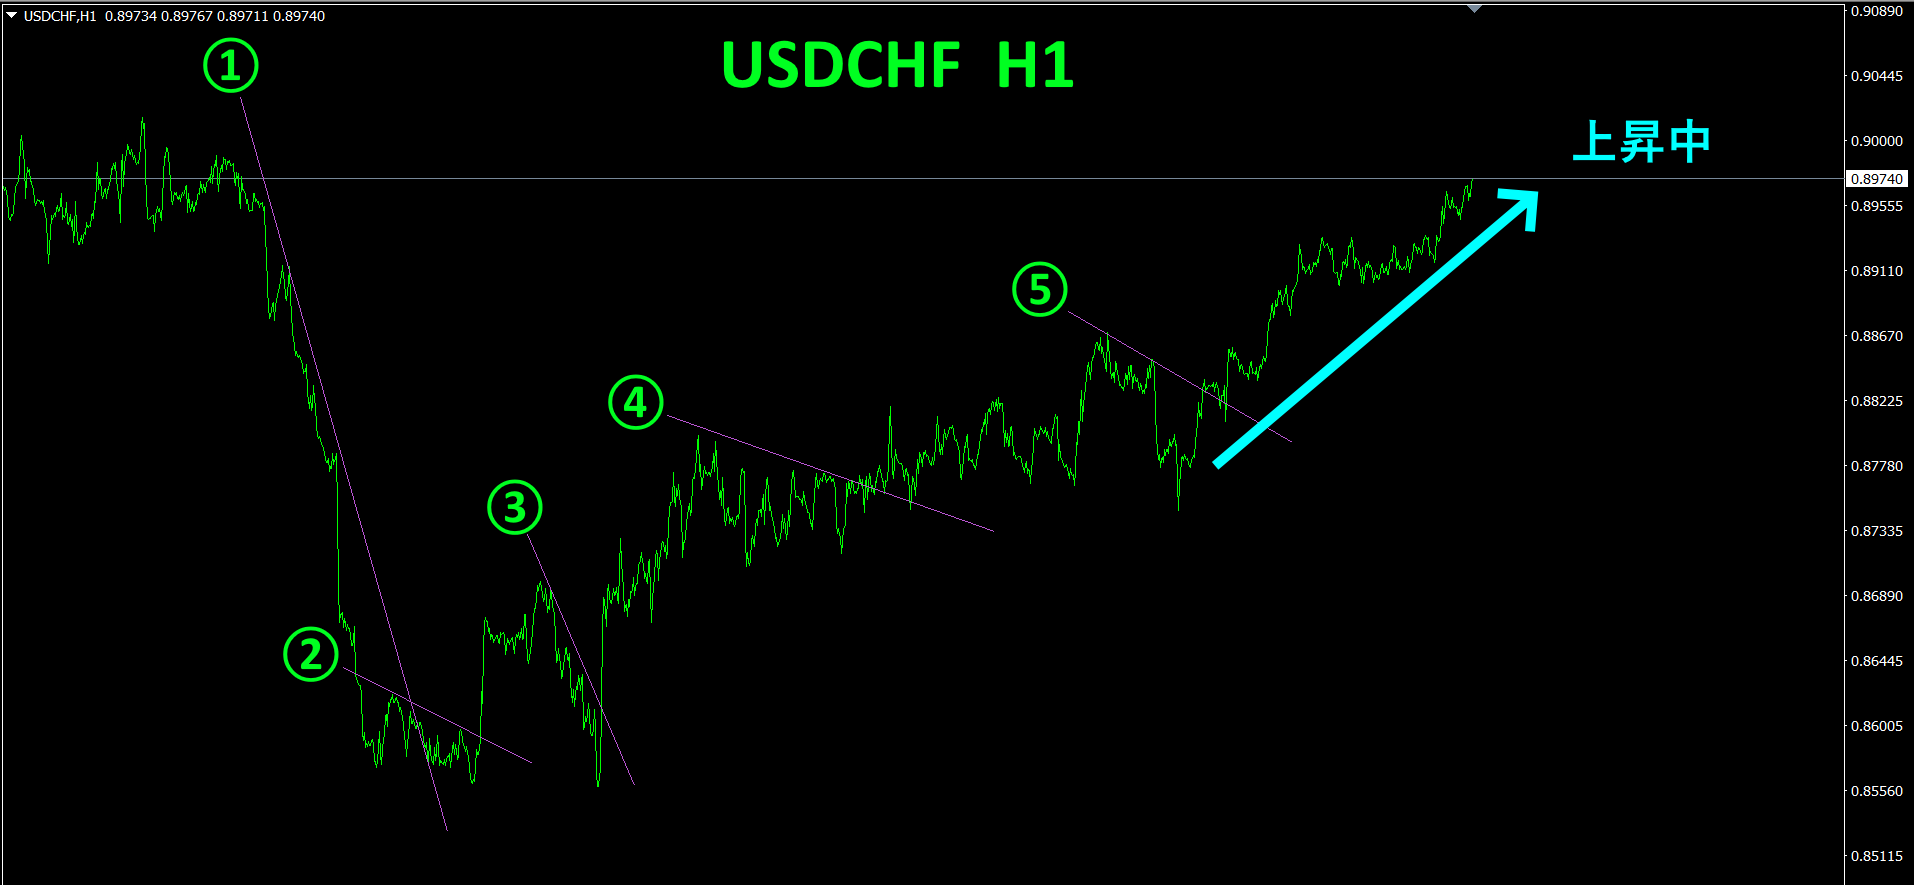
USDCHF is in the "rebound from the bottom" phase. As shown from steps ①–⑤, draw a descending line and enter on a breakout above it, repeatedly buying. Currently, I hold a long position. The rate is rising, but it’s nearing the point where the decline may begin again, so consider taking profit.
If the price breaks below the rising trend line, close the position without hesitation. By using “Trend Line EX,” trades can be fully automated and left unattended.
If you have “Trend Line EX,” you can draw a diagonal downward line and automatically buy on a breakout and automatically exit on a breakdown, enabling hands-off trading.
※“Trend Line EX”

https://www.gogojungle.co.jp/tools/indicators/42257
If you are interested in the “8C Currency Strength Visualization Indicator,” please refer to the following page.
MT4 version https://www.gogojungle.co.jp/tools/indicators/39150
version https://www.gogojungle.co.jp/tools/indicators/39159
【My Items for Sale】


