

【September 5, 2023】Past verification using the sky-and-ground indicator (EURJPY)
When judging direction on the 4-hour chart, the 15-minute chart should show a trend in that direction. We explain how to set the sign for heaven and earth points at that time. This is an applied technique, so don’t miss it.

・This article mainly uses “Heaven and Earth Indicator” for chart analysis and backtesting.
・The system is built around the use of the“15-minute + 4-hour simultaneous monitoring method”as its premise.
・This tool is a groundbreaking trading tool that can be used without understanding any of the widely known FX theories (Elliott Wave, Dow Theory, Grail of Granville, cycle theory, price action, Fibonacci, support/resistance, channels, etc.).

Heaven and Earth Indicator is an original indicator trading method developed by me, Abusan, released in February 2022.
Thanks to everyone's support,「GogoJungle Award 2022 winner
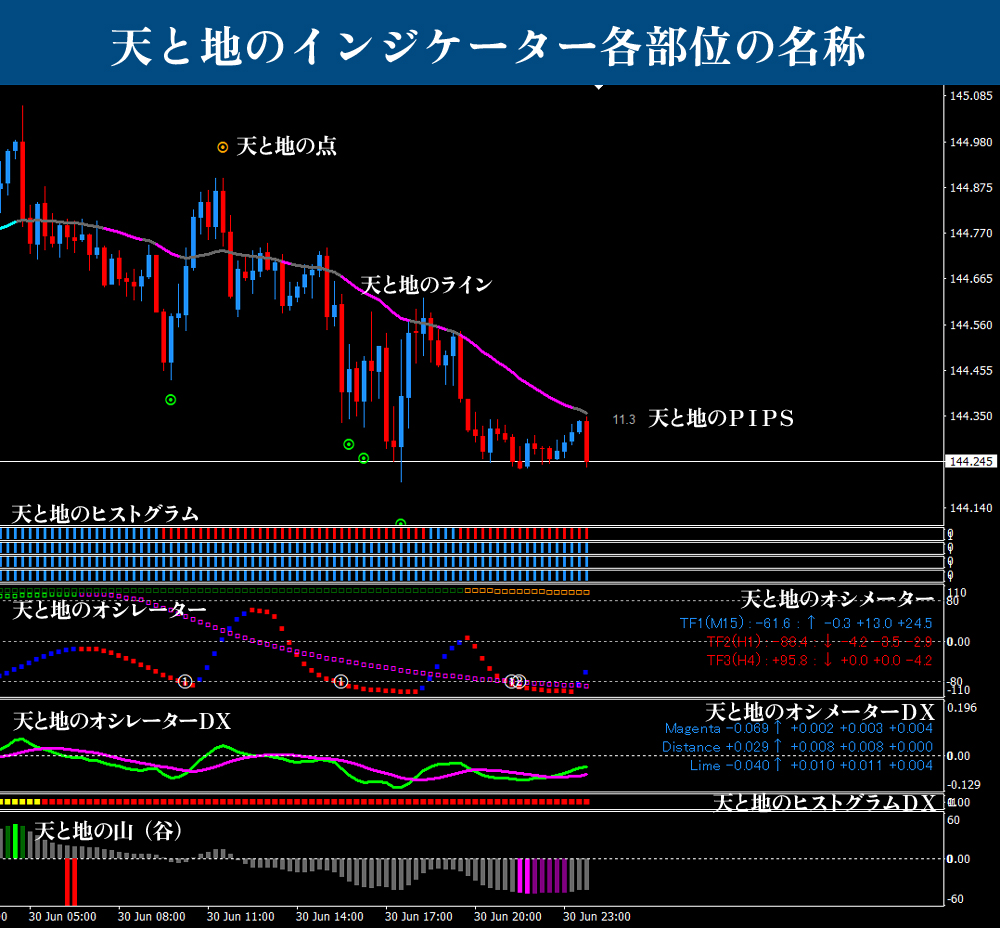
■ Heaven and Earth Indicator
https://www.gogojungle.co.jp/tools/indicators/35780
■ Heaven and Earth Mountains
https://www.gogojungle.co.jp/tools/indicators/37744
■ Heaven and Earth EA ~ Semi-discretionary Auto Trading System ~
https://www.gogojungle.co.jp/tools/indicators/43213
■ Heaven and Earth Dashboard
https://www.gogojungle.co.jp/tools/indicators/46257
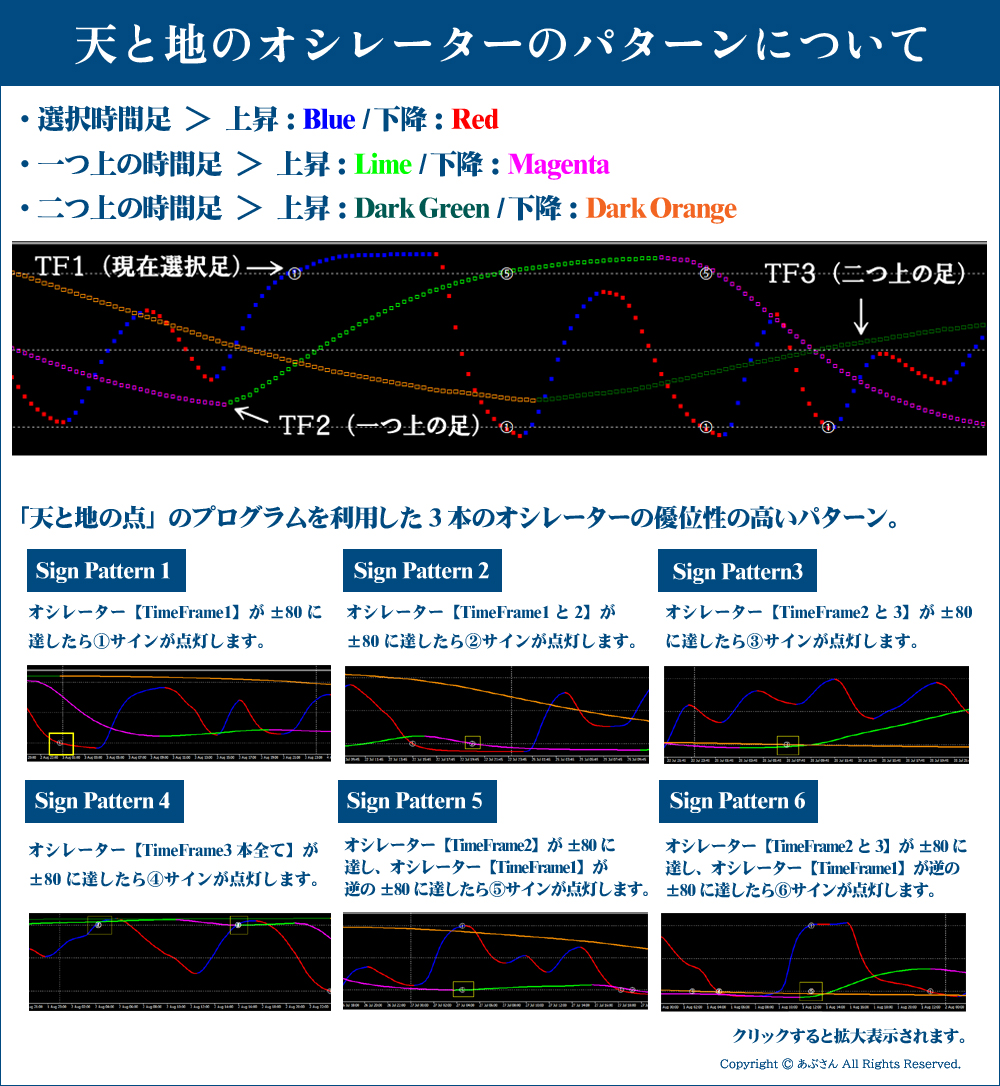
※Please refer to the terms used in this blog in the following sections: “Names of parts of the Heaven and Earth Indicator” and “Heaven and Earth Oscillator patterns.” If you have any other questions, please refer to the Heaven and Earth Indicator sales page. If you are already a user, reading the user manual should suffice. Please refer to the above for the terminology. If you have any other questions, you can understand most things by referring to the Heaven and Earth Indicator sales page. For existing users, the manual is enough.
Now, I will proceed to the verification.
Thank you in advance!
※ All images enlarge when clicked.

EURJPY 15-minute + 4-hour Backtesting (from September 1, 2023 to present)
※ Please note the yellow vertical line. There is also a yellow vertical line in the 15-minute chart at the same location. (Using LINK LINE)
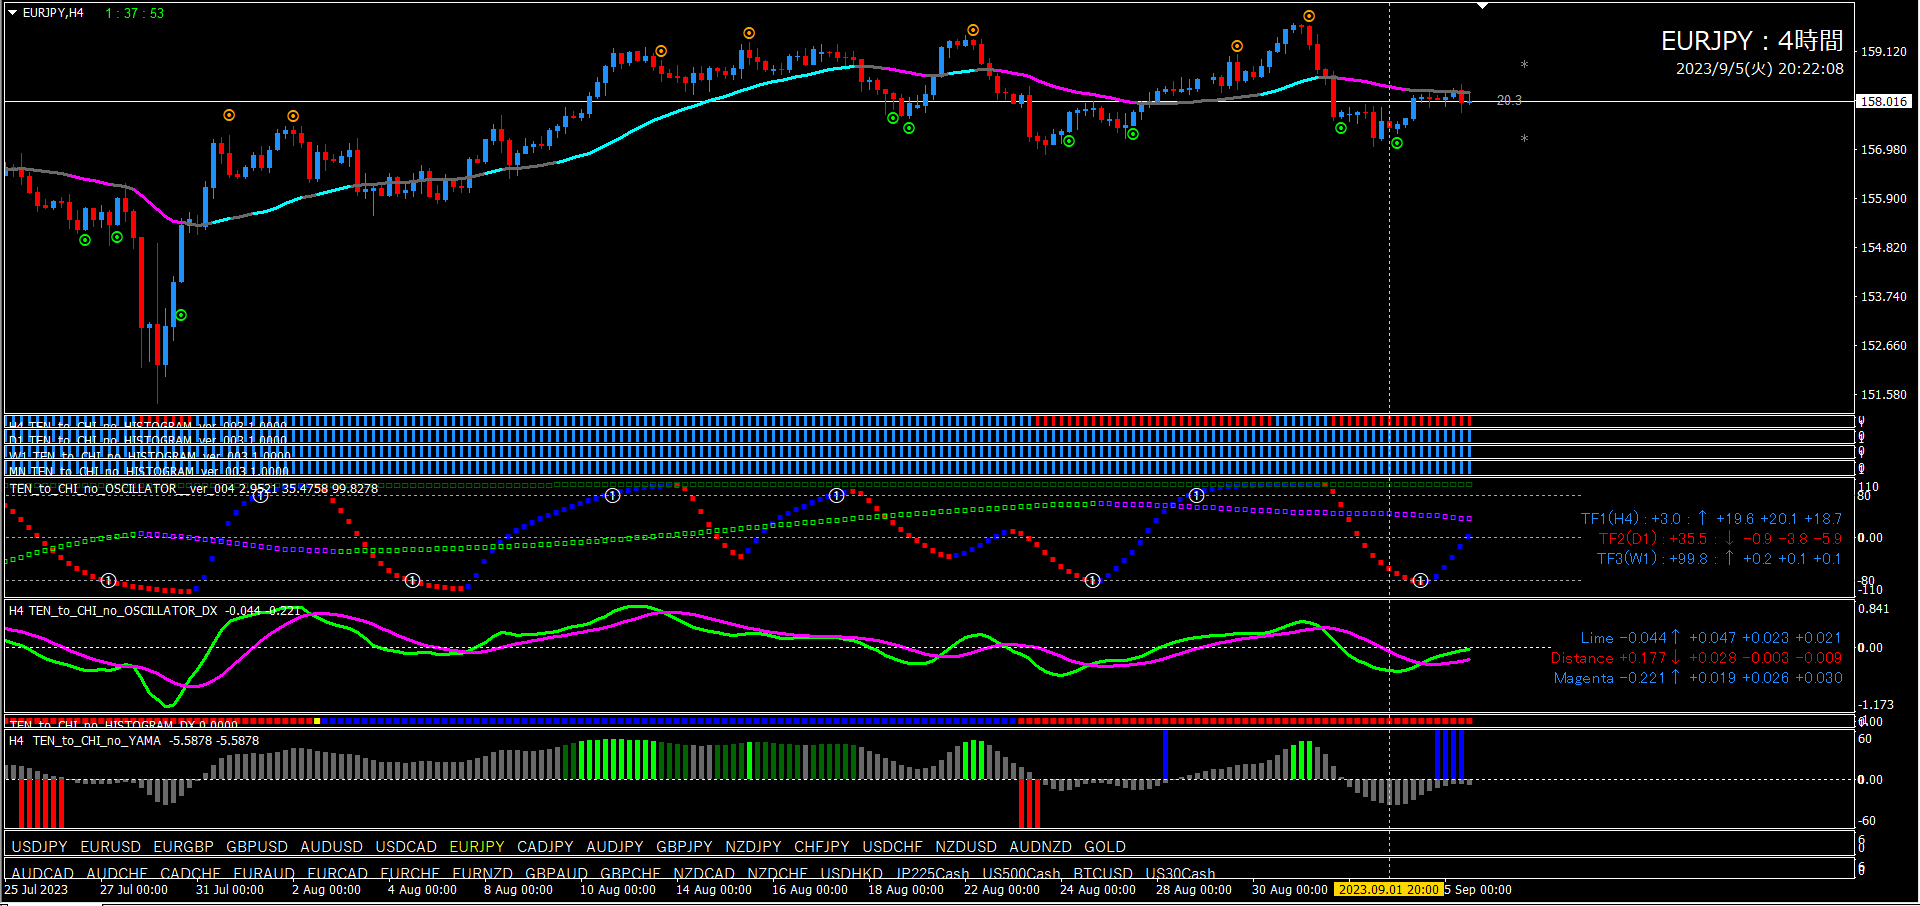
■ 4-Hour Chart (Environmental Recognition)
The yellow vertical line corresponds to the area where I wrote the previous week’s article. The top of the image is the article content. The bottom is the current chart.
As per the scenario, since the long point signal lit up, I determine a bullish view at this point. The Oscillator DX was also contracting toward an upward cross.


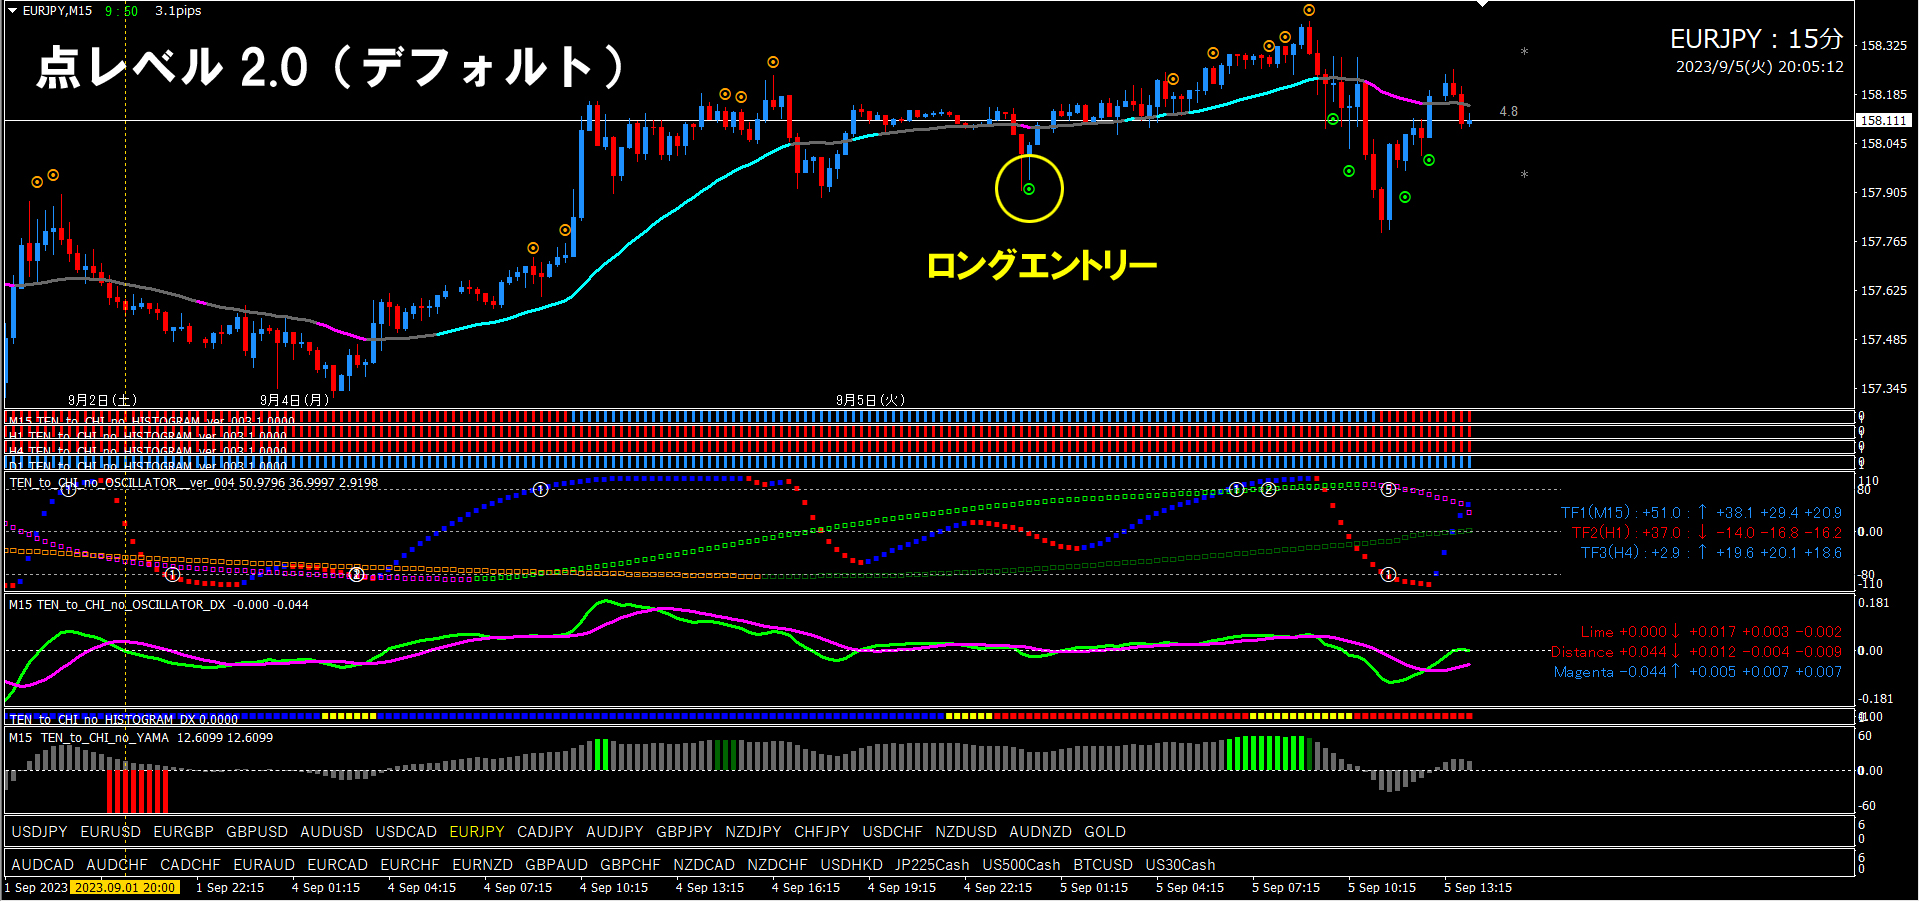
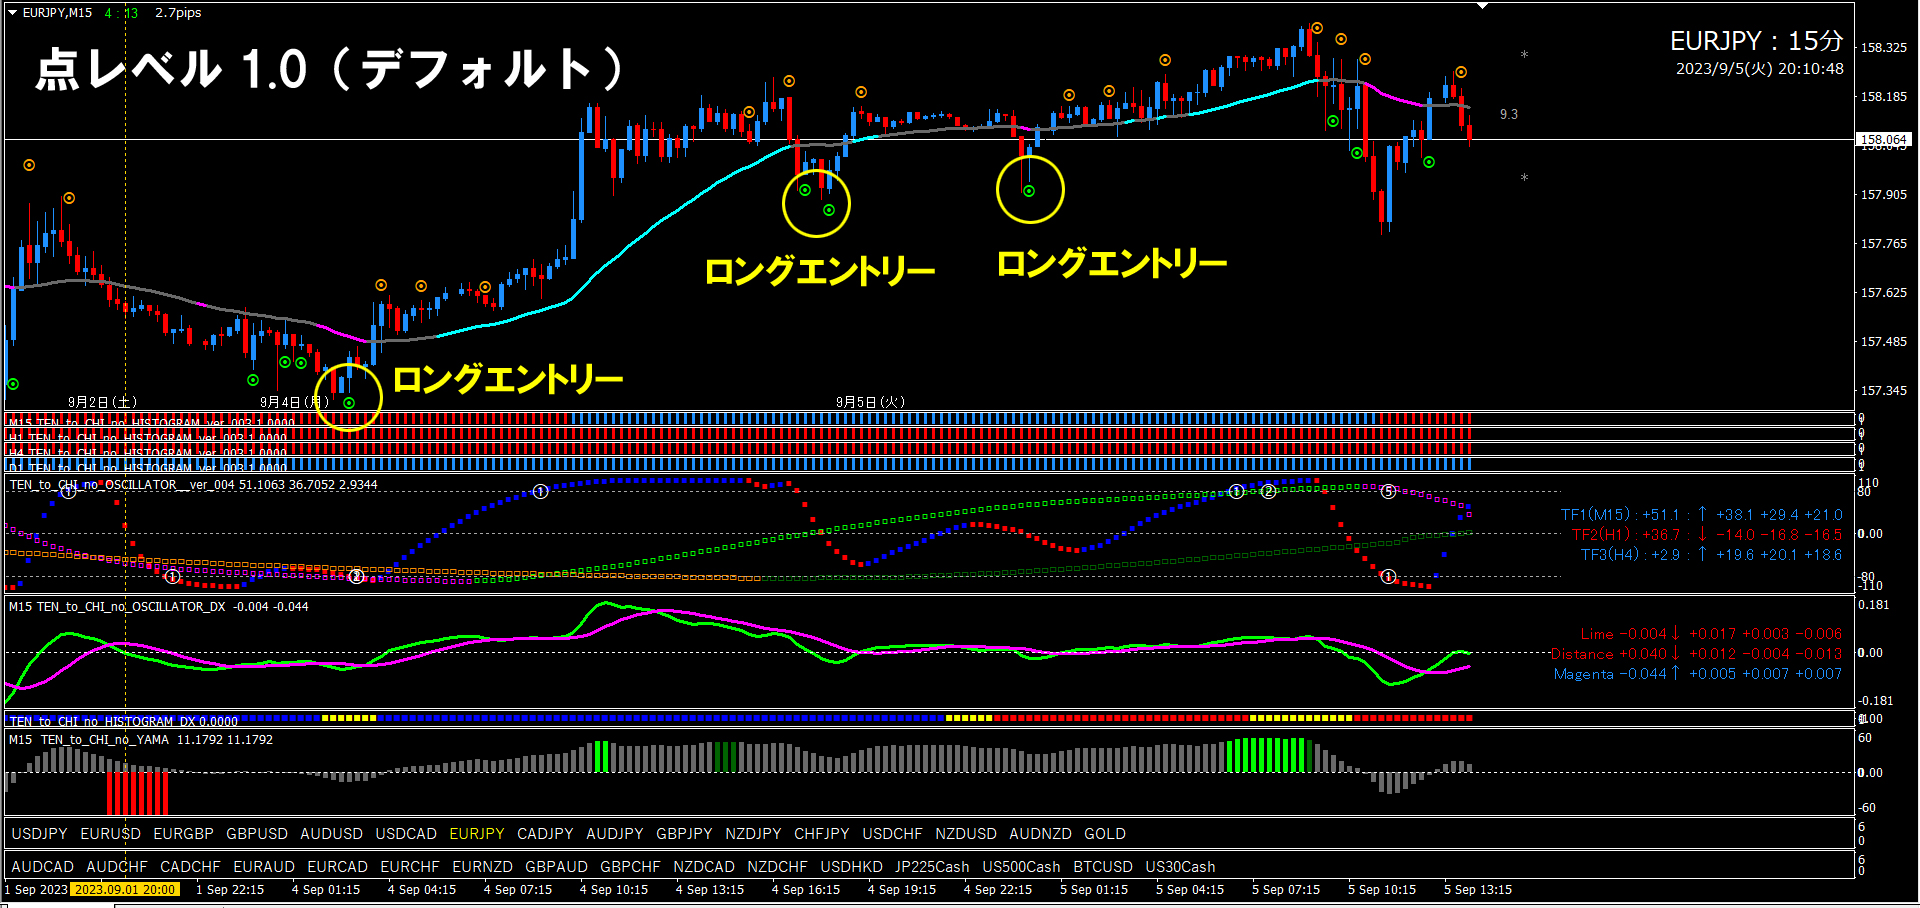
■ 15-Minute Chart (Entry Trigger)
The yellow vertical line area is where I wrote last week’s article.
Once the 4-hour analysis indicates a bullish view, we target only long entries.
Oscillator TF2 is showing strong upside momentum. Under that condition, the long point signal lights up. This is an excellent long entry point.
This time, I will introduce one applied technique.
When the 4-hour chart indicates an upward direction, the 15-minute chart should also show a trend in that direction. Heaven and Earth point signals are fundamentally contrarian signals, so there aren’t many signals in the trend direction. However, in that case, by setting the parameter [LEVEL] of the Heaven and Earth point signals from the default 2.0 to 1.0, the signal filter becomes weaker. As a result, more signals will light up.
The second image is a chart with Heaven and Earth point LEVEL set to 1.0. The signals appear in a very good position.
Note, this method is only possible when using the 15-minute + 4-hour simultaneous monitoring method and when the trend direction can be clearly identified. Please try it.
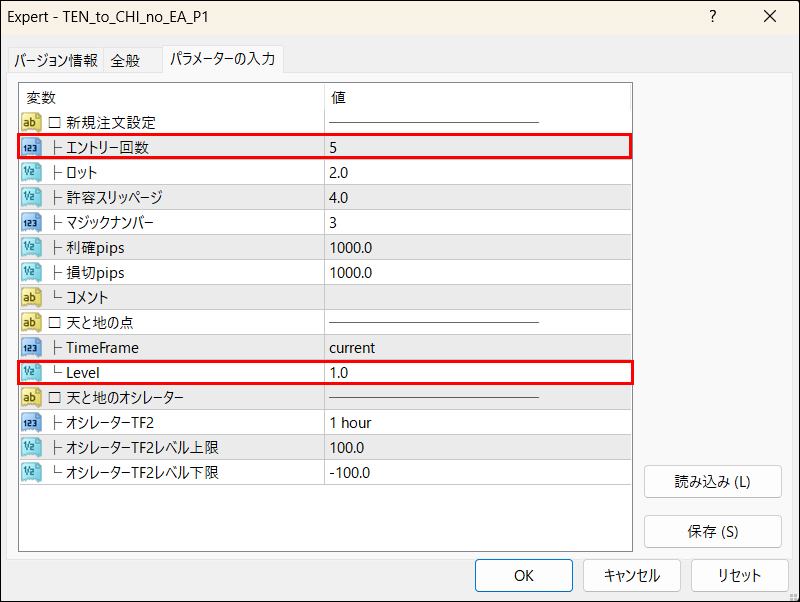
■ If using Heaven and Earth EA (for the 15-minute chart)
Set the EA pattern ① while Oscillator TF2 is rising. Set the parameter LEVEL to 1.0 and the number of entries to about 5; TF2 will continue to trade long with the long point signal until it turns. This is highly effective. Parameters are as follows:
■ 15-Minute Chart (Abusan Signal)
So far, there haven’t been many good signals. Looking forward to what comes next.

That is all.
We hope this is of some help to everyone.
