

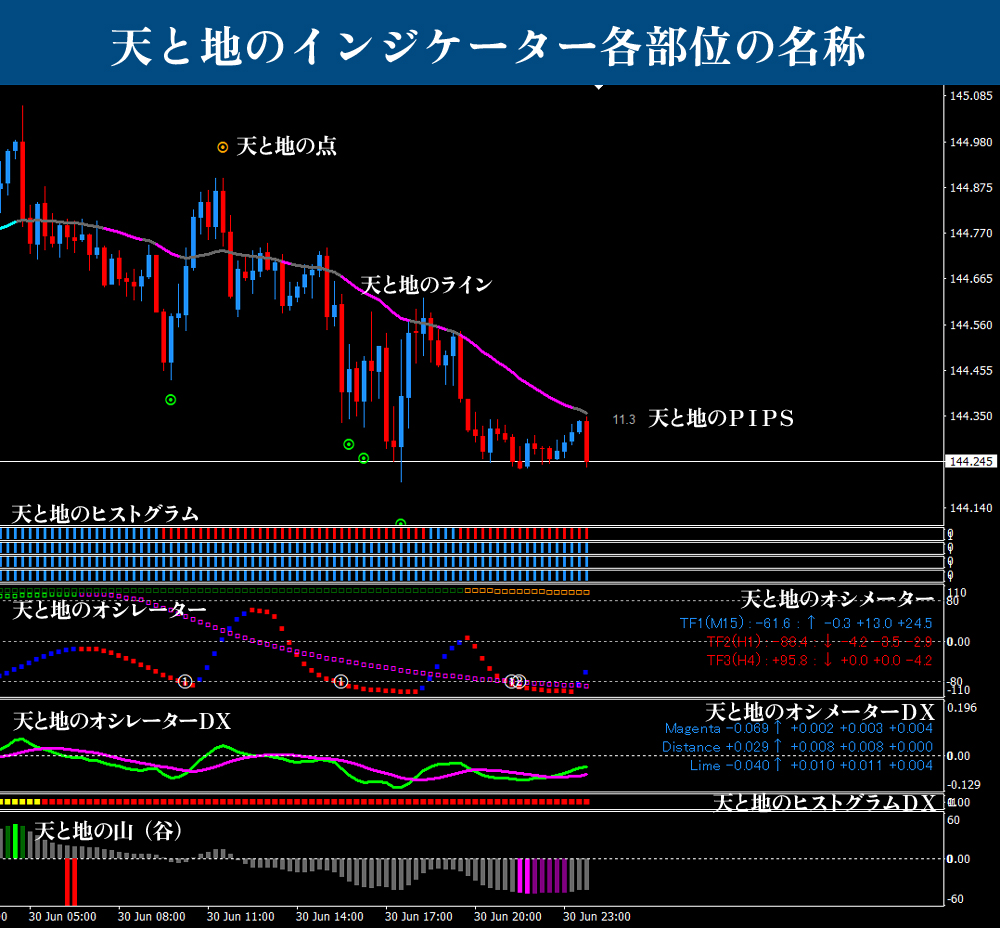
[September 2, 2023] Chart analysis using the sky and earth indicators
This is a chart analysis of five currency pairs: EURJPY, EURGBP, AUDJPY, NZDJPY, and AUDNZD.
We have selected currency pairs that were not greatly affected by yesterday's employment statistics.

Table of Contents

・This article mainly consists of chart analysis and backtesting using the “Ten to Chi Indicator”“Ten to Chi Indicator”
・The structure is based on using the most accurate tool among this suite: “15-minute and 4-hour simultaneous monitoring method.”“15-minute and 4-hour simultaneous monitoring method.”This forms the core of the content.
・This tool is a revolutionary trading tool that can be used without any understanding of traditional FX theories (Elliott Wave, Dow Theory, Gartley/Marubozu, cycle theory, price action, Fibonacci, support/resistance, channels, etc.).

Ten to Chi Indicator is an original indicator developed by me, Abusan, released in February 2022, and used in this trading method.
Thanks to everyone's support, we received「GogoJungle Award 2022.
■ Ten to Chi Indicator
https://www.gogojungle.co.jp/tools/indicators/35780
■ Ten to Chi Mountain
https://www.gogojungle.co.jp/tools/indicators/37744
■ Ten to Chi EA ~ Semi-discretionary automatic trading system ~
https://www.gogojungle.co.jp/tools/indicators/43213
■ Ten to Chi Dashboard
https://www.gogojungle.co.jp/tools/indicators/46257
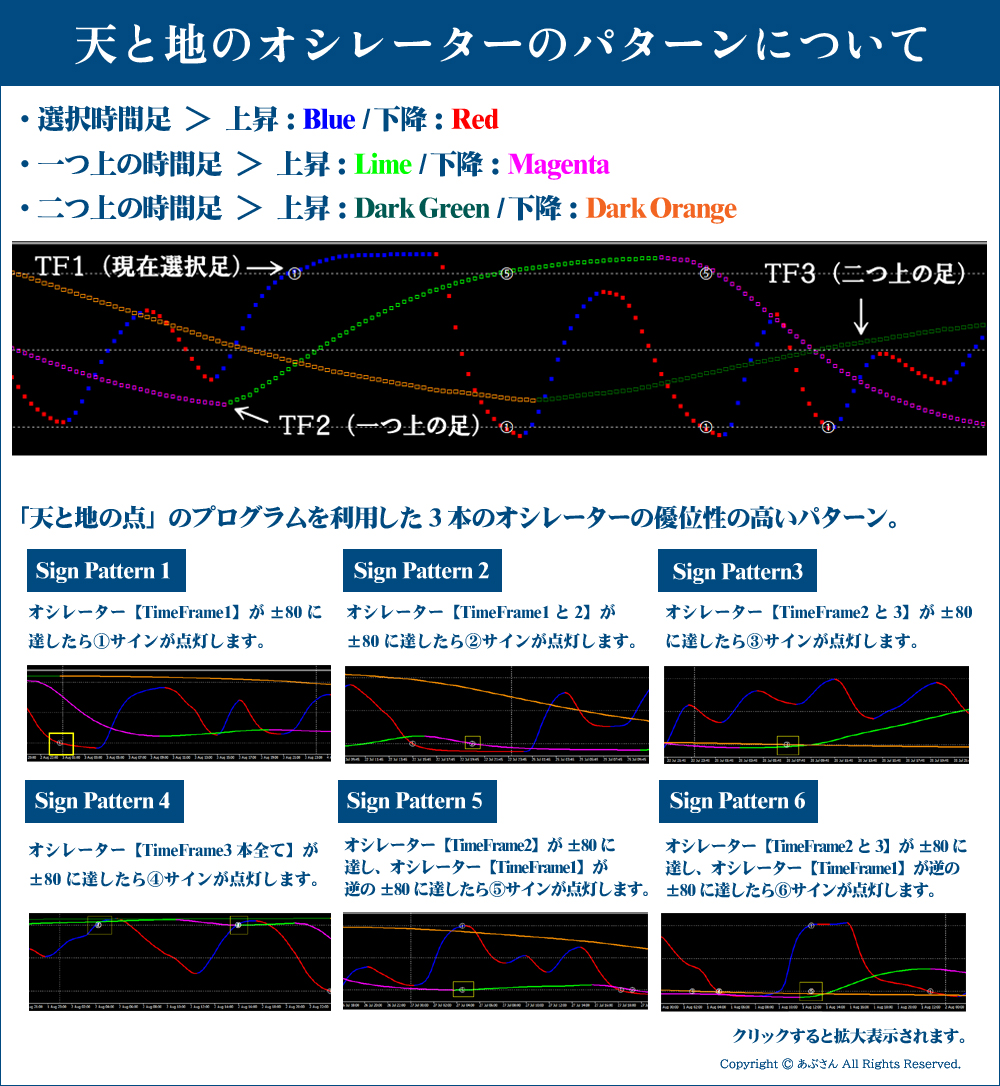
※For the terminology used in this blog, please refer to the following: “Names of the parts of the Ten to Chi Indicator” and “Patterns of the Ten to Chi Oscillators.” If you have any other questions, please refer to the Ten to Chi Indicator sales page. If you are already a user, reading the user manual should suffice.Please refer to the above. If you have any other questions, you can usually understand by the Ten to Chi Indicator sales page. If you are already a user, reading the manual is enough..
Now, let's move on to the analysis.
Thank you!
※Click to enlarge all images.

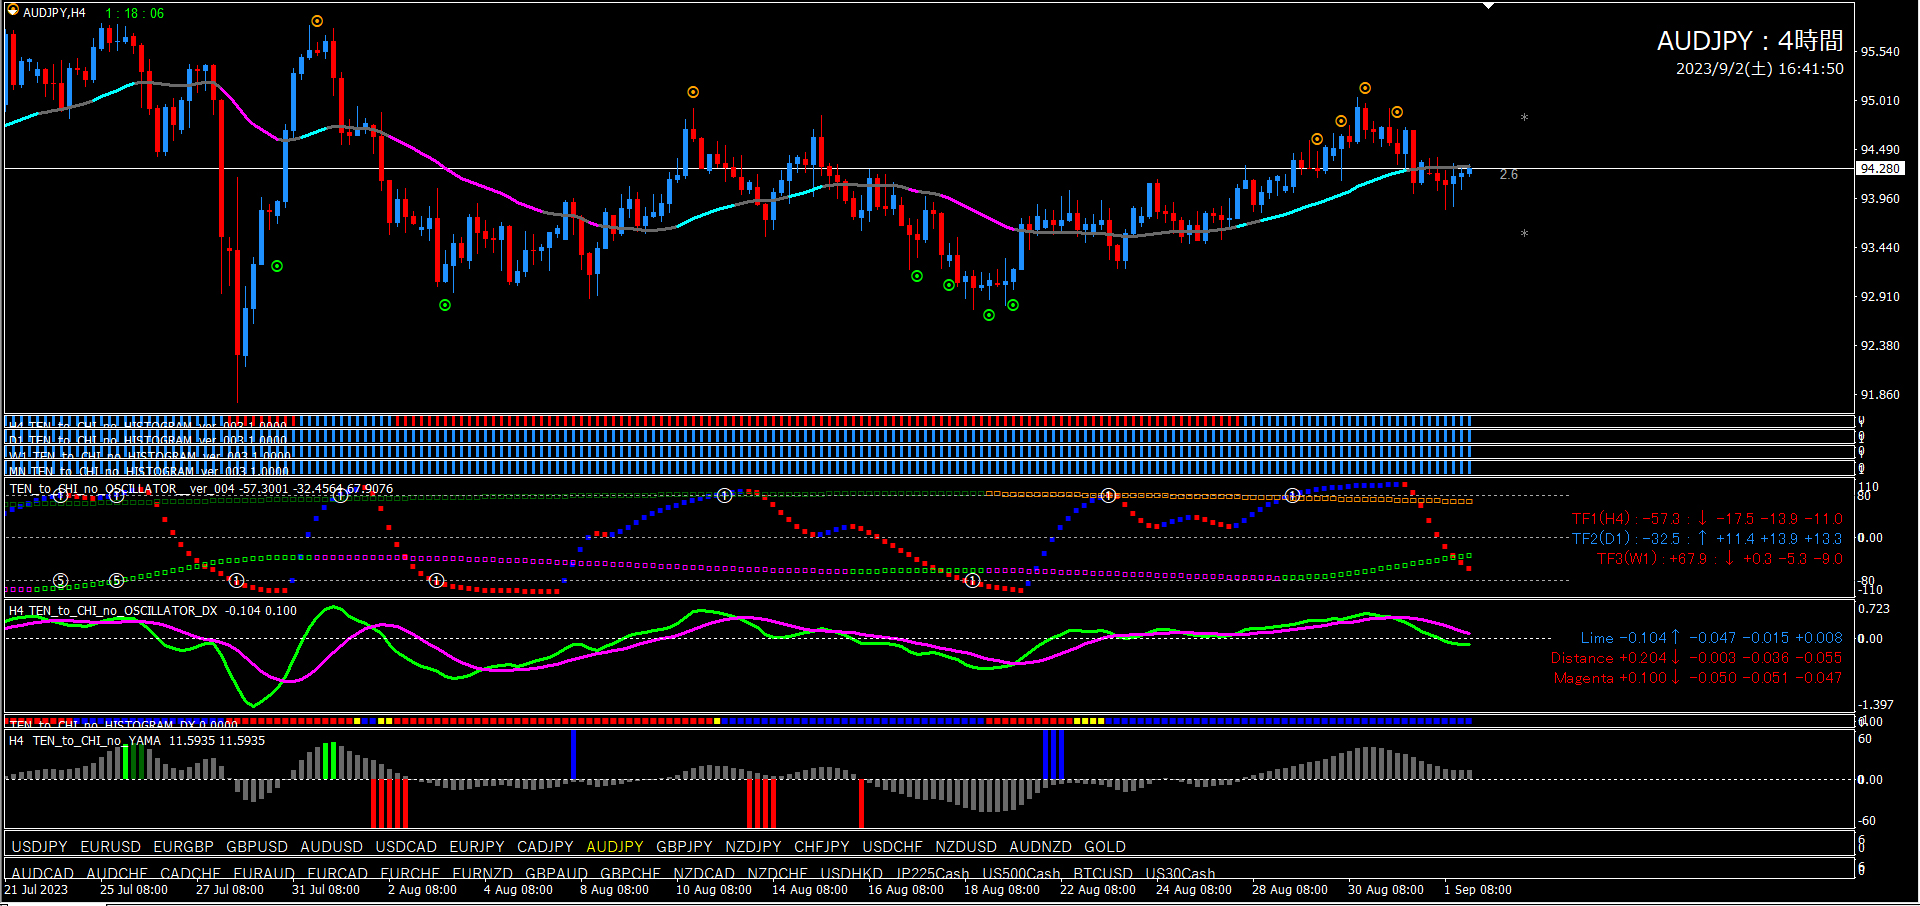
■ 4-hour chart (environment recognition)
Oscillator TF2 is rising, and TF1 is also in a good position.Oscillator DX shows Lime rising and Distance falling. This indicates a bullish signs.There are bullish pullbacks as well. At this stage, I consider the overall bias to be higher, but it would be more reliable to wait for a rising crossover of Oscillator DX before taking a long view.However, if the Distance of Oscillator DX rises, I will reset the bullish bias.
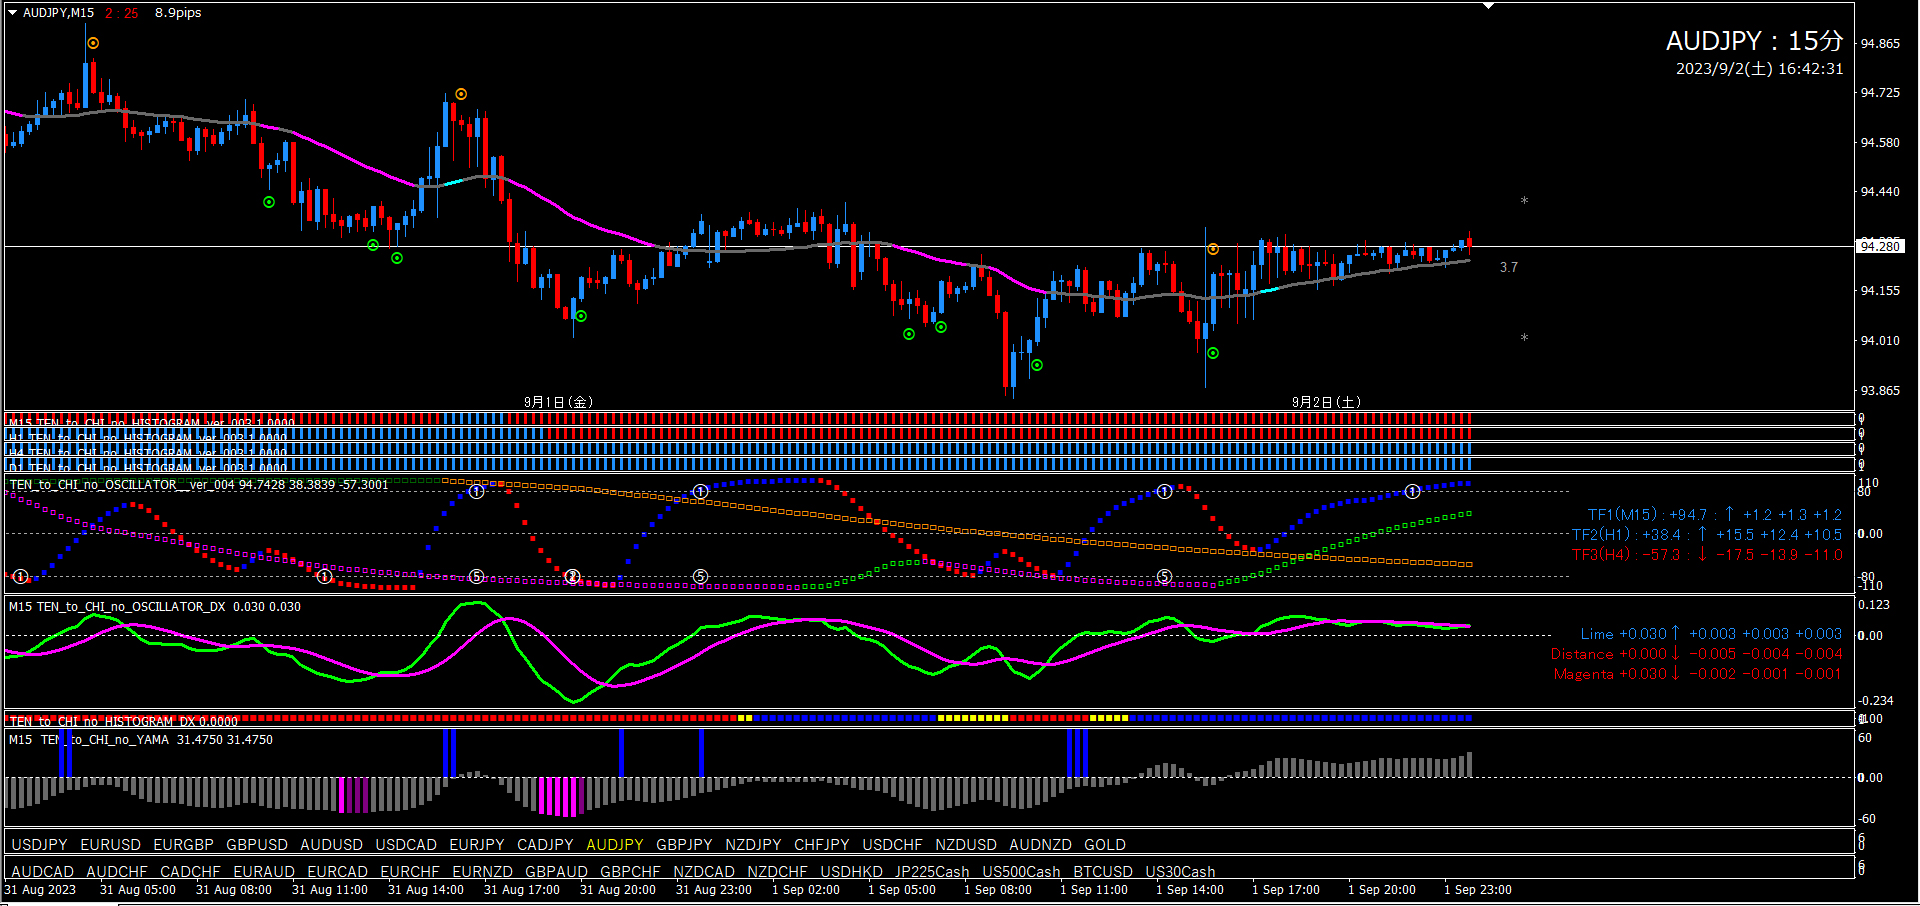
■ 15-minute chart (entry trigger)
Since the 4-hour chart indicates a bullish bias, I will target long entries only.
Currently Oscillator TF2 is already rising.TF2 itself has a smooth, angle-less ascent from the recent move, which is not a strong rise, but TF1 is in a good position, which serves as a basis for a long entry.Then we only need to wait for the entry trigger. Long point signals, valley signals, and Oscillator DX cross, once these are confirmed, proceed with a long entry. Since the 4-hour direction is clear, Abusan signals for entry are also very effective.

■ If using Ten to Chi EA (on 15-minute chart)
Based on the chart situation, I would set EA Pattern ①. Oscillator TF2 is already rising, and the current price is away from the line, so a long signal could appear. Since the mountain shape shows no valley, EA Pattern ④ is not considered.
■ If using Abusan Signals (on 15-minute chart)
If you have Abusan Signals, you can enter long on Signal 1 after waiting on Signal 2.With Abusan Signals, if the 4-hour bias is clear, you can ignore Oscillator TF2 direction and other justifications.

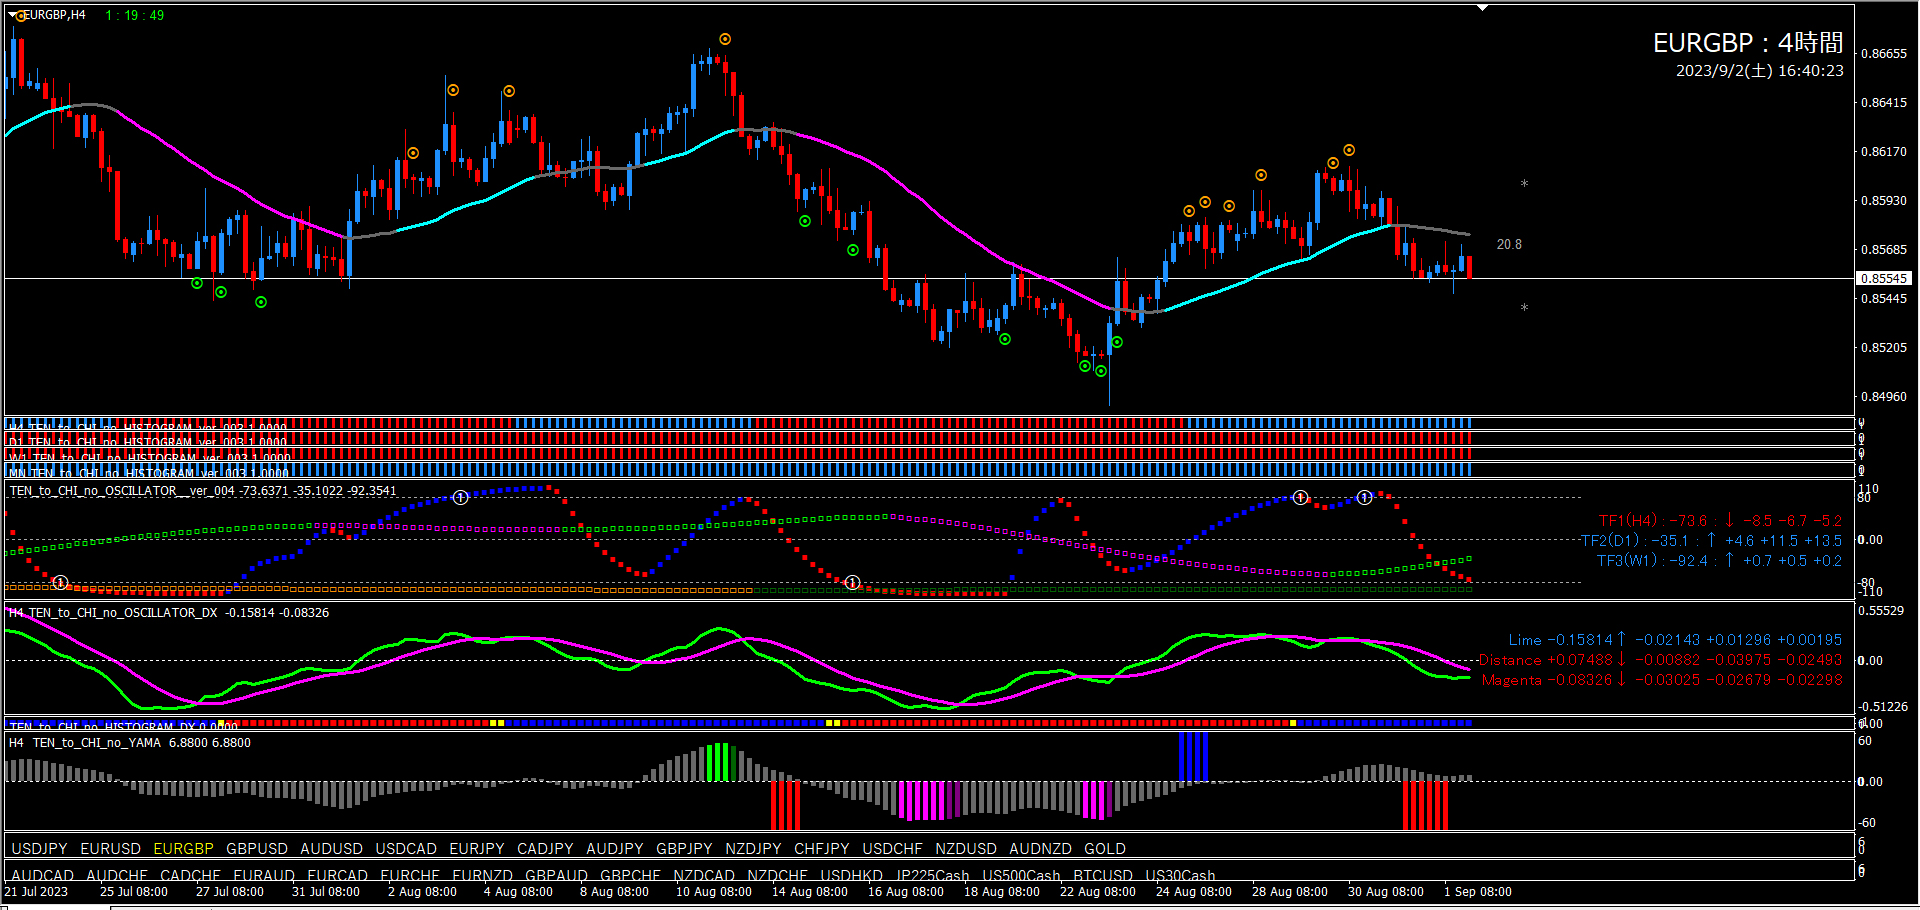
■ 4-hour chart (environment recognition)
Not a very favorable pattern. Oscillator TF2 is falling, butlooking at past patterns, it has been gradually drifting; this is not a strong decline.Therefore, going forward, since a long point signal appeared just recently, we will build a scenario around targeting a bullish bias. If Oscillator DX rises with a long point signal, we will judge it as bullish. Oscillator TF2’s past patterns do not show strong advantage, so we will rely on the two points above.
■ 15 minutes (entry trigger)
When the 4-hour chart becomes bullish, we will target long entries only.
Currently, the situation is not very favorable. The future scenario is to wait for Oscillator TF2 to rise first, then wait for the long point signal and valley signal. Oscillator DX has already crossed upward, but using this as a trigger now lacks sufficient justification. Wait for a dot or valley signal.

■ If using Ten to Chi EA (on 15-minute chart)
In this situation, I would set EA Pattern ① when Oscillator TF2 starts rising. If Oscillator TF1 and TF2 continue to fall and Oscillator Signal ② appears, using EA Pattern ③ to secure PIPs is another viable option.
■ If using Abusan Signals (on 15-minute chart)

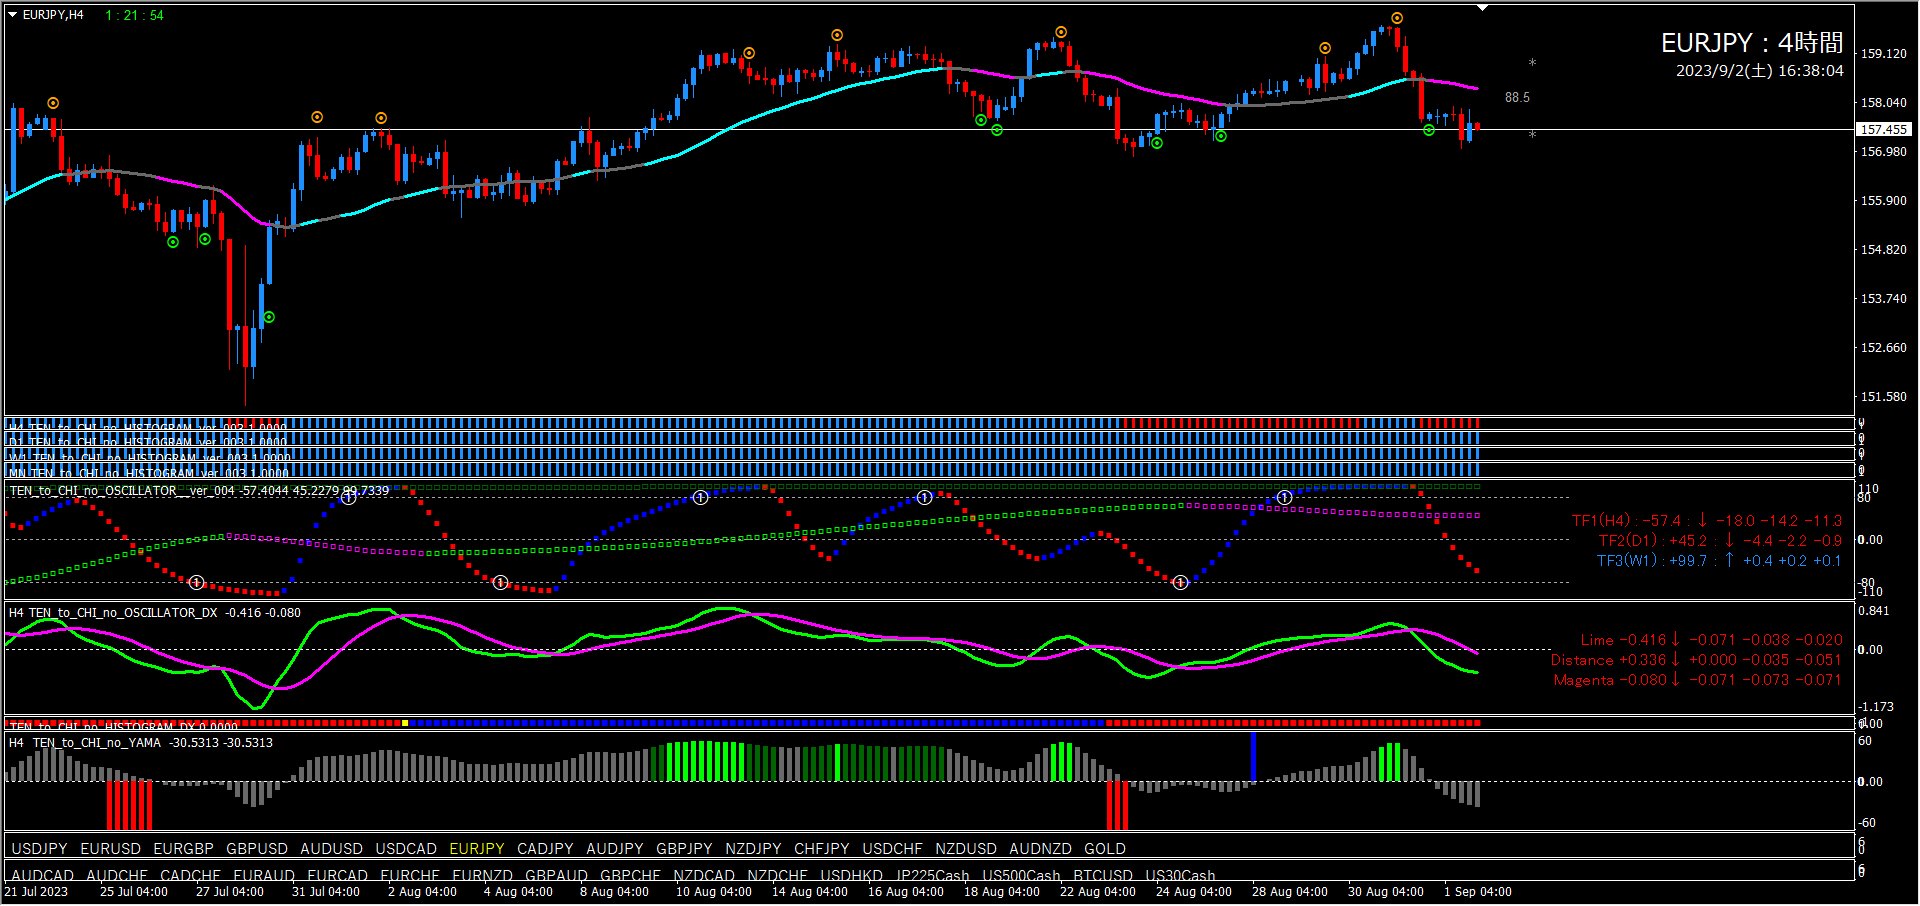
■ 4-hour chart (environment recognition)
Good pattern. Oscillator TF2 rising, TF1 in a good position,Oscillator DX shows Lime rising and Distance falling, indicating a bullish move.At this point, a bullish bias can be considered. However, if Distance of Oscillator DX increases, the bullish bias will be reset.
■ 15-minute chart (entry trigger)
Since the 4-hour chart is already bullish, we target long entries only.
Oscillator TF2 is already rising, so wait for long point and valley signals.Oscillator DX has been converging for a while and is not an ideal setup to enter on a rise; it is better to wait for a rising cross.If you can pull TF1 toward around -80, that would be ideal.
■ If using Ten to Chi EA (on 15-minute chart)
In this situation I would set EA Pattern ④. Oscillator TF2 is already rising, and the mountain shape suggests a valley signal could appear, so I would use Pattern ④ rather than ①.
■ If using Abusan Signals (on 15-minute chart)

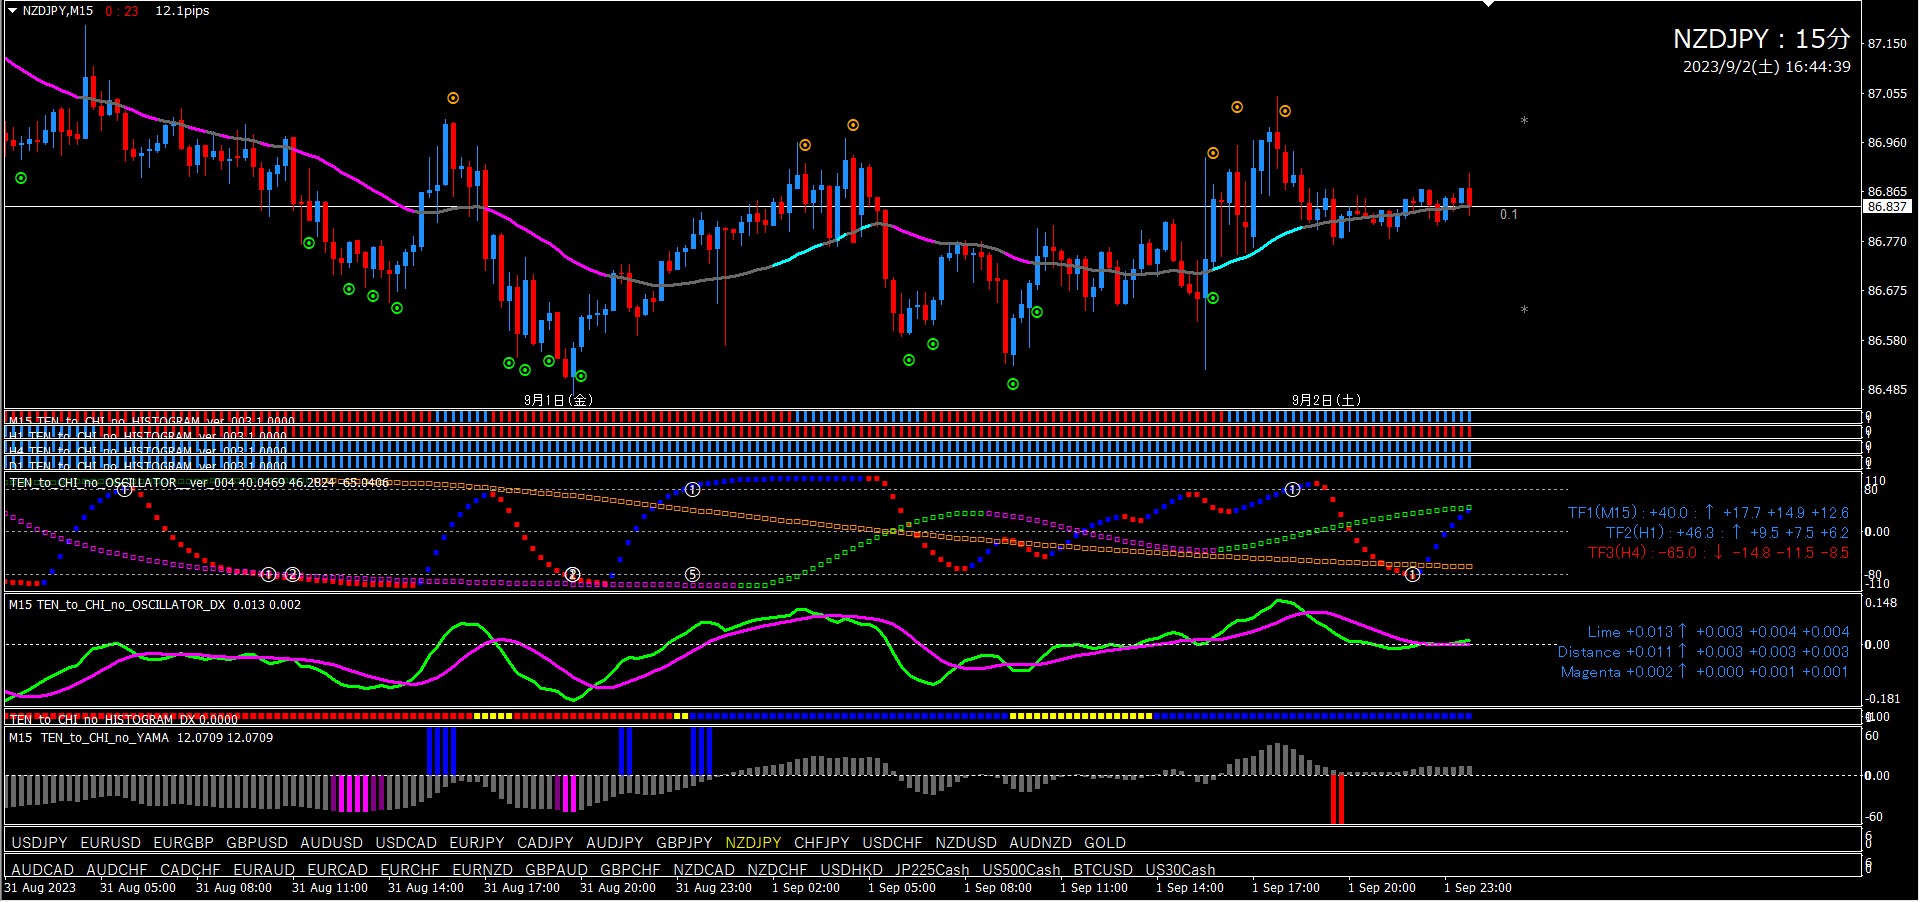
■ 4-hour chart (environment recognition)
Like Aussy Yen, it’s a good pattern.
Oscillator TF2 rising, TF1 also in a good position.Oscillator DX shows Lime rising and Distance falling, indicating bullish signs.At present, a bullish bias is reasonable. If Distance increases, bias would reset.

■ 15-minute chart (entry trigger)
Since the 4-hour chart is bullish, we target long entries only.
Oscillator TF2 is already rising. Looking at past patterns, movement is gradual, not a strong rise, but since the 4-hour chart is bullish, we will disregard minor concerns. Going forward, while TF2 is rising, we aim for long point signals and valley signals. Oscillator DX is starting to cross upward, so entering long now is feasible.
I would set EA Pattern ④ in this situation. TF2 is already rising, and the mountain shape suggests valley signals could appear, so I prefer Pattern ④ over ①.
■ If using Abusan Signals (on 15-minute chart)

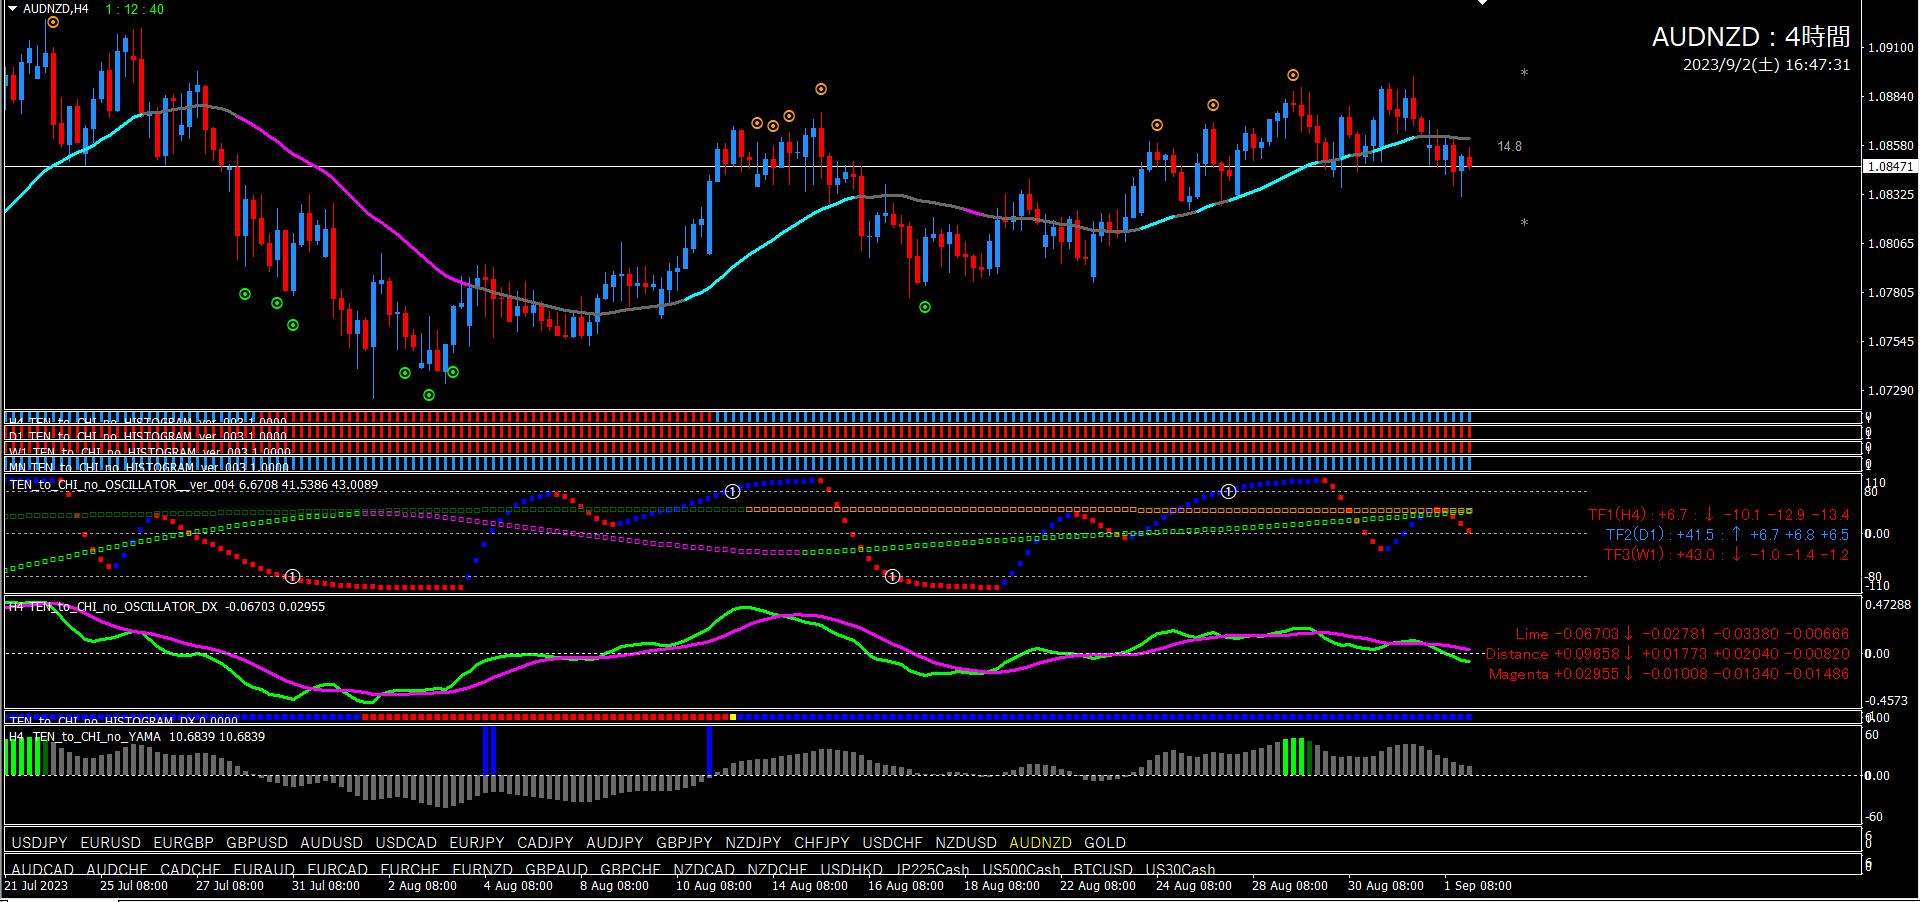
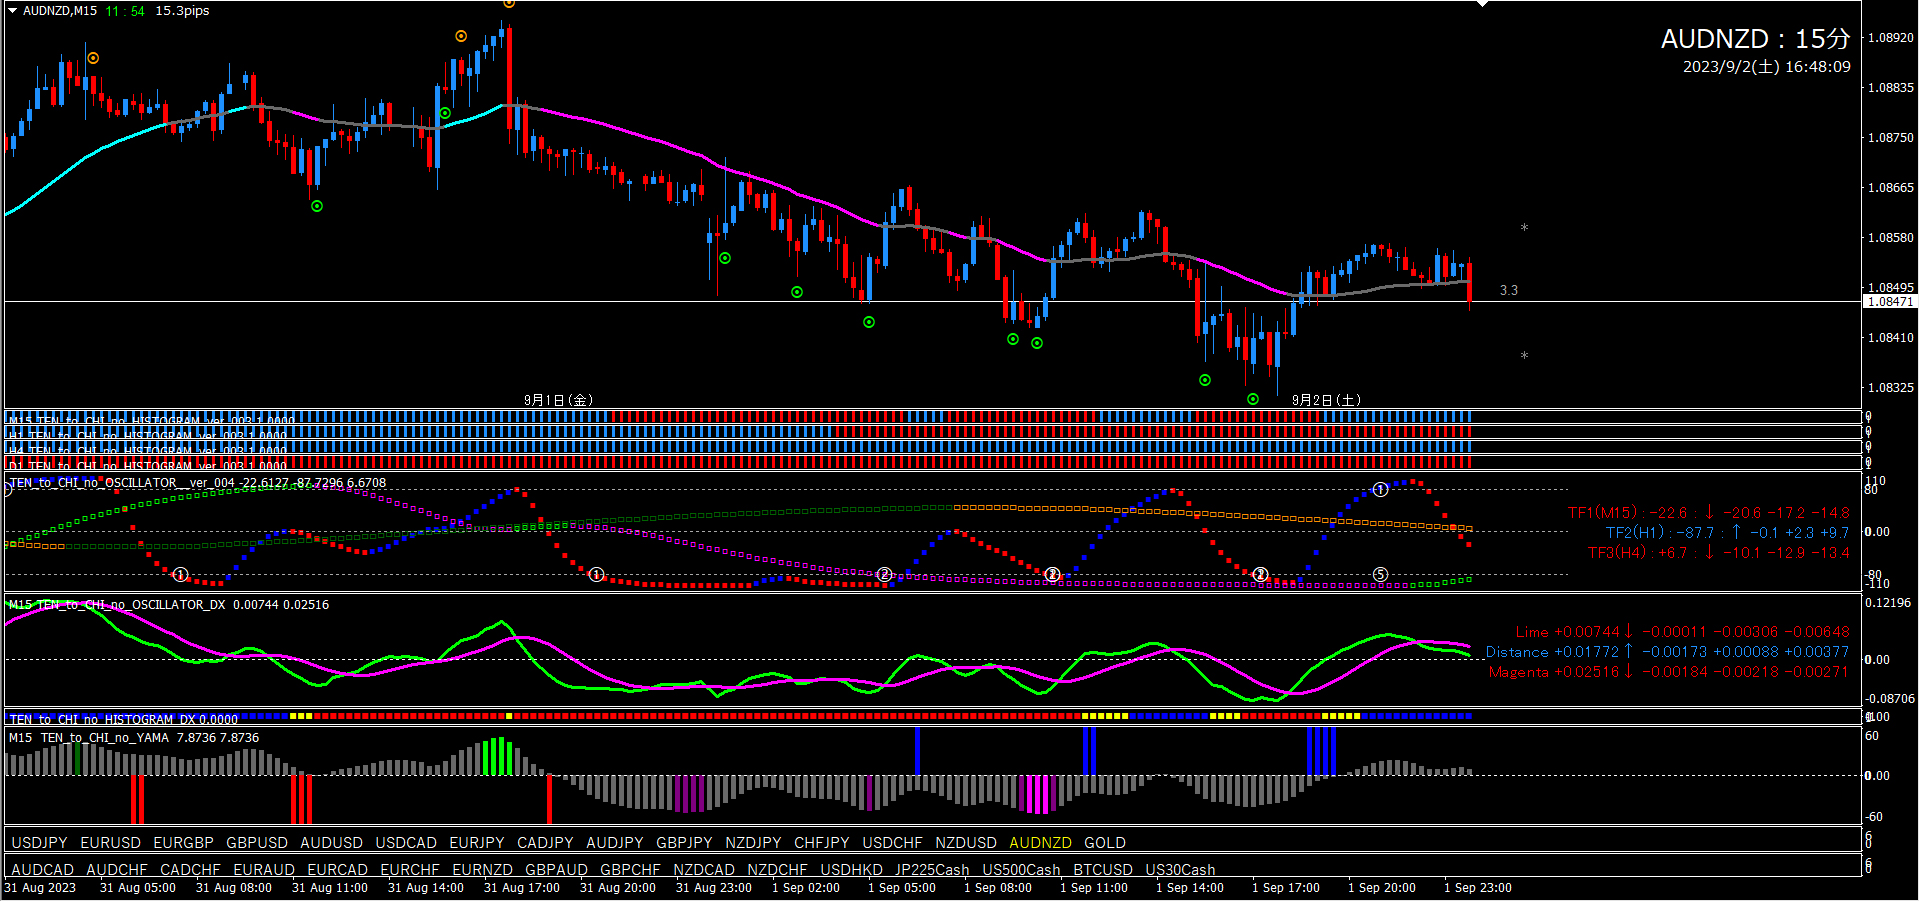
■ 4-hour chart (environment recognition)
Not the best pattern, but we will build a scenario toward bullish bias.
It may take some time to confirm, but in the future, if Oscillator DX becomes Lime rising and Distance falling, we can judge bullish bias. Ideally, TF1 would be around -80 at that time.
■ 15-minute chart (entry trigger)
We will remain on the sidelines until the 4-hour chart confirms a bullish bias.
If bullish, the future scenario is: while TF2 is rising, look for long point signals, valley signals, or Oscillator DX rising cross to enter long. Also closely monitor the state of Oscillator DX at entry. Lime rising and Distance falling would be ideal.
■ If using Ten to Chi EA (on 15-minute chart)
Although Oscillator TF2 is already rising, it may take some time to confirm a bullish bias on the 4-hour chart, so at present, no specific EA is chosen yet.
■ If using Abusan Signals (on 15-minute chart)

That is all.
May this be of some help to everyone.
