

Utilization of the "Visualization Indicator" (Part 110)
The use of "Visualization Indicator" (its110)
1. Further developing the "28 Currency Pairs List Indicator" into an indicator
"8CPVisualization Indicator"forCHFJPYto draw描く
There are versions of the "8CP Visualization Indicator" for Oceania, London, New York, and AnyCP. This time, the New York version was used.Oceania版、London版、NewYork
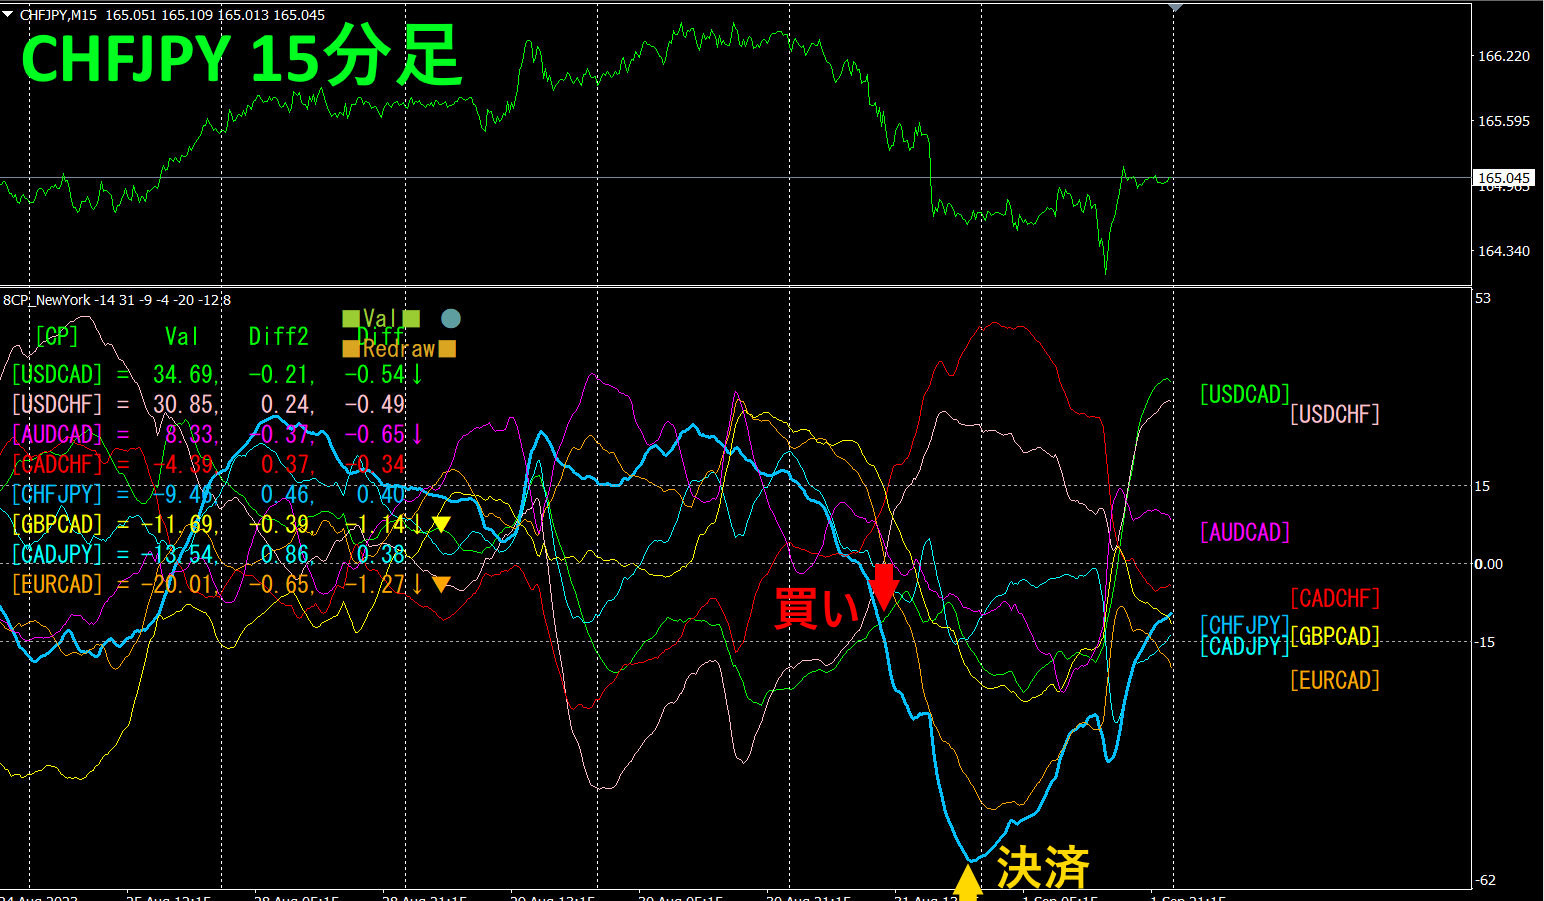
The upper half is the 15-minute chart of CHFJPY. The lower half is from the "8CP Visualization Indicator." The light blue thick line corresponds to CHFJPY.
On Thursday, CHFJPY broke below other chart groups, so a sell entry was made. At night, the graph hit a bottom and reversed, so it was closed for a profit of about 100 pips.
2. Best SelectTry the indicator
The figure below is a screenshot taken on 2023-08-30 04:20 (JST).
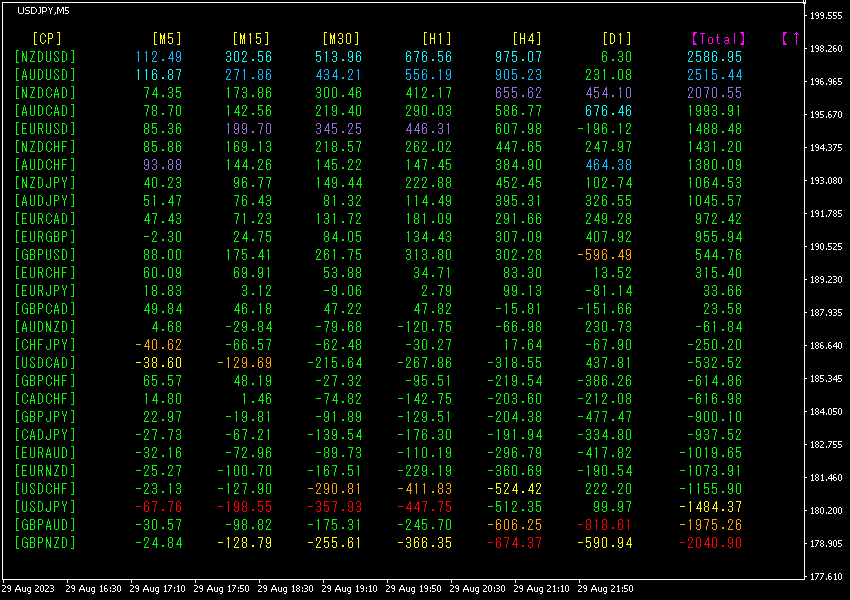
The numbers are sorted in descending order. The top row, NZDUSD, shows blue coloring on all timeframes except the [D1], and the total value is 2586.95, a large positive number. This indicates a strong uptrend for NZDUSD.
Now, let's look at the NZDUSD chart.
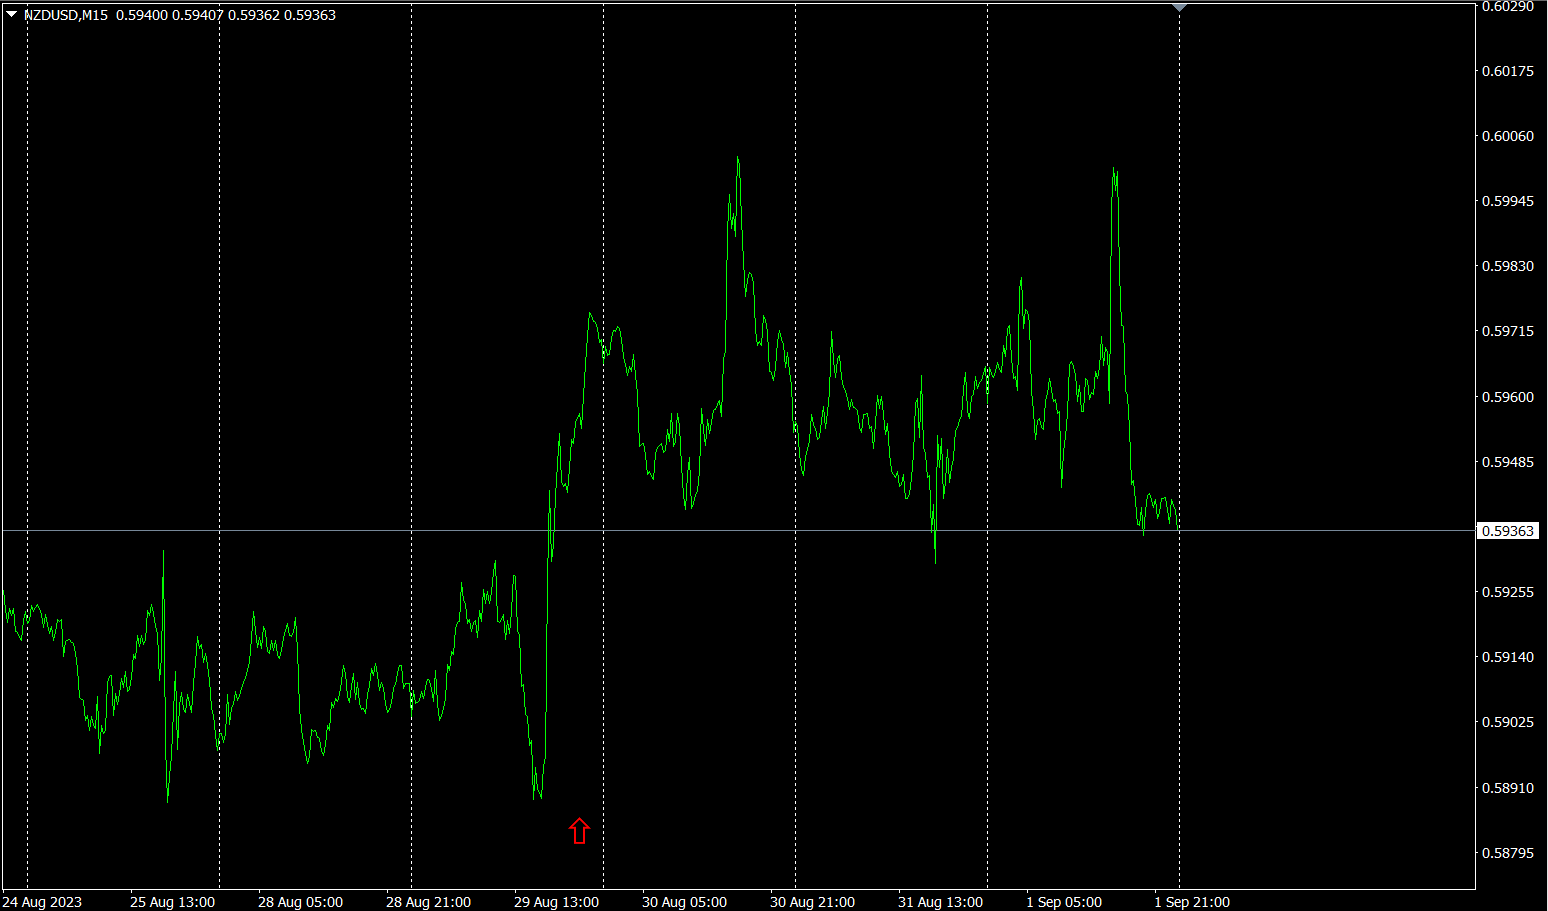
The red arrow marks the point when the screenshot was taken. It is in the midst of an upward trend with a rising right shoulder.
The "28 Currency Pairs Best Select" indicator allows you to easily identify which currency among 28 pairs is currently exhibiting the strongest trend. It also tells you, by numbers and colors, whether you should trade now. It is an excellent indicator for assessing the overall movement of all currency pairs at a glance.
"28 Currency Pairs Best Select Indicator"
https://www.gogojungle.co.jp/tools/indicators/35128

3. Since May of the year before last, how did EURJPY move?
Since May 2021, we have been tracking EURJPY.
To see the overall trend, a 30-minute chart covering roughly the last three weeks is drawn.
Previously, I wrote the following.
EURisJPYis slightly downwardly oriented, with neither showing a clear direction. The future movement of EURJPY is likely to be directionless for a while.
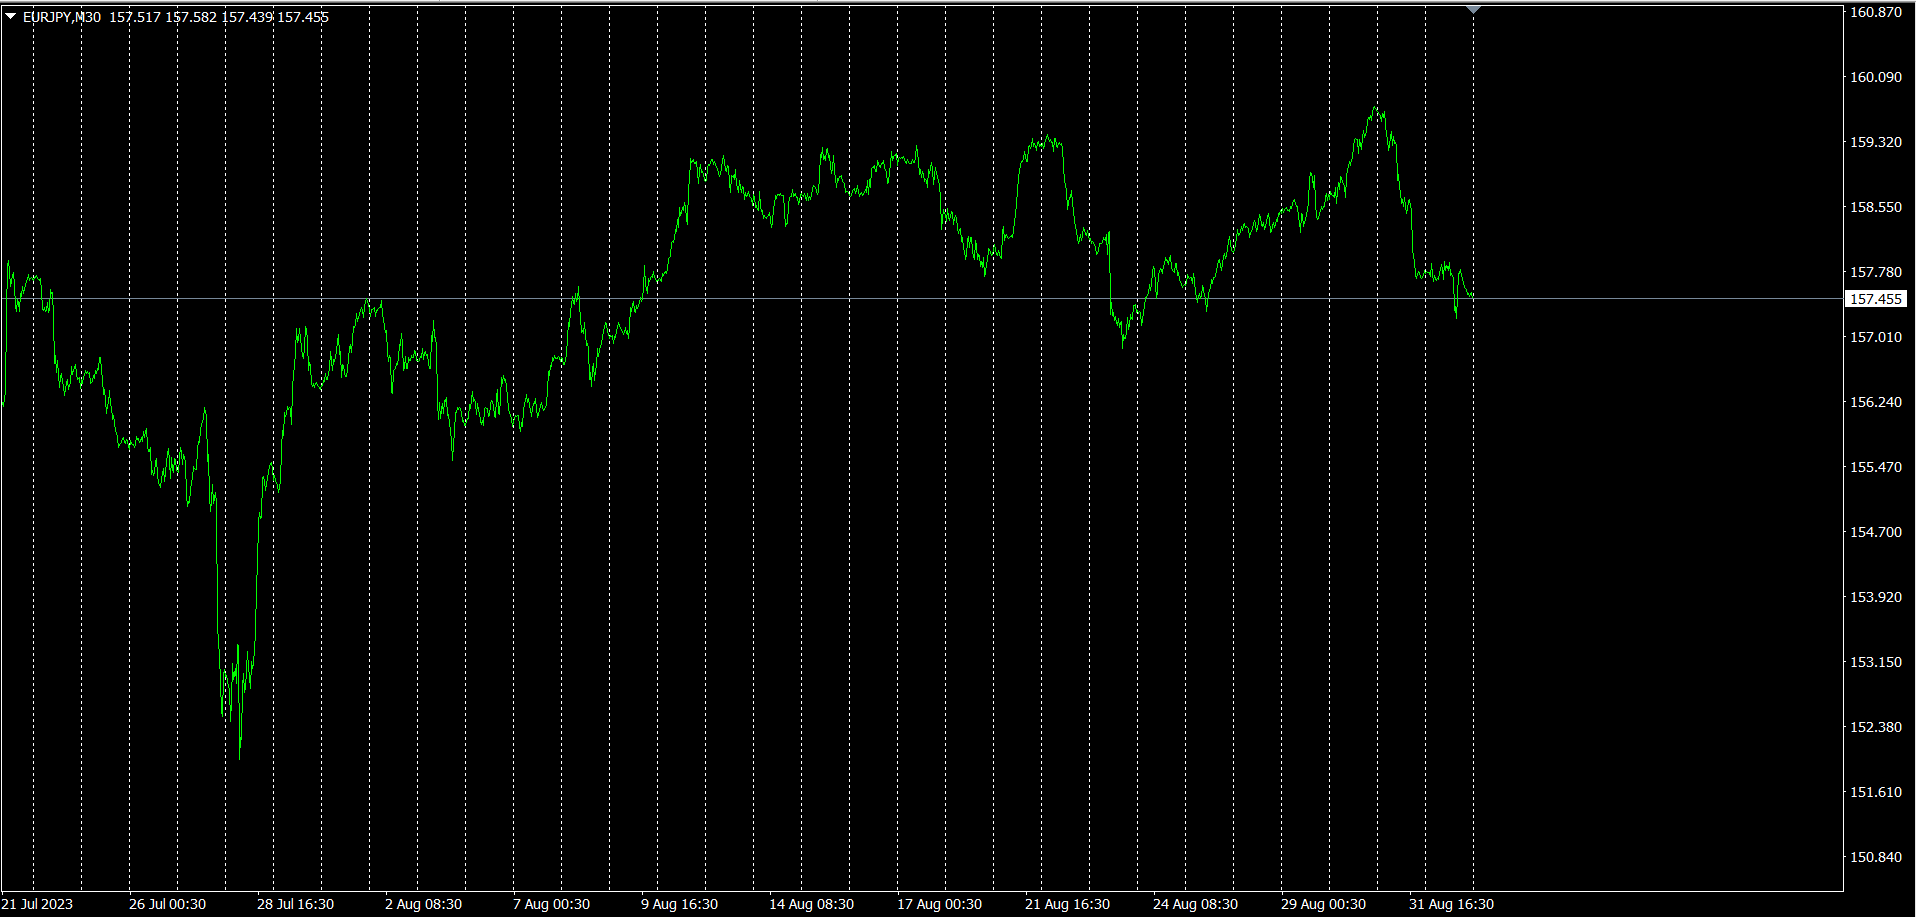
In the first half of the week it rose, but in the latter half it declined.
4Time-frame currency strength chart.
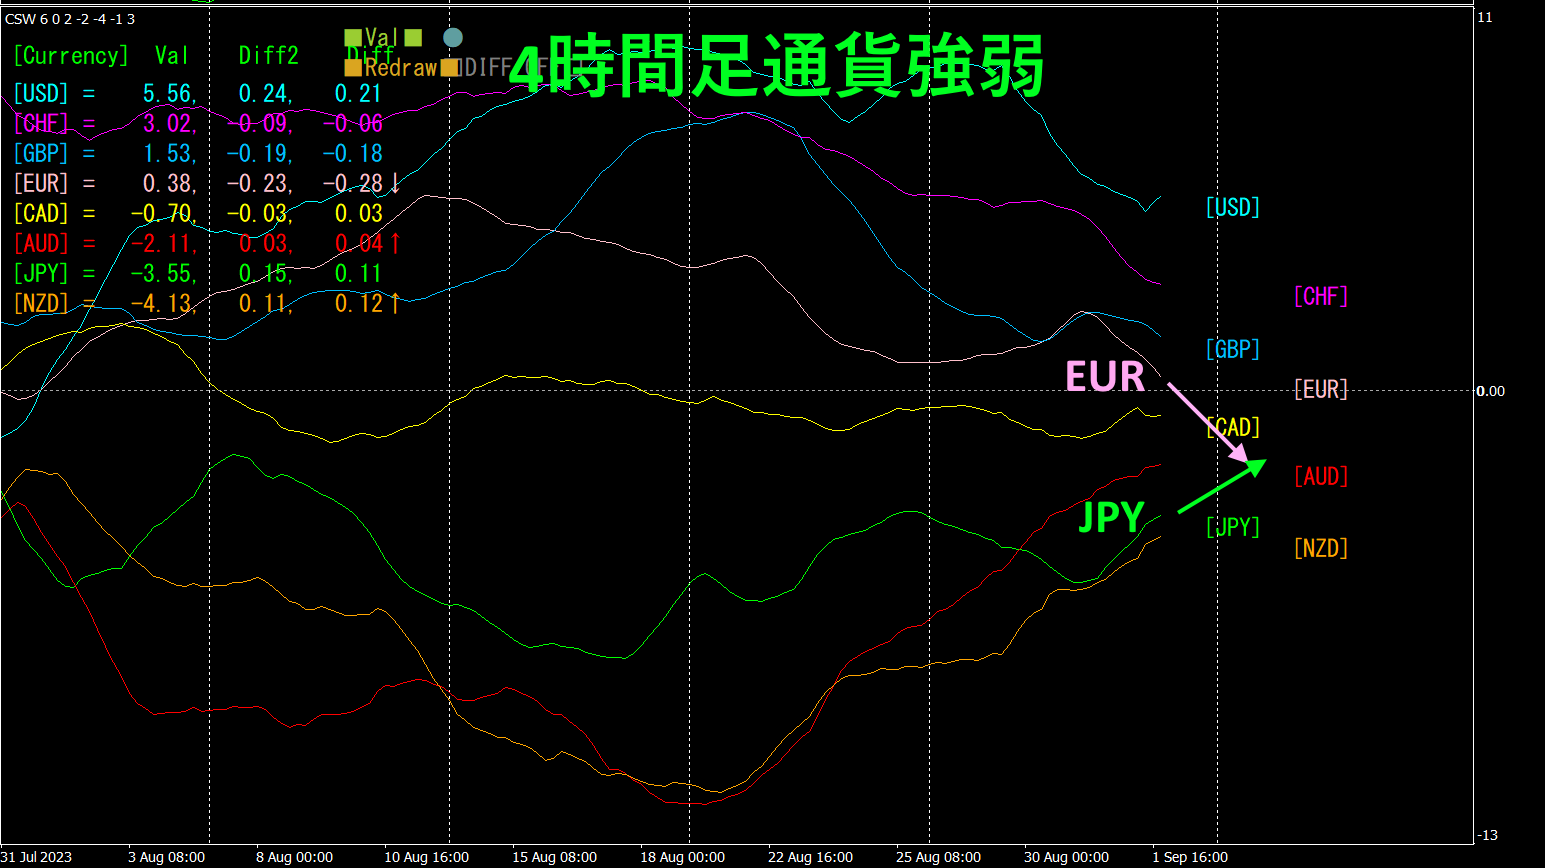
Pink isEUR, green isJPY. EUR is downward, JPY is upward. EURJPY is expected to trend downward.
4. Find the bottom across all currency pairs and build a trend strategy (target: USDCHF)
2505"Heaven's Bottom Search Indicator"Thus, USDCHF was sought as the next target pair.
Let's look at the USDCHF chart.
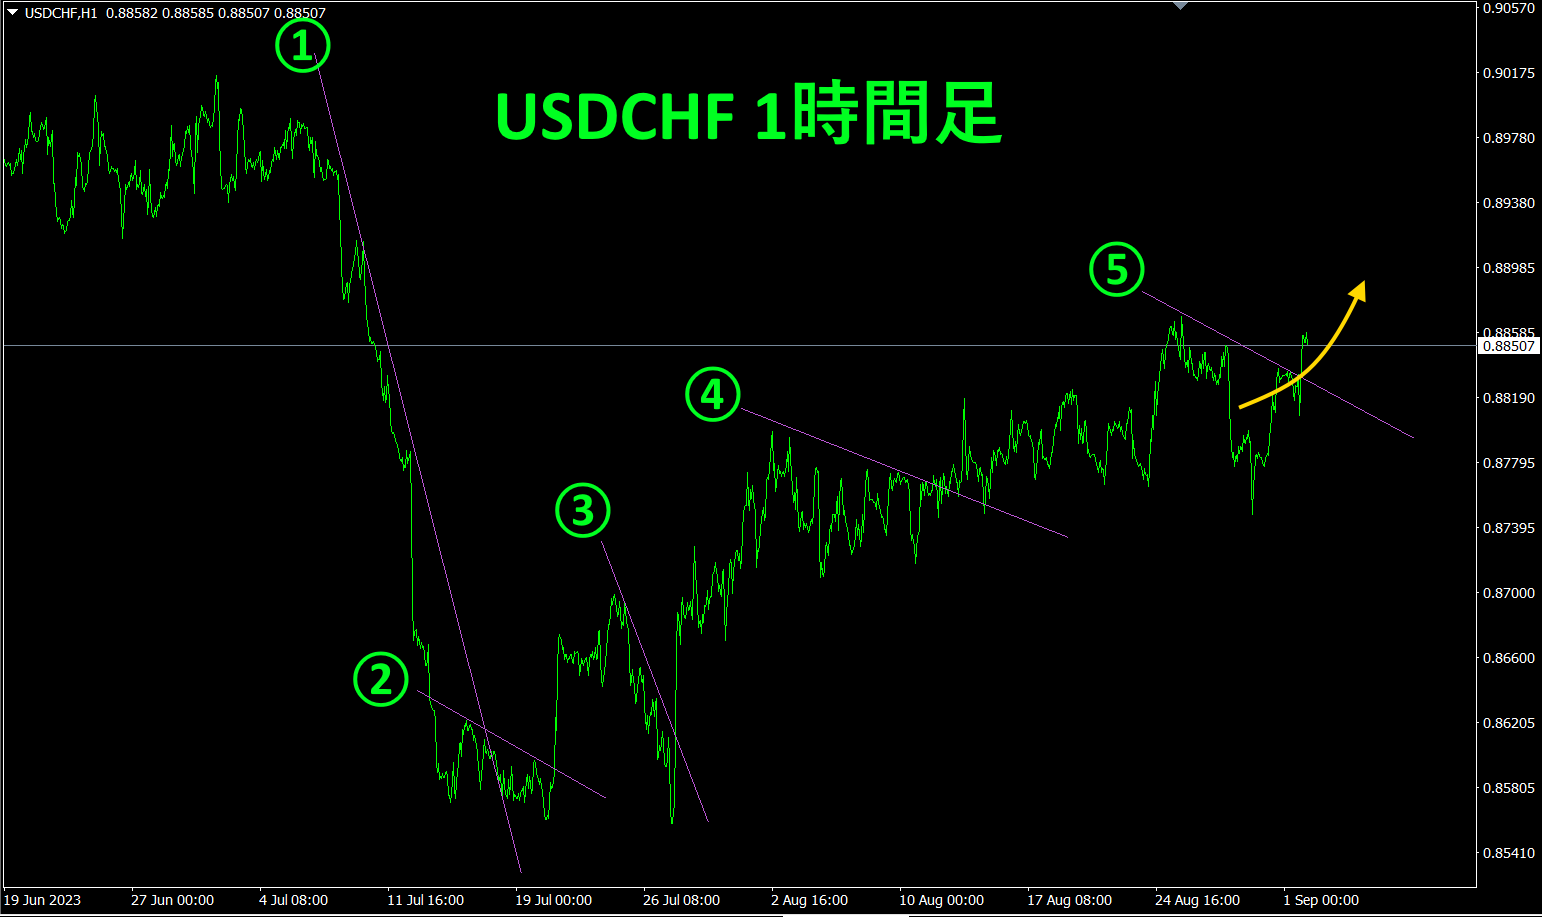
USDCHFis in the "bottom-to-reversal" phase, so you draw downtrend lines as steps 1–5, and as soon as the price breaks above them you buy, continuing to enter. Currently, a long position is held.
This is a simple, easy-to-understand trading approach: just repeat it. The current rate is0.88507. On the daily chart, a decline began near0.8980, so a rebound to around that level is expected, leaving a potential reverse of about130pips. This is all about catching profit using the "Trend Line EX".
If you have "Trend Line EX", you can draw a slanted downward line; when it’s broken upward, you buy automatically, and when the price breaks above, you exit automatically—an automated, passive trading approach.
※"Trend Line EX"

https://www.gogojungle.co.jp/tools/indicators/42257
If you are interested in the "8C Currency Strength Visualization Indicator," please refer to the following page.
MT4版 https://www.gogojungle.co.jp/tools/indicators/39150
MT5版 https://www.gogojungle.co.jp/tools/indicators/39159
【My items for sale】


