

[August 27, 2023] Chart analysis using sky and earth indicators
This is a chart analysis of six currency pairs: EURJPY, GBPUSD, EURUSD, USDJPY, CHFJPY, and USDCHF.
I would be happy if you could read it when you have time.
Table of Contents

・This article mainly focuses on chart analysis and backtesting using the "Celestial Indicator" (Ten to Chi no Indicator).
・The content is structured based on using the most accurate tool in this system, the “15-minute chart + 4-hour chart simultaneous monitoring method.”
・This tool is a groundbreaking trading tool that can be used without understanding conventional FX theories (Elliott Wave, Dow Theory, Grandville's Law, cycle theory, price action, Fibonacci, support/resistance, channels, etc.).

Ten to Chi no Indicator is a trading method using the original indicator developed by me, Abu-san, released in February 2022.
Thanks to everyone's support, we received the “GogoJungle Award 2022.”
■ Ten to Chi no Indicator
https://www.gogojungle.co.jp/tools/indicators/35780
■ Ten to Chi no Mountain
https://www.gogojungle.co.jp/tools/indicators/37744
■ Ten to Chi no EA ~ Semi-Automated Trading System ~
https://www.gogojungle.co.jp/tools/indicators/43213
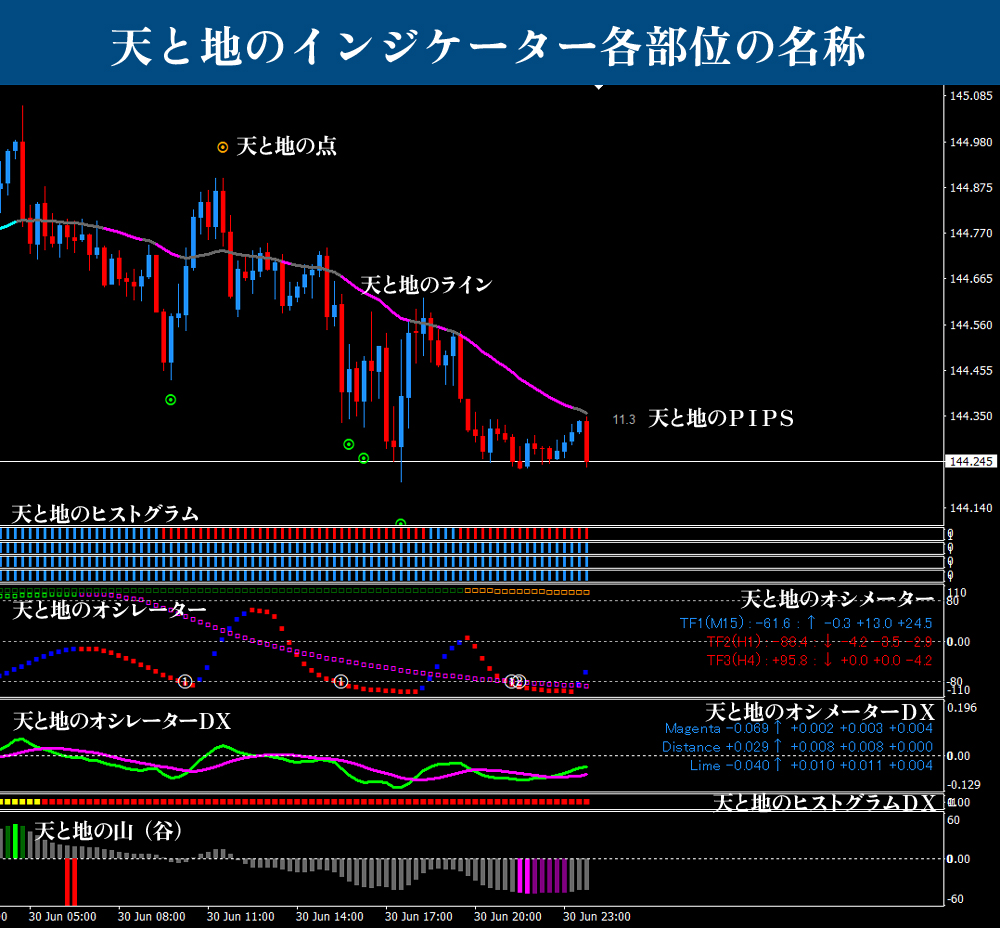
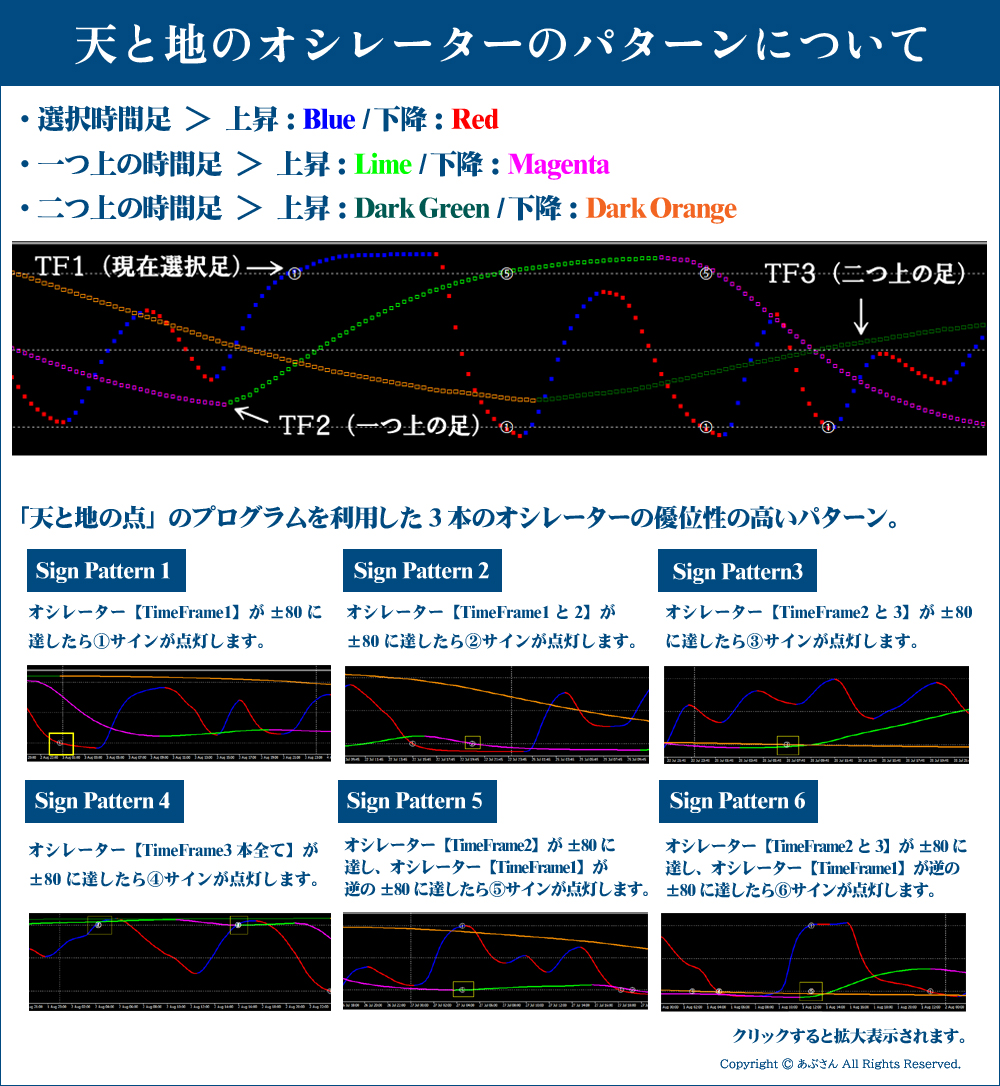
※Regarding the specialized terms used in this blog, please refer to the following: “Names of Each Part of Ten to Chi no Indicator” and “Patterns of Ten to Chi no Oscillator.” If you have any other questions, please refer to the Ten to Chi no Indicator sales page. For existing users, reading the user manual should suffice.If you have any further questions, you can usually find answers on the Ten to Chi no Indicator sales page.Existing users should have no problems after reading the manual.
Now, let us move on to the analysis.
Thank you in advance!

■ 4-hour chart (environmental recognition)
Oscillator TF2 is descending; there was a short entry point signal just before; histogram DX is red; there is a short valley as well. Normally we would be bearish at this point, but looking at TF2’s previous movements, it has continued to reverse without tilting at an angle.Since TF2 is not a 80-point drop, the edge is low. Therefore, we will determine a bearish stance after confirming the downward crossing of Oscillator DX.
■ 15-minute chart (entry trigger)
If we decide bearish on the 4-hour chart, we will target only short entries on the 15-minute chart.
The future scenario is: first, Oscillator TF2 turns down; then entry triggers (dot signal, valley signal) for a short, or Abu-san signal is fine if you have it.Abu-san Signal is also acceptable.
By the way, since Oscillator DX is already descending, the short entry signals that appear at this time have higher significance than usual.
■ If using Ten to Chi no EA (on the 15-minute chart)
Once you confirm the downward reversal of Oscillator TF2, set EA Pattern ① or ④. Which one to choose can be judged by how far the current price is from the line, or by the shape of the peak (refer to past charts). Also, as a reliable usage method for EA Pattern ④, set it after the valley appears (EA Pattern ④ automatic entry triggers when the valley signal lights up and then turns off).
For reliability, if Oscillator Signal ② is about to appear, set EA Pattern ③.
There is also a bold option to set all three EA patterns. With this setup, the first EA that meets the conditions starts trading.
Abu-san Signal users can use the enclosed “Auto Trading EA” with only short settings to continuously enter on short signals.

■ 4-hour chart (environmental recognition)
Oscillator TF2 started to rise gradually. There are long entry signals, and TF1 is in a good position. Oscillator DX is moving toward a bullish cross. Although both the histogram and DX are red, as a general view, we can consider the outlook to be bullish for now. It would be more reliable to wait for Oscillator DX to cross upward.
As a practical approach, a split-entry method can be used: enter with half a lot before the DX cross, and enter another half once the cross is fully confirmed.
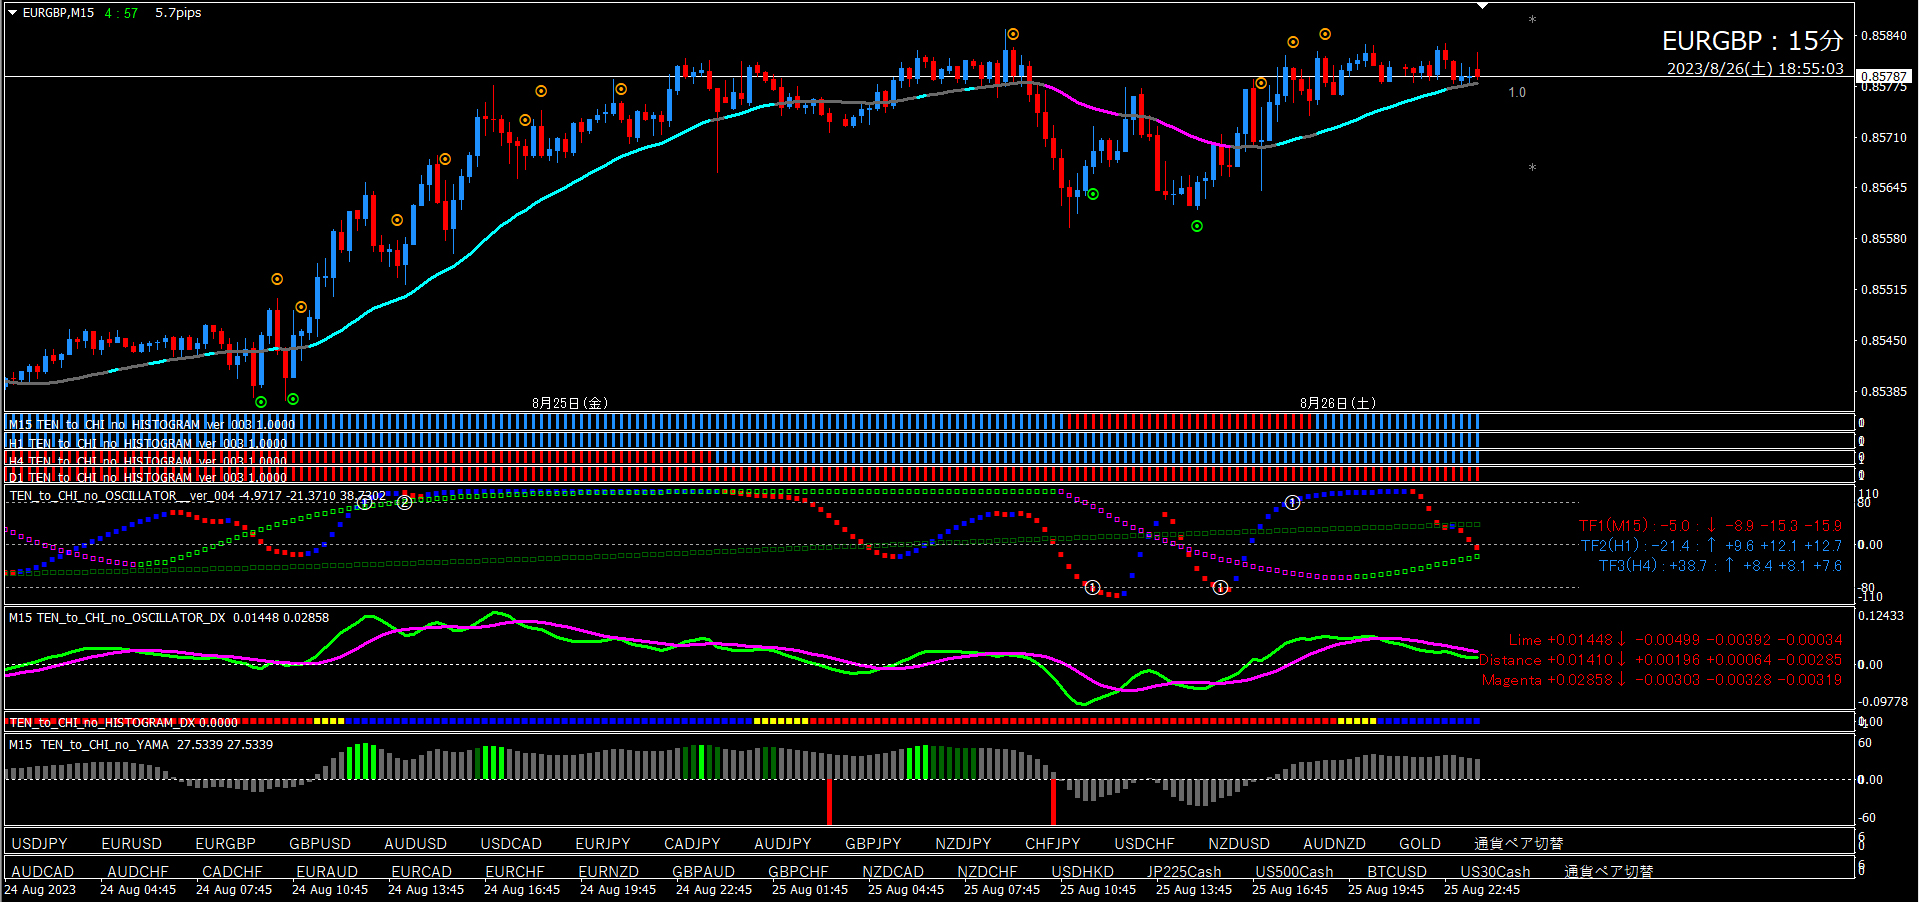
■ 15-minute chart (entry trigger)
Since we have an upward outlook on the 4-hour chart, we will target long entries on the 15-minute chart.
The future scenario is to first wait for Oscillator TF2 to rise.(Previously TF2 did not turn downward from +80 but descended smoothly around +50, so in such cases a return to upward movement is likely.)
When Oscillator TF2 begins to rise, trigger long entries with a dot signal or valley signal, or Abu-san Signal, and the rising cross of Oscillator DX. If possible, bringing Oscillator TF1 toward around -80 would strengthen the case.Abu-san Signal is also acceptable.
■ Ten to Chi no EA (15-minute chart usage)
Same as EURJPY above.
If Oscillator TF1 and TF2 continue to fall and Oscillator Signal ② is about to appear, using EA Pattern ③ to reliably capture PIPs is one option.If Oscillator TF1 and TF2 keep declining and Oscillator Signal ② is about to appear, using EA Pattern ③ is a good option to secure PIPS.

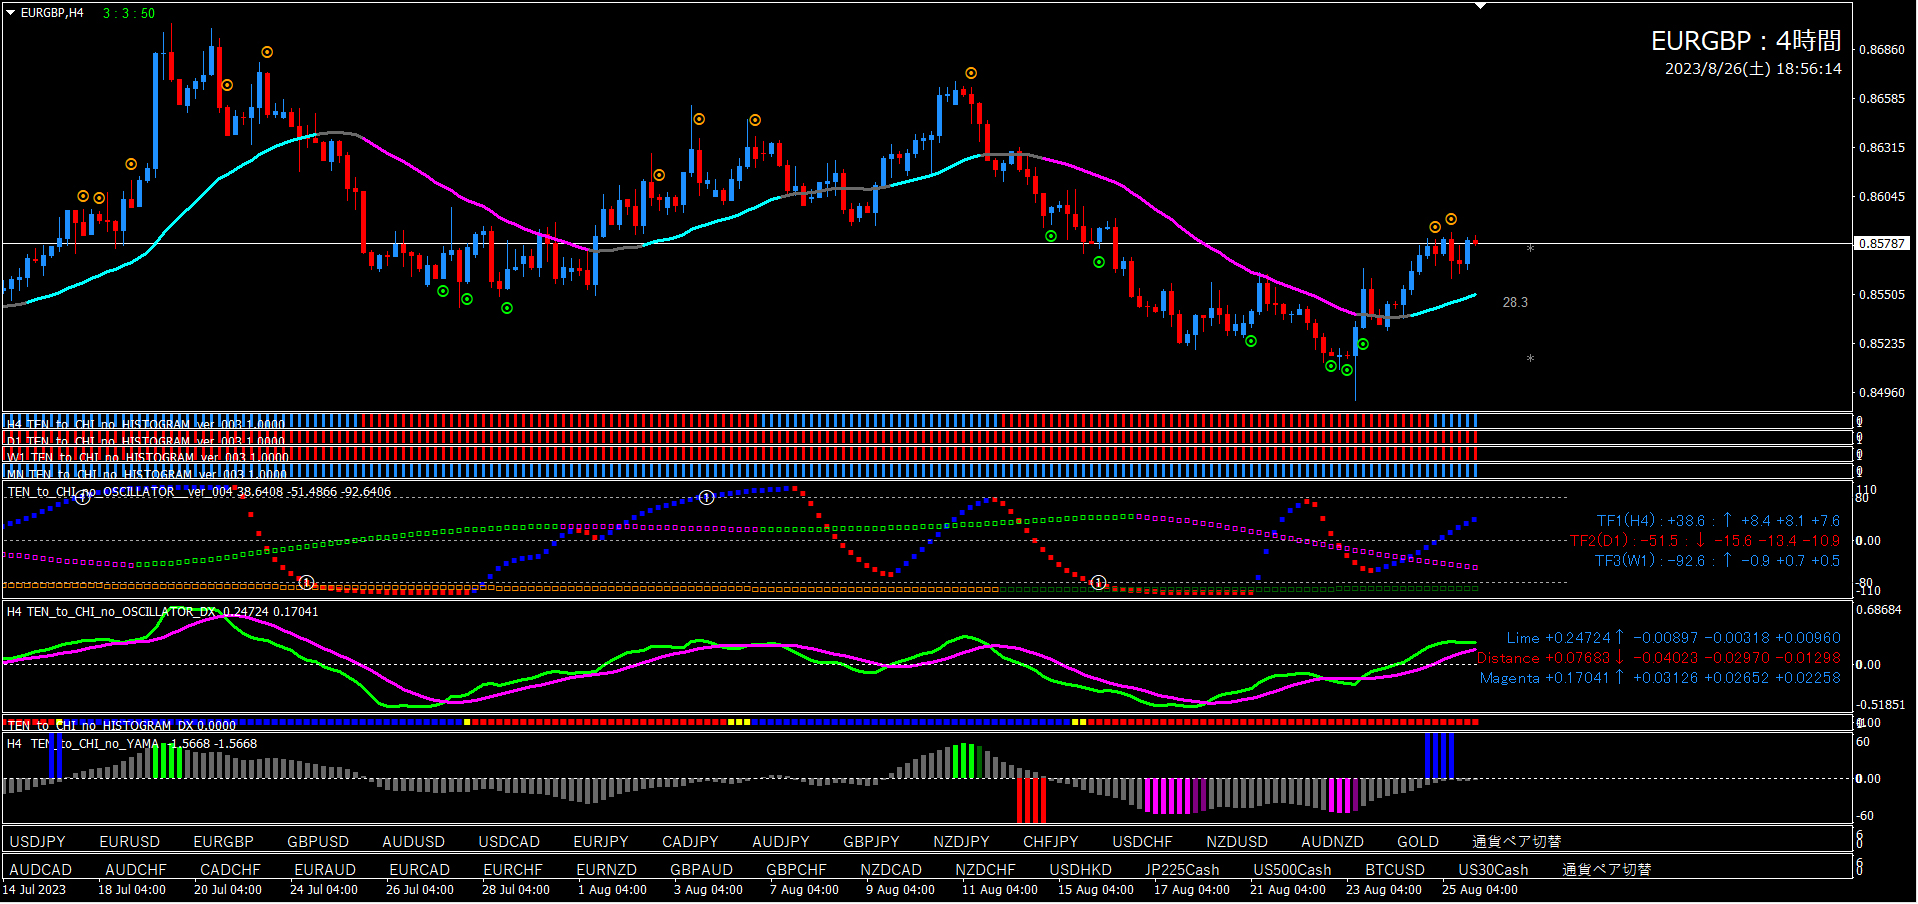
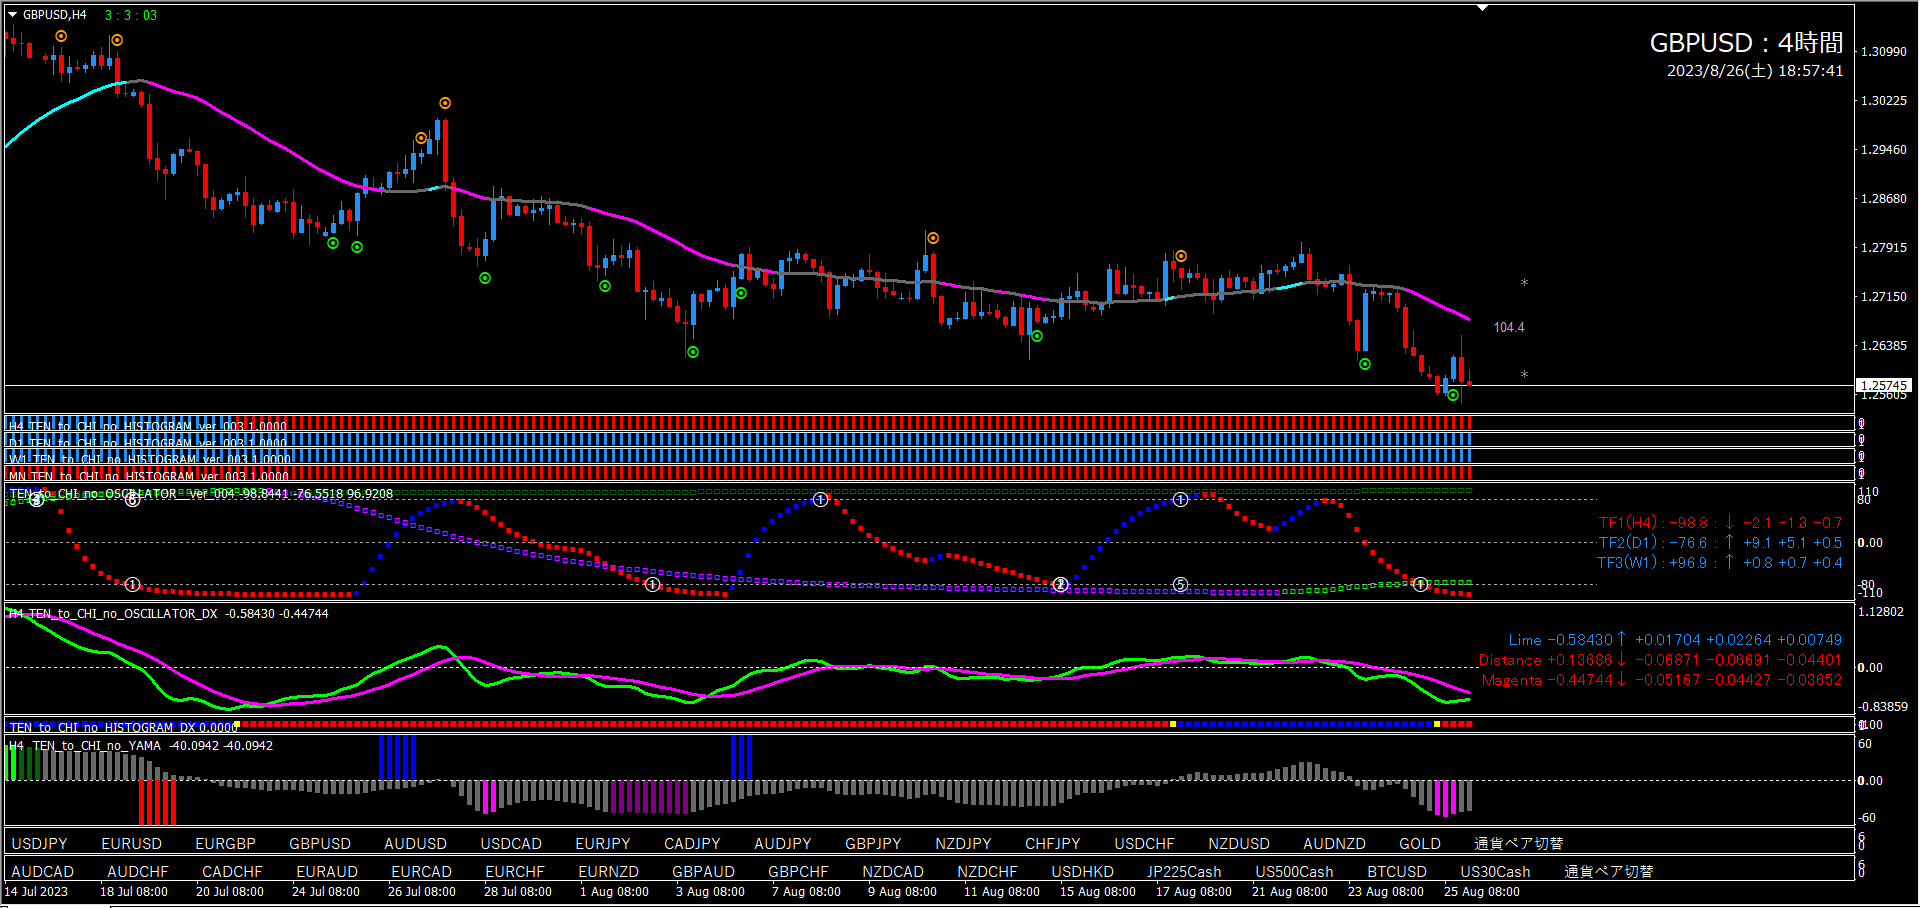
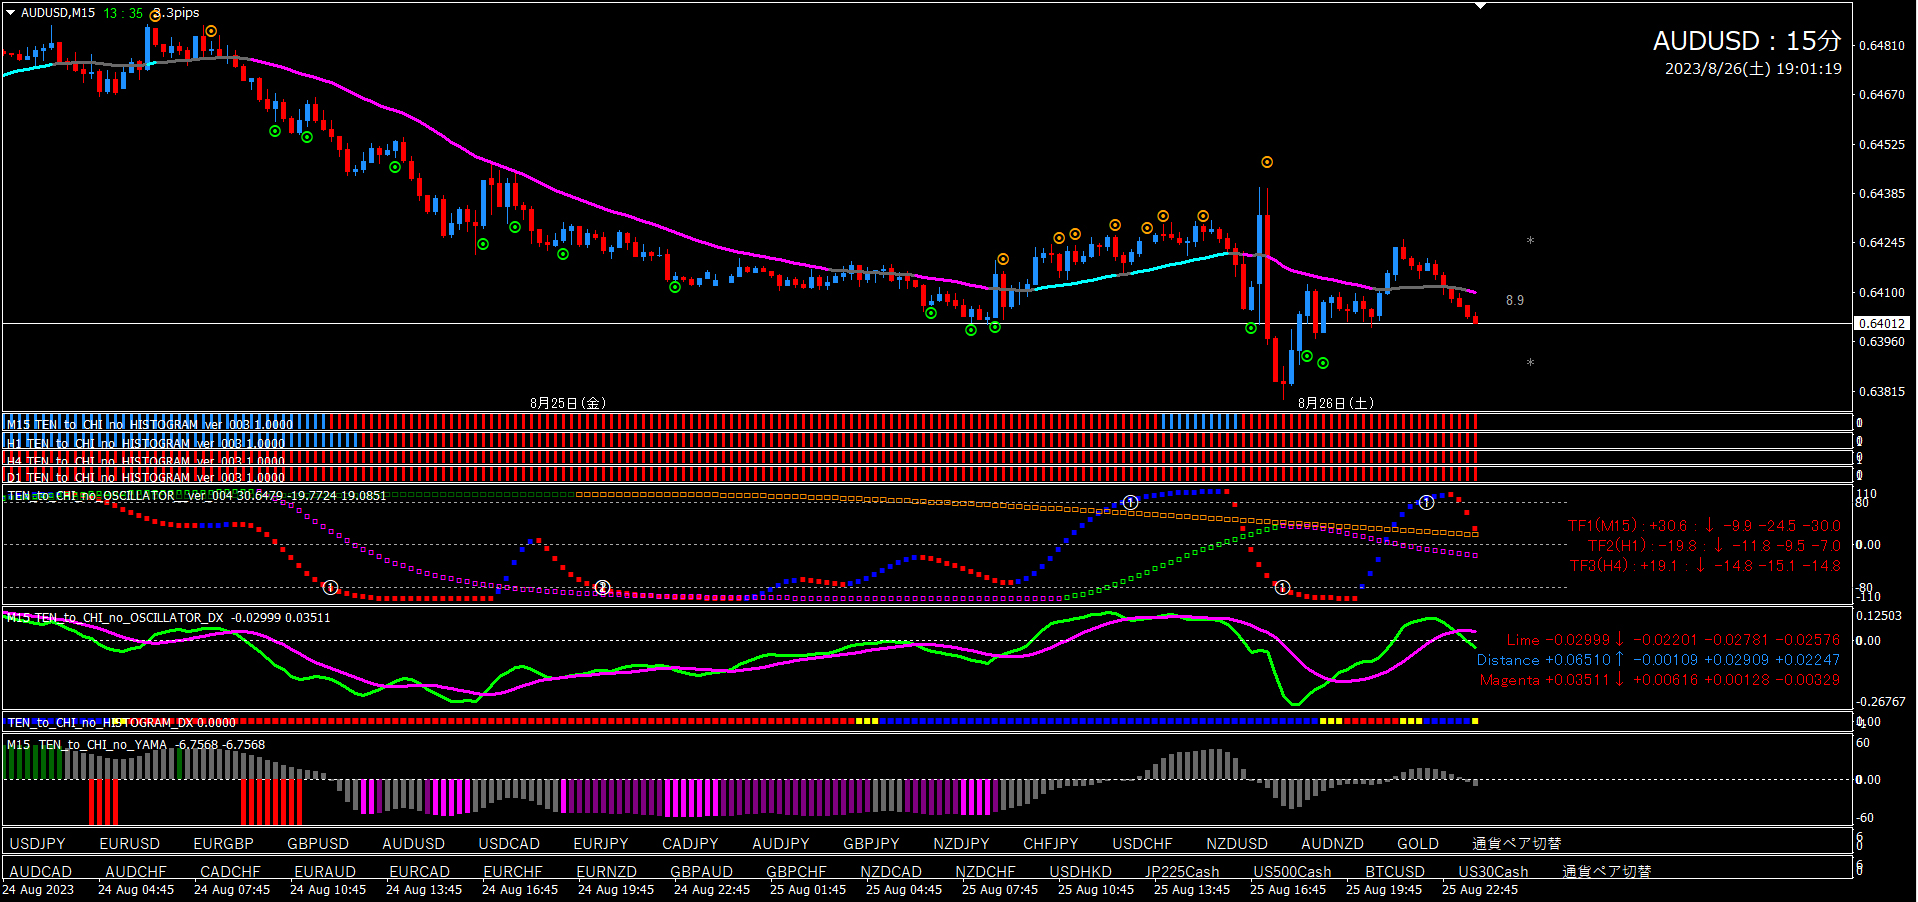
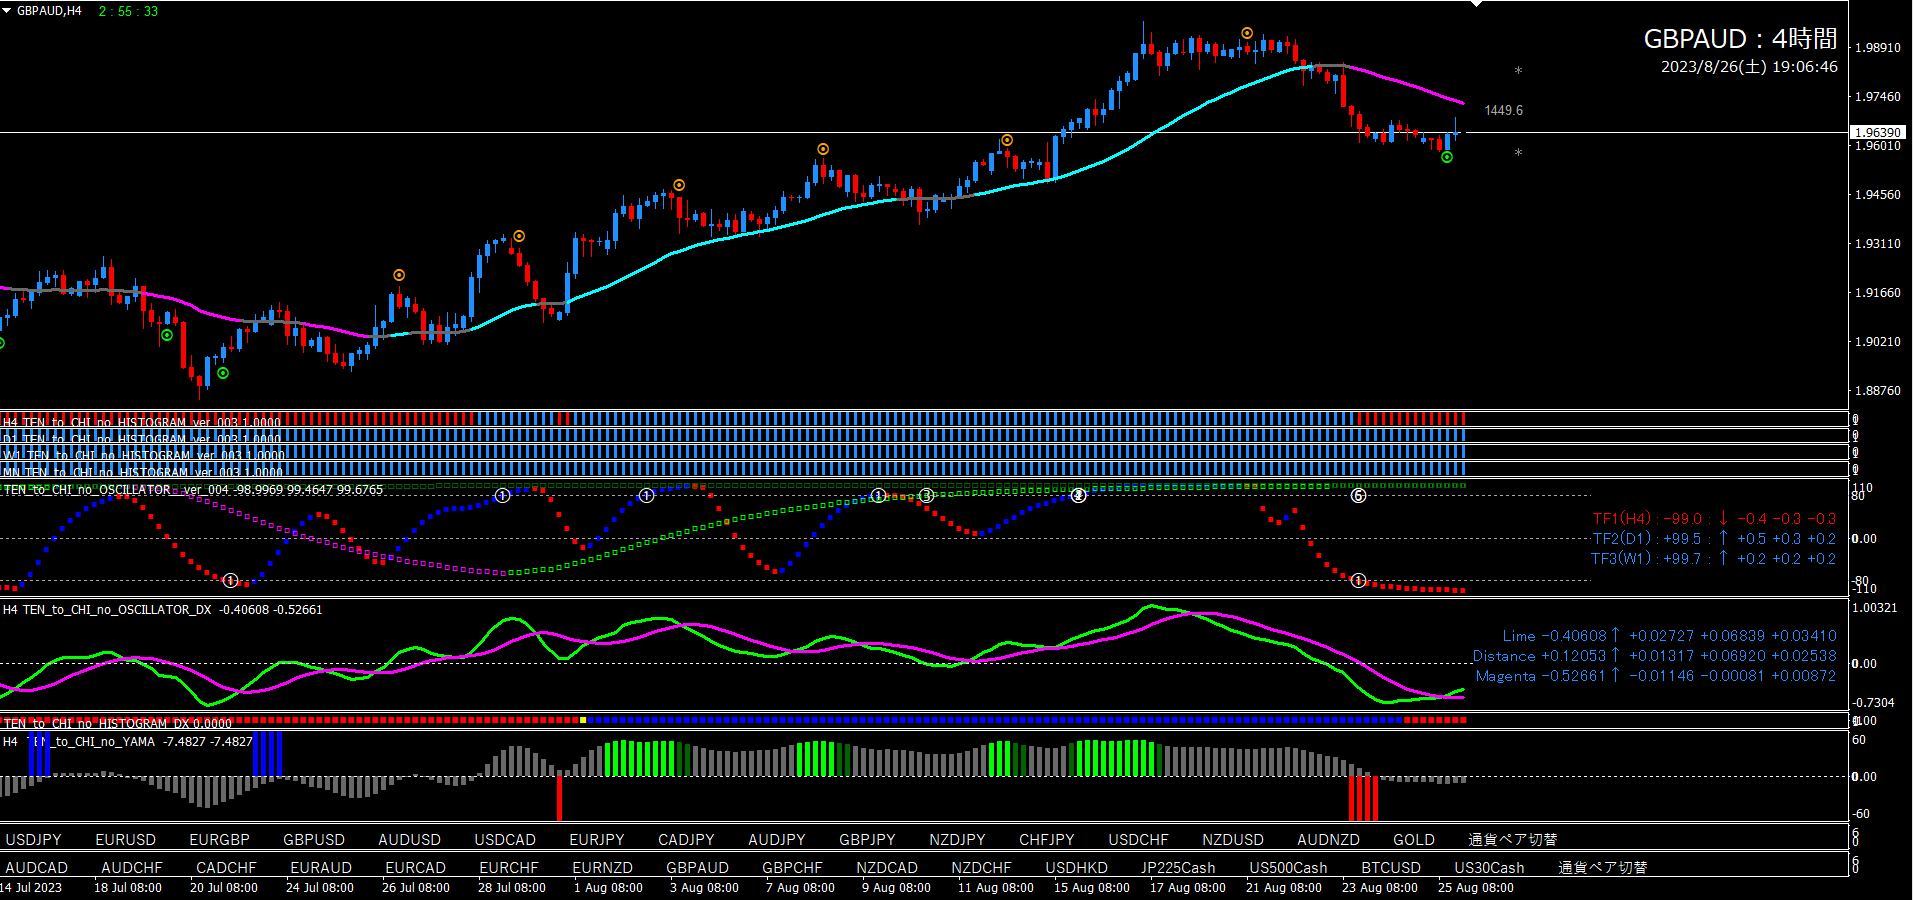
■ 4-hour chart (environmental recognition)
Just before, there was a short entry signal. This was an excellent shorting point. Congratulations to those who shorted here!
As of now, based on the position of Oscillator TF1, there seems to be room for further downside. The current price is near the line, so we continue bearish. If Oscillator DX crosses upward or a long dot signal appears, we will temporarily end the bearish outlook.
With Oscillator DX distance decreasing, it looks like it is contracting toward an upward cross, but since the price line is also decreasing, this contraction is not a worry.
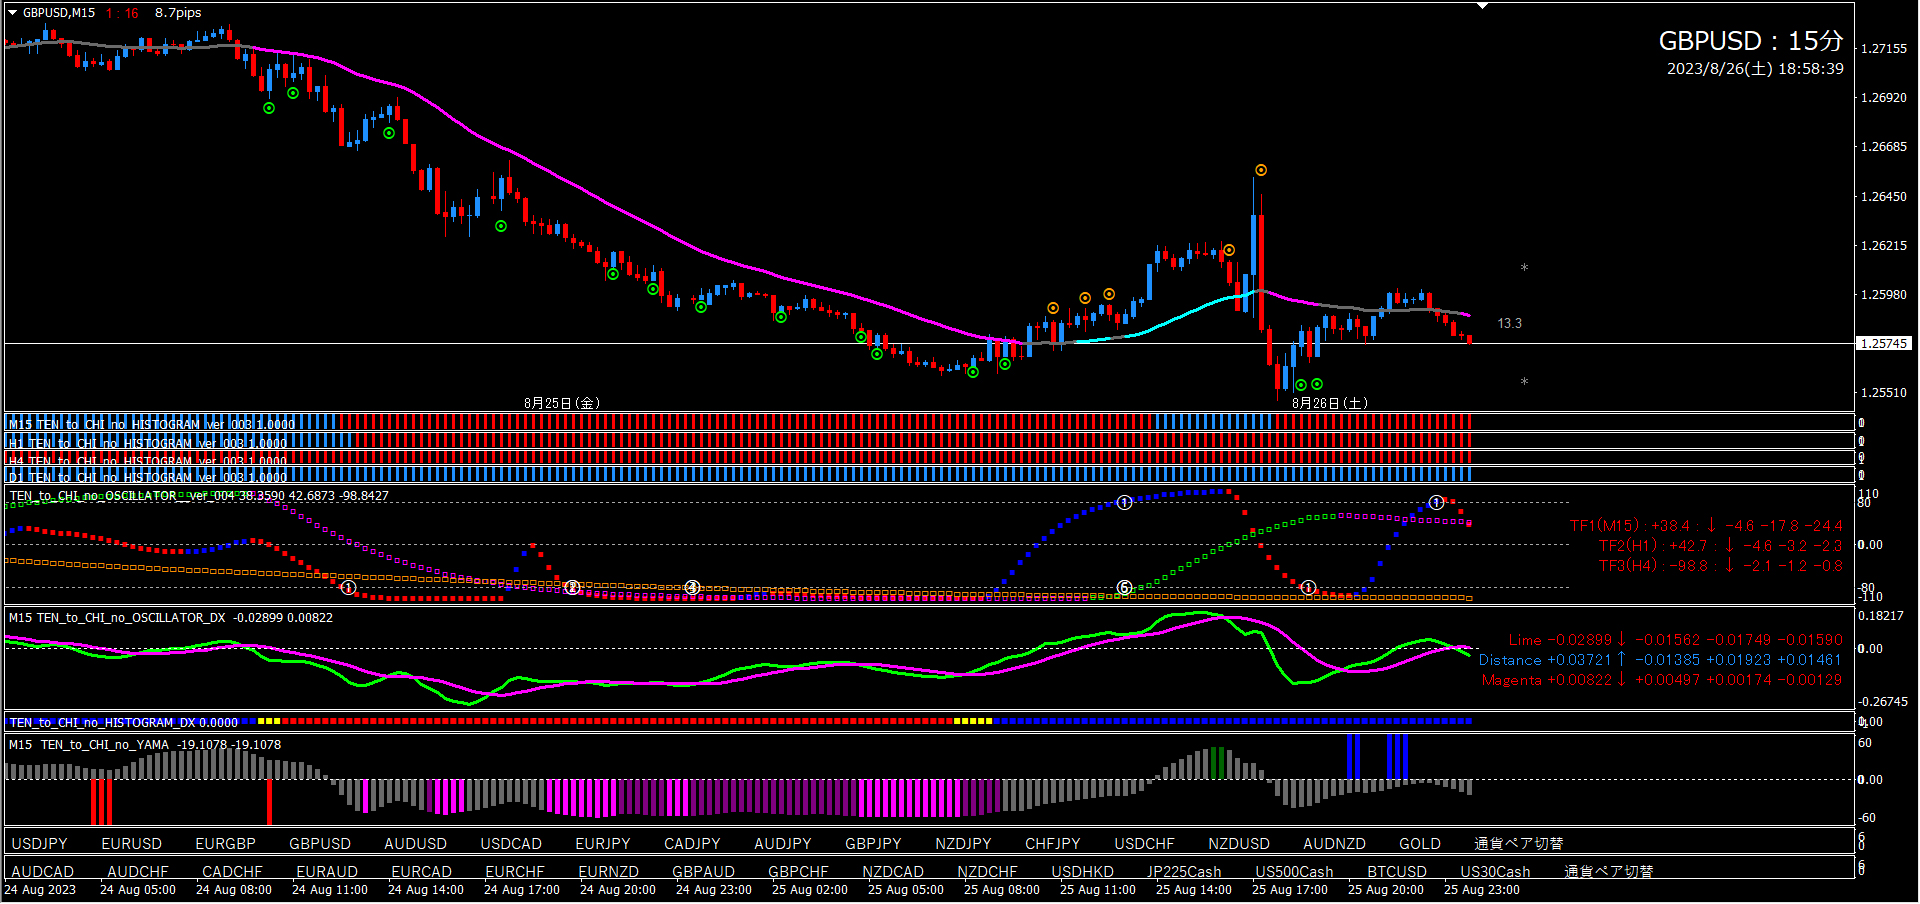
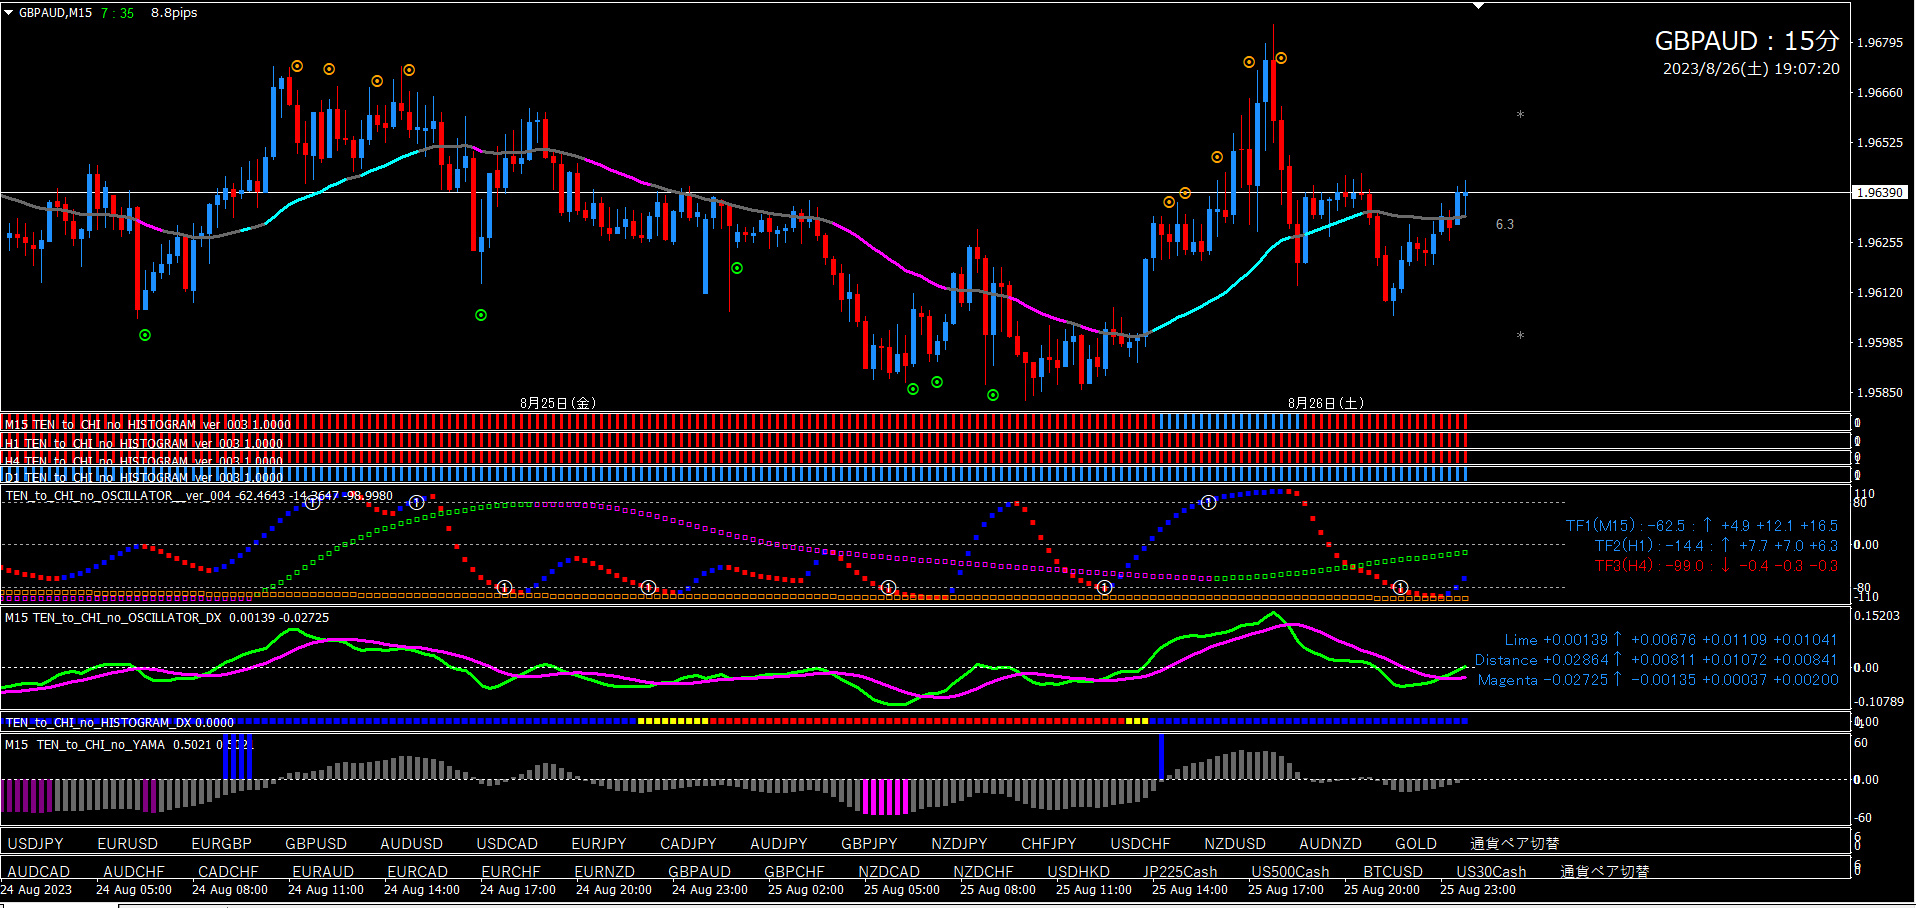
■ 15-minute chart (entry trigger)
Since we have a bearish outlook on the 4-hour chart, we will target only short entries on the 15-minute chart.
Oscillator TF2 has already started descending. Oscillator DX has just crossed downward, so technically this is a good stage to short. However, because of the gap up, it is wise to wait and observe. The future scenarios are short-entry signals, valley signals,Abu-san Signal, and waiting for triggers.
■ Ten to Chi no EA (15-minute chart usage)
As with EURJPY above,

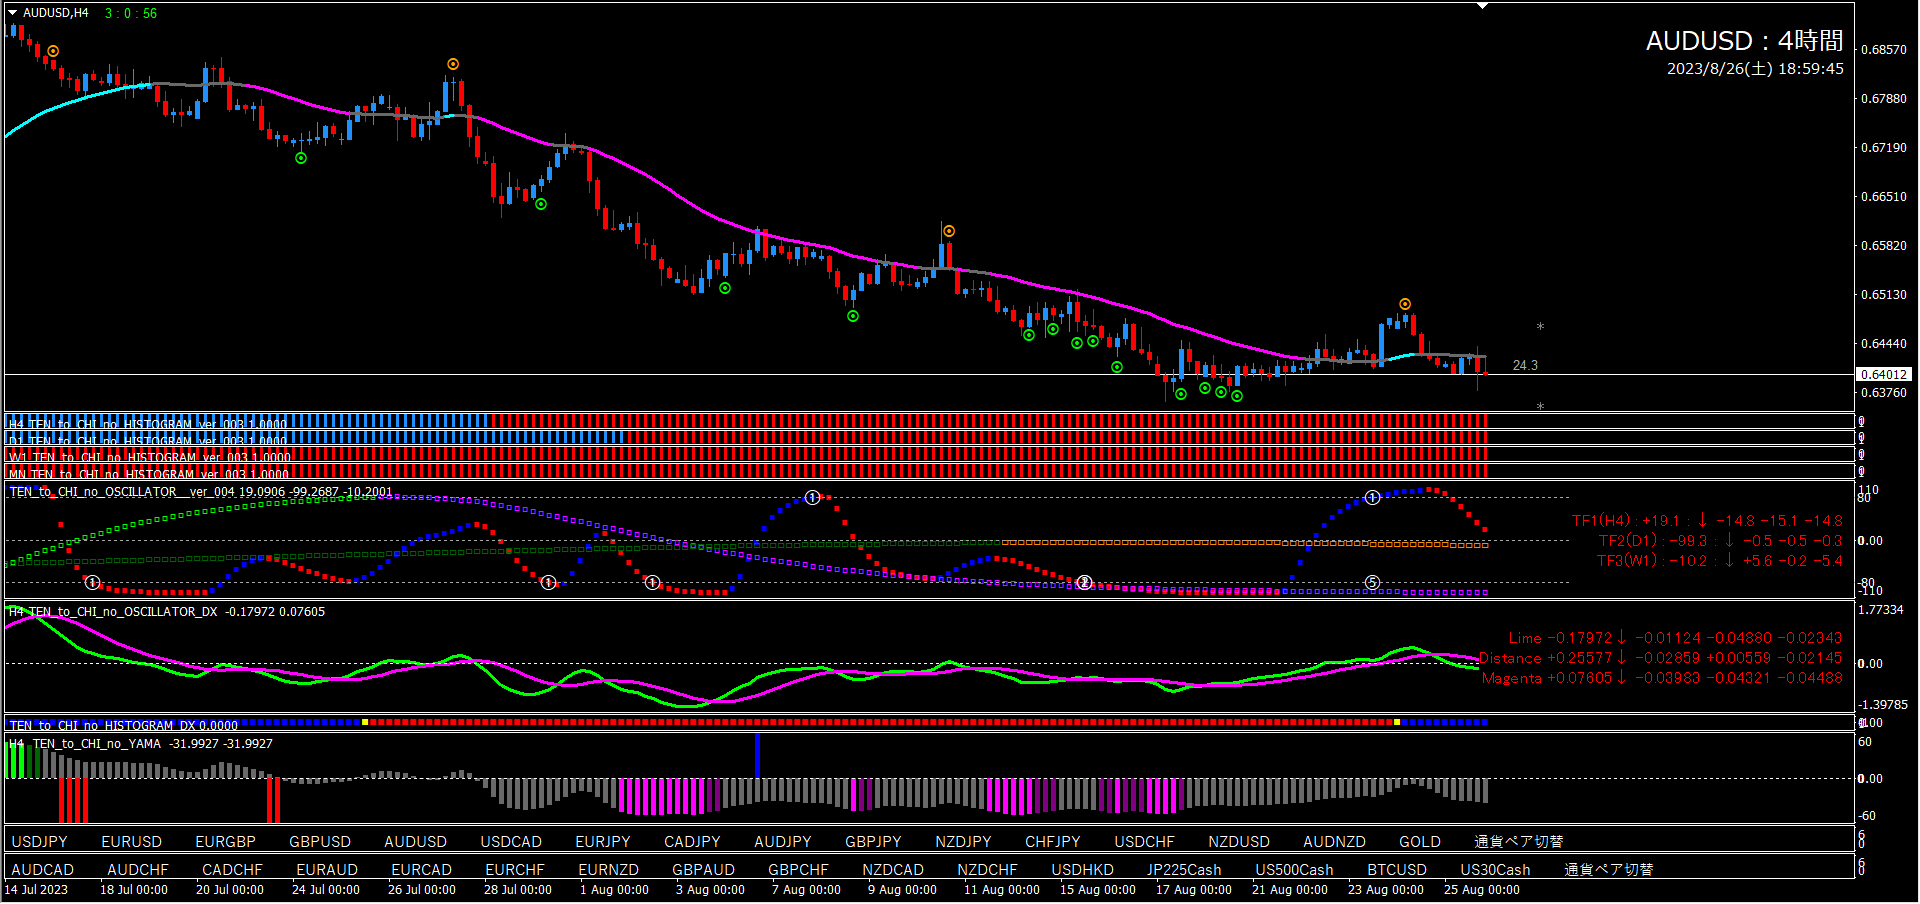
■ 4-hour chart (environmental recognition)
A very good shape.
Long entry signal dot is present; Oscillator TF2 is rising; TF1 has reached 80; Oscillator DX shows an rising cross. Although the histogram and DX are red, there is enough basis to deem a bullish outlook. If a short entry signal appears, the bullish outlook will be terminated for now.
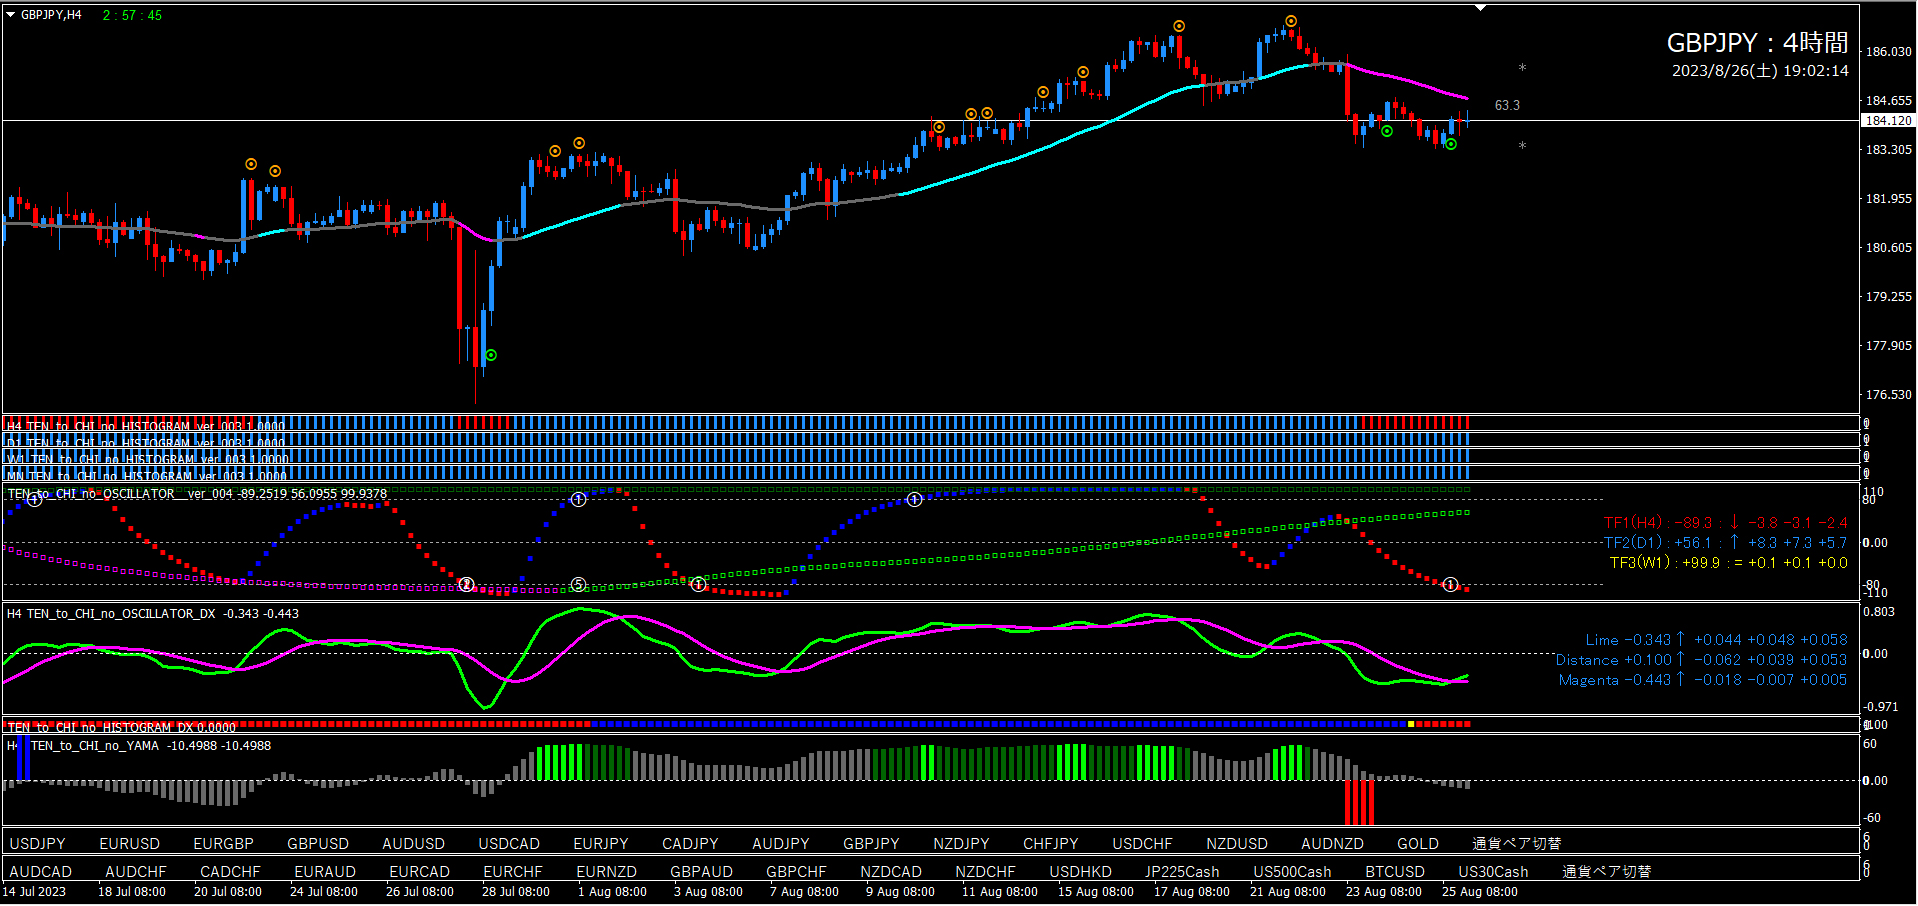
■ 15-minute chart (entry trigger)
Since we have a bullish outlook on the 4-hour chart, we will target long entries on the 15-minute chart.
Oscillator TF2 is already rising, so the future scenario is to wait for a long entry dot signal or valley signal, Abuシグ (Abu Signal), Oscillator DX rising cross, etc. If possible, draw TF1 toward around -80 to strengthen the case further.Abu Signal is also acceptable.
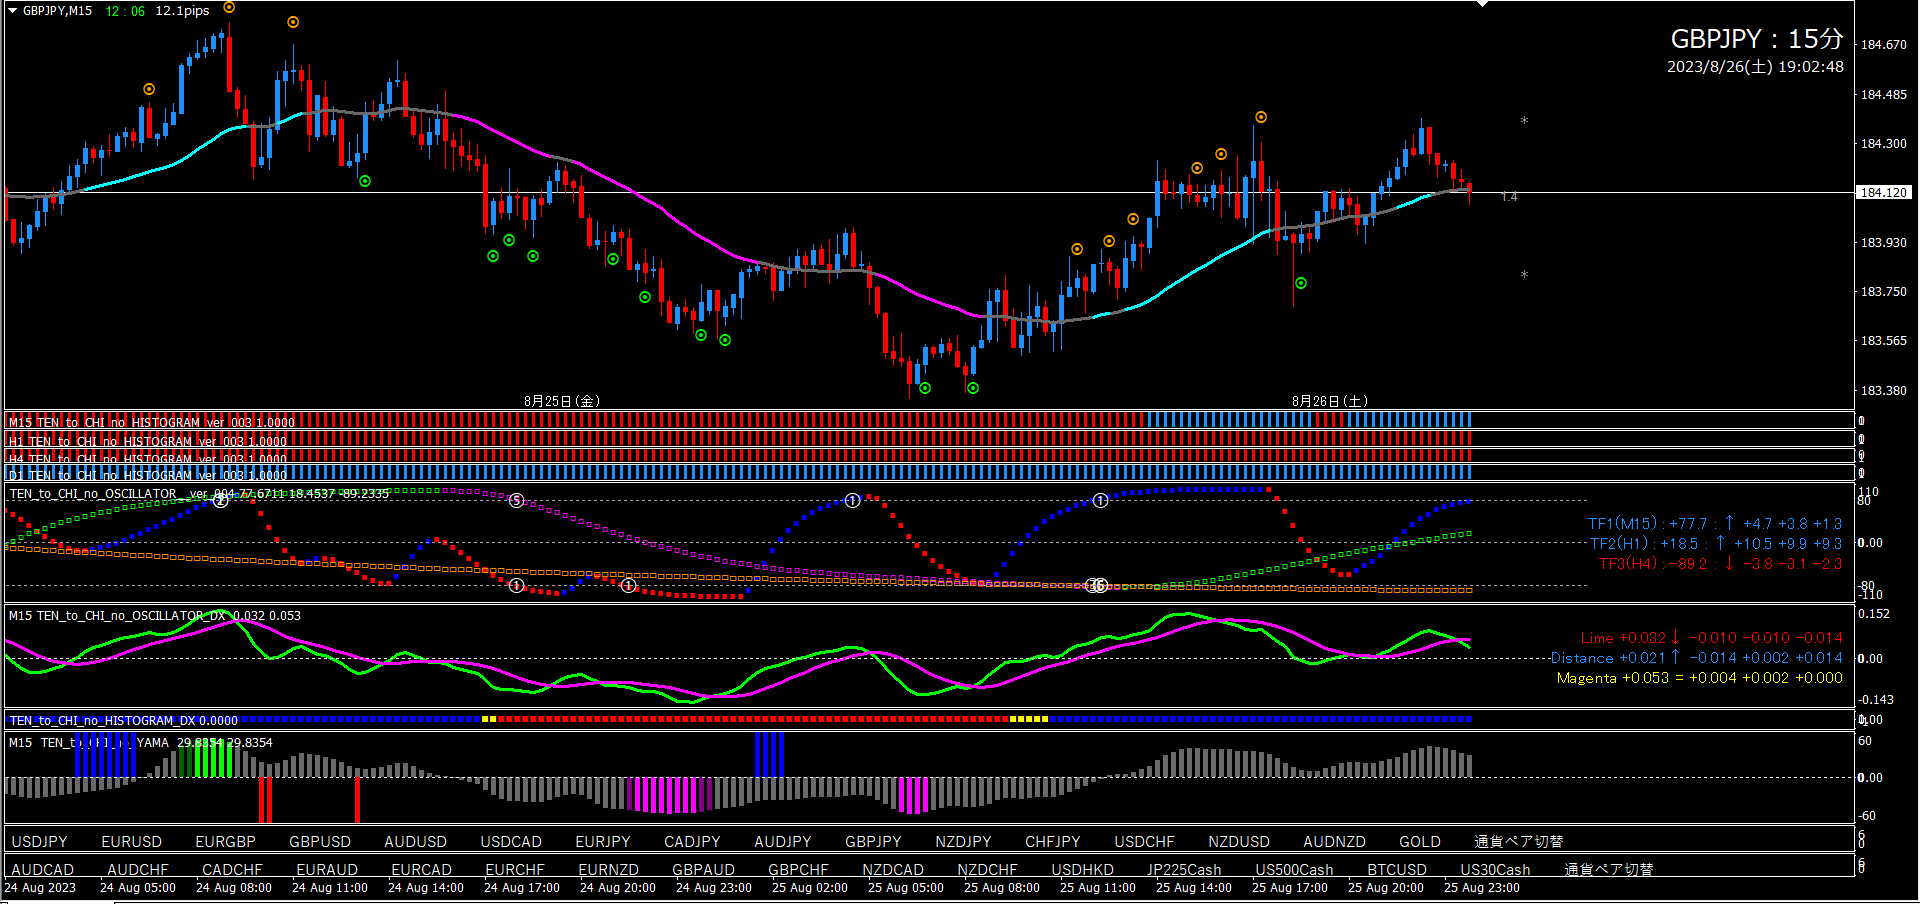
■ Ten to Chi no EA (15-minute chart usage)
Oscillator TF2 is already rising, so set EA Patterns ① and ④. Refer to the EURJPY section for criteria on which to use.

■ 4-hour chart (environmental recognition)
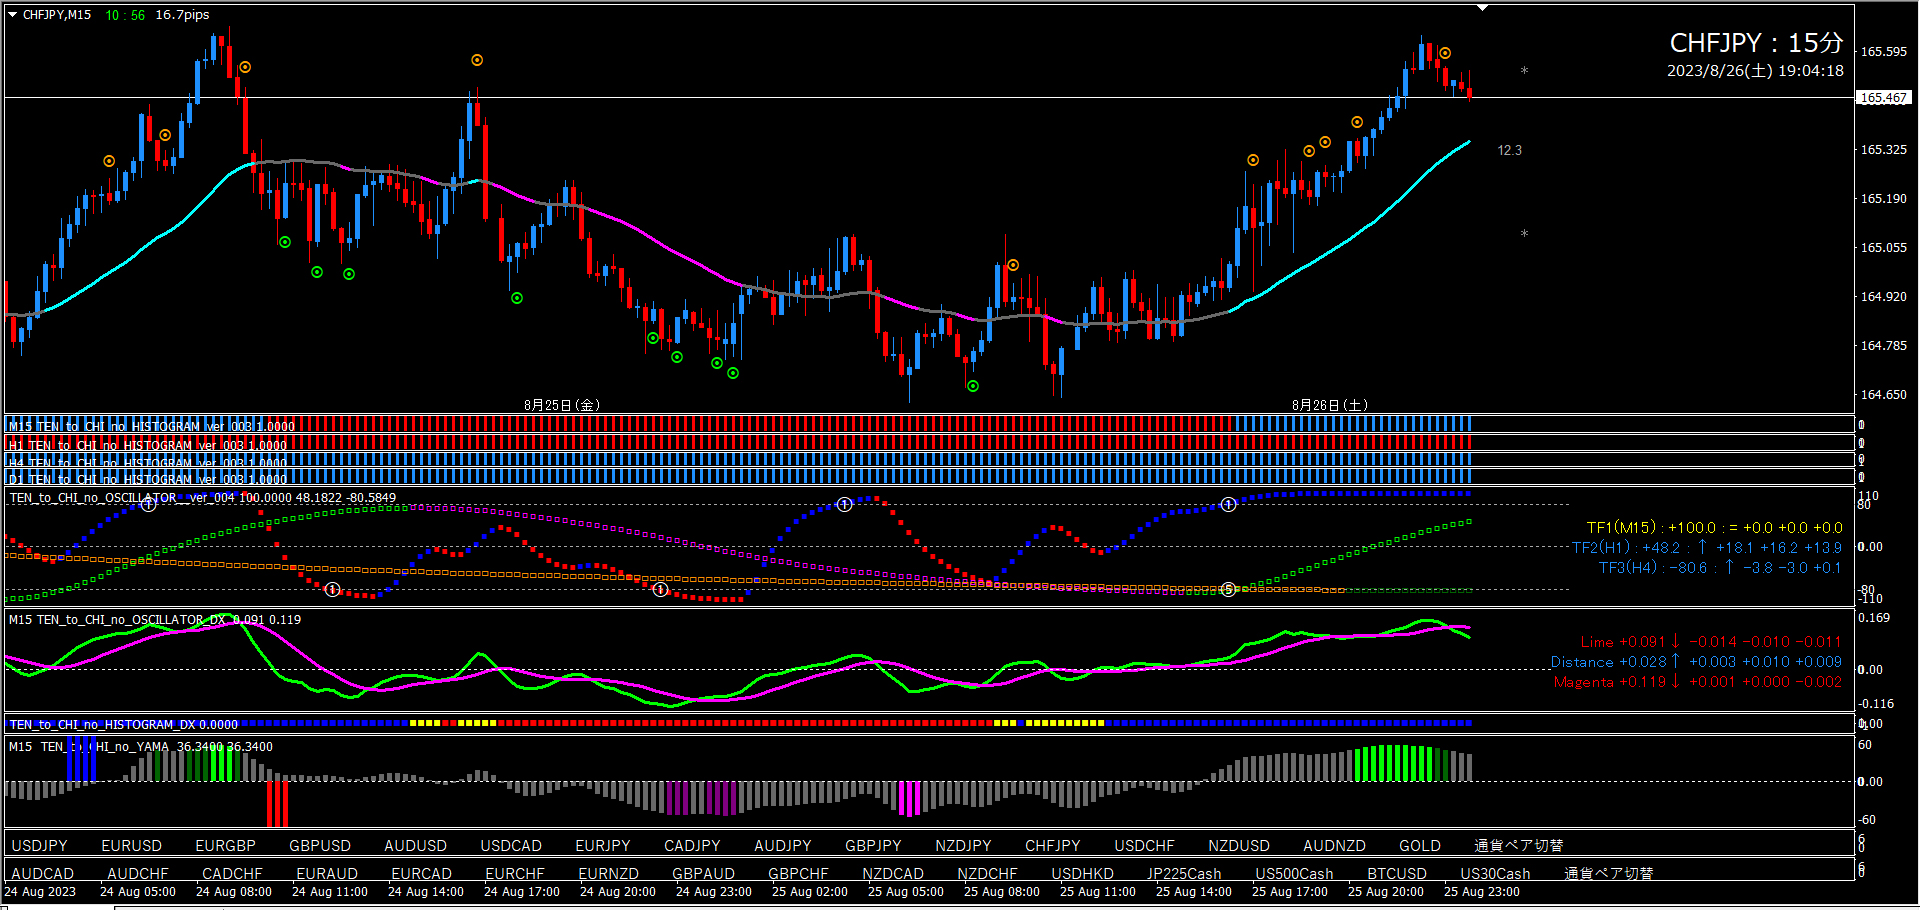
CHF/JPY looks like a good shape similar to USDJPY.
Oscillator signal ⑤ is lit. Oscillator DX is also rising and crossed upward. The current price is near the line, so there is still a chance for a short signal to appear. Short of a point signal has appeared recently as well. I consider the bullish outlook still in effect. If a short signal appears, the bullish outlook ends temporarily.
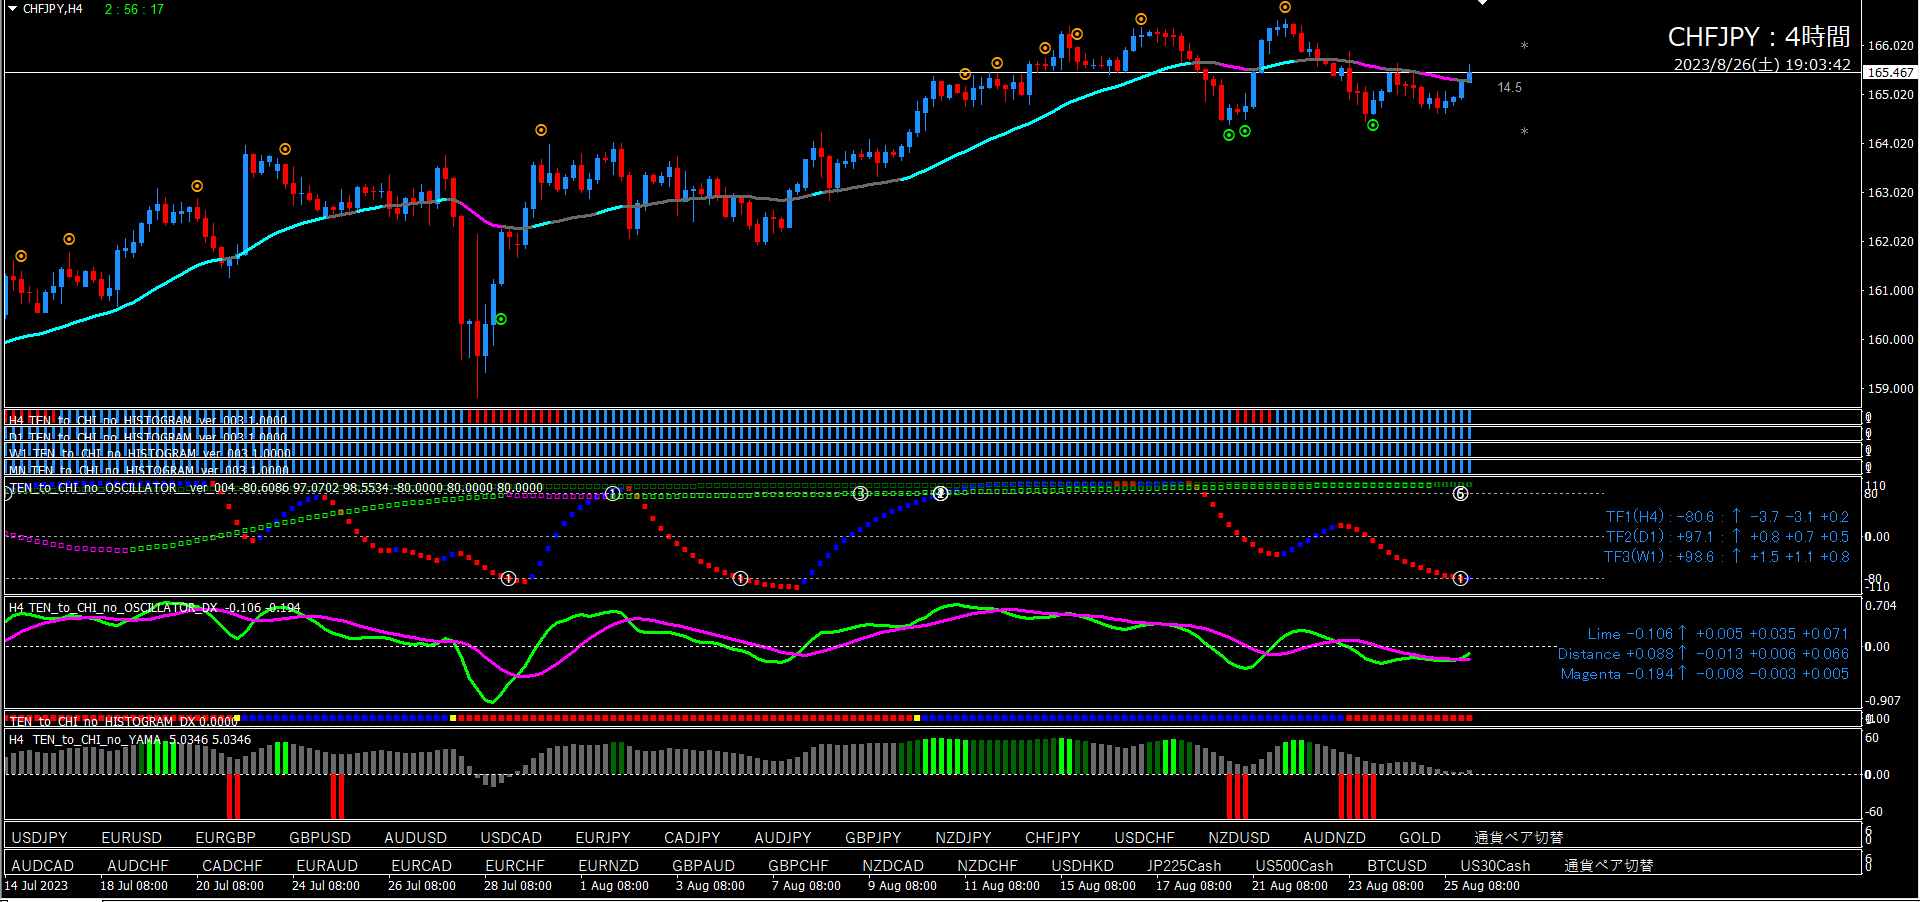
■ 15-minute chart (entry trigger)■ 15-minute chart (entry trigger)
Since we are bullish on the 4-hour chart, we will target long entries only.Since we have a bullish view from the 4-hour chart, we will target long entries only.
Oscillator TF2 is already rising. The future scenario is that long entry signals and valley signals will appear, along with Abuシグ, and Oscillator DX rising cross. If possible, draw Oscillator TF1 toward around -80 to strengthen the case further.Oscillator TF2 has already started rising. From the current price, it may be some time before a short-entry signal appears. The future scenario is to wait for a long valley signal and Oscillator DX rising cross as the quickest route to a long entry.Oscillator TF2 is already rising. Based on the current price, it may take some time before a short-entry signal appears. The short-term scenario is to wait for long valley signals and Oscillator DX rising cross as the fastest route.Abu-san SignalAbu-san SignalAbu-san Signal is also acceptable. is also acceptable. is also acceptable.
One potential risk is the position of Oscillator DX. If possible, when rising cross occurs, the two lines of Oscillator DX should be below the zero line.An uncertainty is the position of Oscillator DX. Ideally, when an upward cross occurs, the two lines of Oscillator DX should be below the zero line.A potential risk is the position of Oscillator DX. Ideally, when rising cross occurs, the two lines of Oscillator DX should be below the zero line.
■ Ten to Chi no EA (15-minute chart usage)Since Oscillator TF2 is already rising, set EA Patterns ①④⑤. Refer to the EURJPY section for criteria on which to use.⑥ USDCHF■ 4-hour chart (environmental recognition)We just saw a long-entry signal appear. Oscillator signal ⑤ is continuing, Oscillator DX has risen to a cross, and the outlook is bullish for now.■ 15-minute chart (entry trigger)Since we have a bullish outlook on the 4-hour chart, we will target long entries only.Oscillator TF2 has already started rising. From the current price, it may be some time before a short-entry signal appears. The future scenario is to wait for a long valley signal and Oscillator DX rising cross as the quickest route to a long entry.Abu-san Signal is also acceptable.An uncertainty is the position of Oscillator DX. Ideally, when an upward cross occurs, the two lines of Oscillator DX should be below the zero line.■ Ten to Chi no EA (15-minute chart usage)Since Oscillator TF2 is already rising, set EA Patterns ①④⑤. Refer to the EURJPY section for criteria on which to use.⑥ USDCHF■ 4-hour chart (environmental recognition)Just as USDJPY, it looks good.Oscillator signal ⑤ lights up. Oscillator DX also rising cross. The current price near the line suggests there is still a chance for a short signal until it appears. There is also a recent long entry signal. Continue bullish outlook. If a short signal appears, the bullish outlook ends for now.■ 15-minute chart (entry trigger)Since we have a bullish view from the 4-hour chart, we will target long entries only.Oscillator TF2 is already rising. Based on the current price, it may take some time before a short-entry signal appears. The short-term scenario is to wait for long valley signals and Oscillator DX rising cross as the fastest route.Abu-san Signal is also acceptable.A potential risk is the position of Oscillator DX. Ideally, when rising cross occurs, the two lines of Oscillator DX should be below the zero line.■ Ten to Chi no EA (15-minute chart usage)Since Oscillator TF2 is already rising, set EA Patterns ①④⑤. Refer to the EURJPY section for criteria on which to use.The above concludes.I hope this has been helpful to everyone.■ Ten to Chi no EA (15-minute chart usage)Since Oscillator TF2 is already rising, set EA Patterns ①④⑤. Refer to the EURJPY section for criteria on which to use.⑥ USDCHF■ 4-hour chart (environmental recognition)Just as USDJPY, it looks good.Oscillator signal ⑤ lights up. Oscillator DX also rising cross. The current price near the line suggests there is still a chance for a short signal until it appears. There is also a recent long entry signal. Continue bullish outlook. If a short signal appears, the bullish outlook ends for now.■ 15-minute chart (entry trigger)Since we have a bullish view from the 4-hour chart, we will target long entries only.Oscillator TF2 is already rising. Based on the current price, it may take some time before a short-entry signal appears. The short-term scenario is to wait for long valley signals and Oscillator DX rising cross as the fastest route.Abu-san Signal is also acceptable.A potential risk is the position of Oscillator DX. Ideally, when rising cross occurs, the two lines of Oscillator DX should be below the zero line.■ Ten to Chi no EA (15-minute chart usage)Since Oscillator TF2 is already rising, set EA Patterns ①④⑤. Refer to the EURJPY section for criteria on which to use.The above concludes.I hope this has been helpful to everyone.■ Ten to Chi no EA (15-minute chart usage)
Since Oscillator TF2 is already rising, set EA Patterns ①④⑤. Refer to the EURJPY section for criteria on which to use.Since Oscillator TF2 is already rising, set EA Patterns ①④⑤. Refer to the EURJPY section for criteria on which to use.Since Oscillator TF2 is already rising, set EA Patterns ①④⑤. Refer to the EURJPY section for criteria on which to use.

■ 4-hour chart (environmental recognition)■ 4-hour chart (environmental recognition)
We just saw a long-entry signal appear. Oscillator signal ⑤ is continuing, Oscillator DX has risen to a cross, and the outlook is bullish for now.Just as USDJPY, it looks good.
■ 15-minute chart (entry trigger)
Since we have a bullish outlook on the 4-hour chart, we will target long entries only.

I hope this has been helpful to everyone.
