

Utilization of "Visualization Indicator" (Episode 109)
Usage of the “Visualization Indicator” (its109)
1. Further evolve the “28 Currency Pairs List Indicator” into an indicator
“8CP Visualization Indicator”to drawEURAUD.
There are versions of the “8 CP Visualization Indicator” for Oceania, London, New York, and AnyCP. This time, the Oceania version was used.
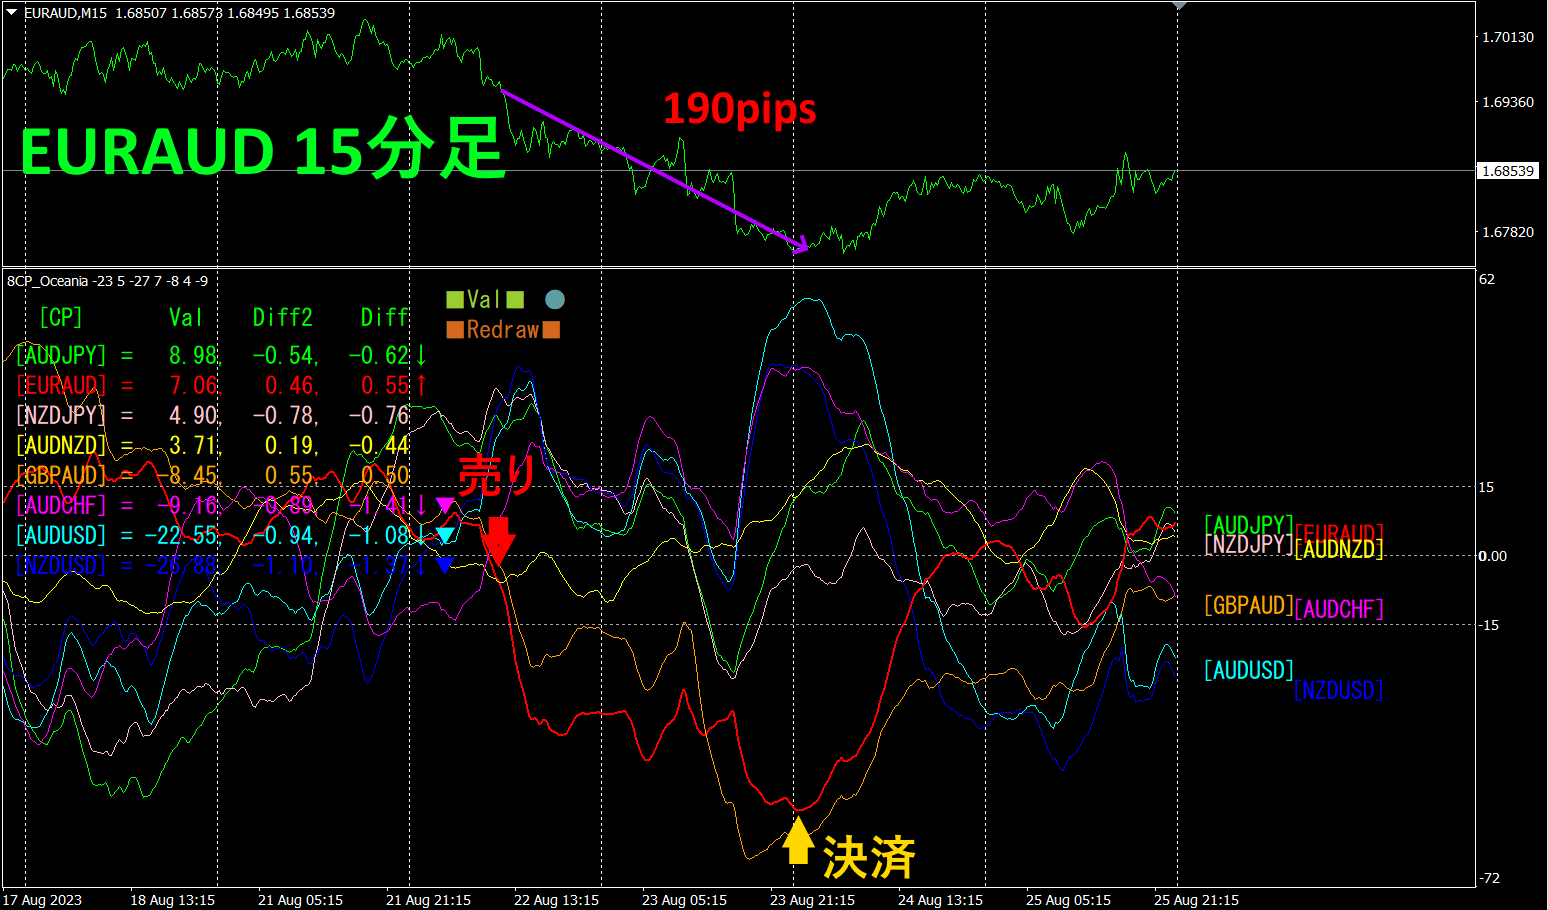
The upper half is the EURAUD 15-minute chart. The lower half is from the “8 CP Visualization Indicator.” The red thick-line graph corresponds to EURAUD.EURAUDの15分足チャートです。下半分は、「8CP見える化インジケータ」によるものです。赤色太線のグラフがEURAUDに相当します。
On Tuesday, EURAUD fell below other chart groups, so I entered a sell position. On Thursday, the graph hit a bottom and reversed, so I closed the position. From Tuesday to Thursday, there was a steady downtrend, making a profit of aboutapproximately190 pips. profit.
2. Best SelectTry the Indicator
The diagram below is a screenshot taken onAugust23,2023 EURJPY,18:09 (JST)
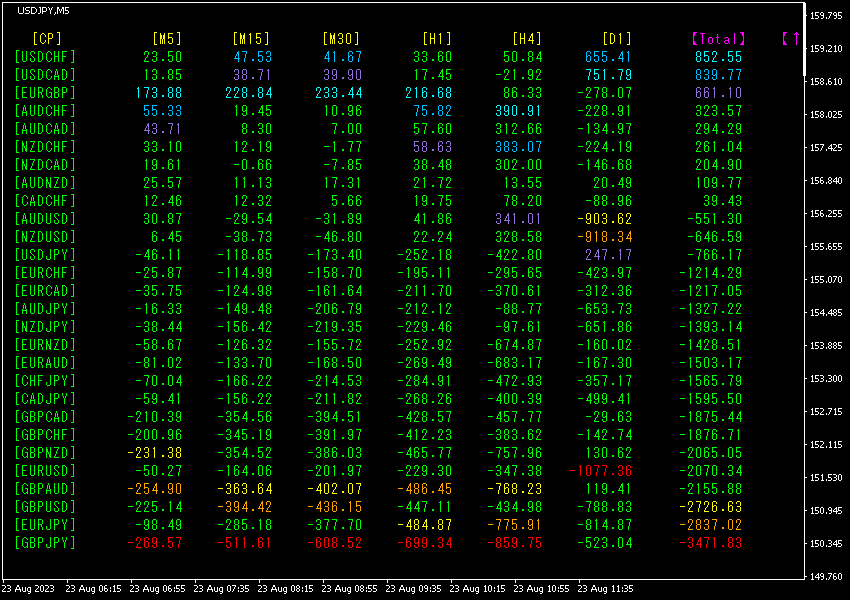
Total numbers are sorted in descending order. The bottom-most row’sGBPJPY shows red color on all timeframes except [D1], and theTotal value is-3471.83, a large negative figure.GBPJPY indicates a significant downward trend.
Now, let’s look at the chart forGBPJPY.
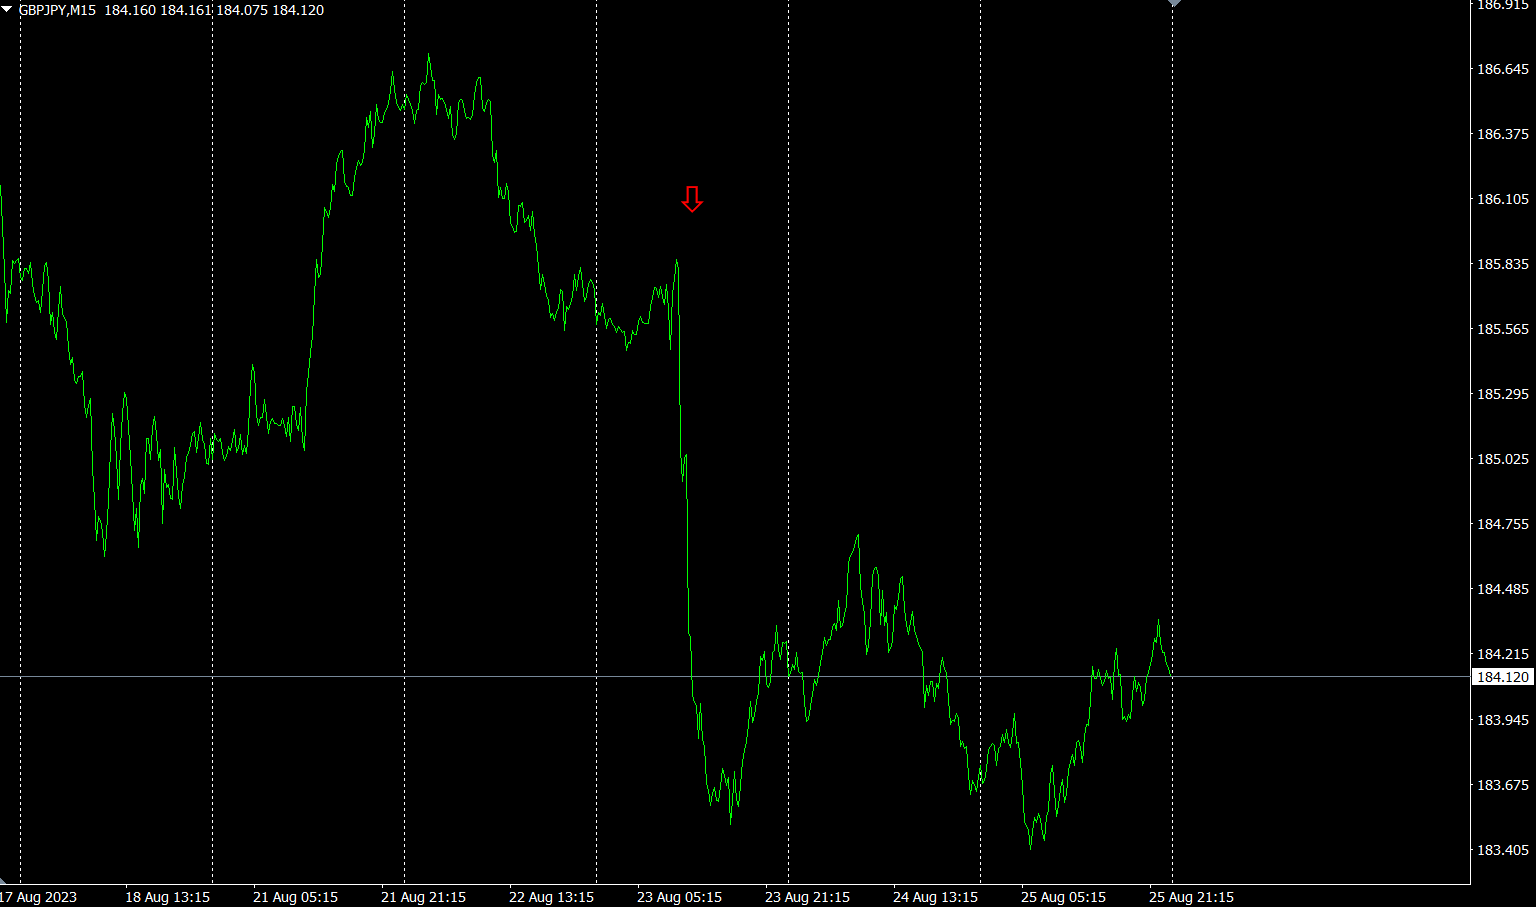
The red arrows indicate the location where the screenshot was taken. It is partway through a large downward trend with a right-shoulder decline. The decline continues after the arrow as well.
“28 currency pairs Best Select
“28 currency pairs Best Select Indicator”
https://www.gogojungle.co.jp/tools/indicators/35128

3. Since May of the year before last, what happened to EURJPY?
From May 2021, movements have been tracked.
To see the overall trend, a roughly 3 weeks’ worth of data is drawn on a 30-minute chart.
Previously I wrote the following.
EUR is positioned aboveJPY and slightly leaning downward, whileJPY has moved upward strongly. In the future,EURJPY is expected to decline.
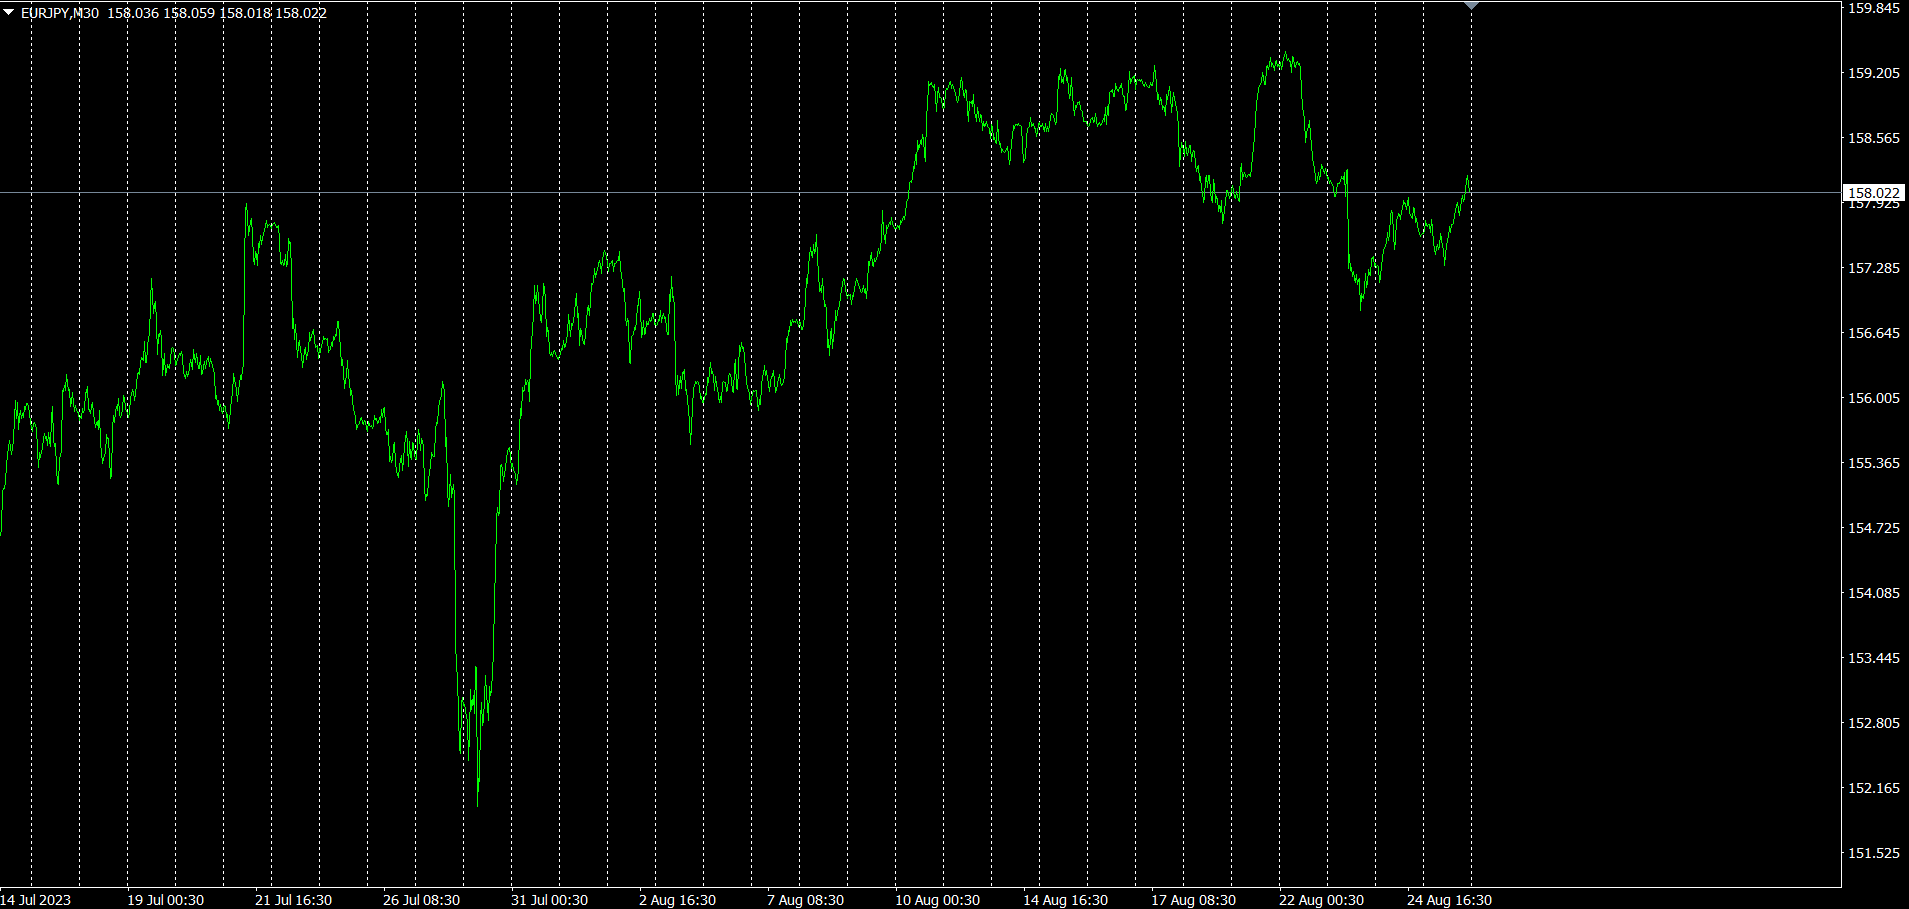
Monday rose, but from Tuesday onward it has trended downward.
4Timeframe currency strength chart.
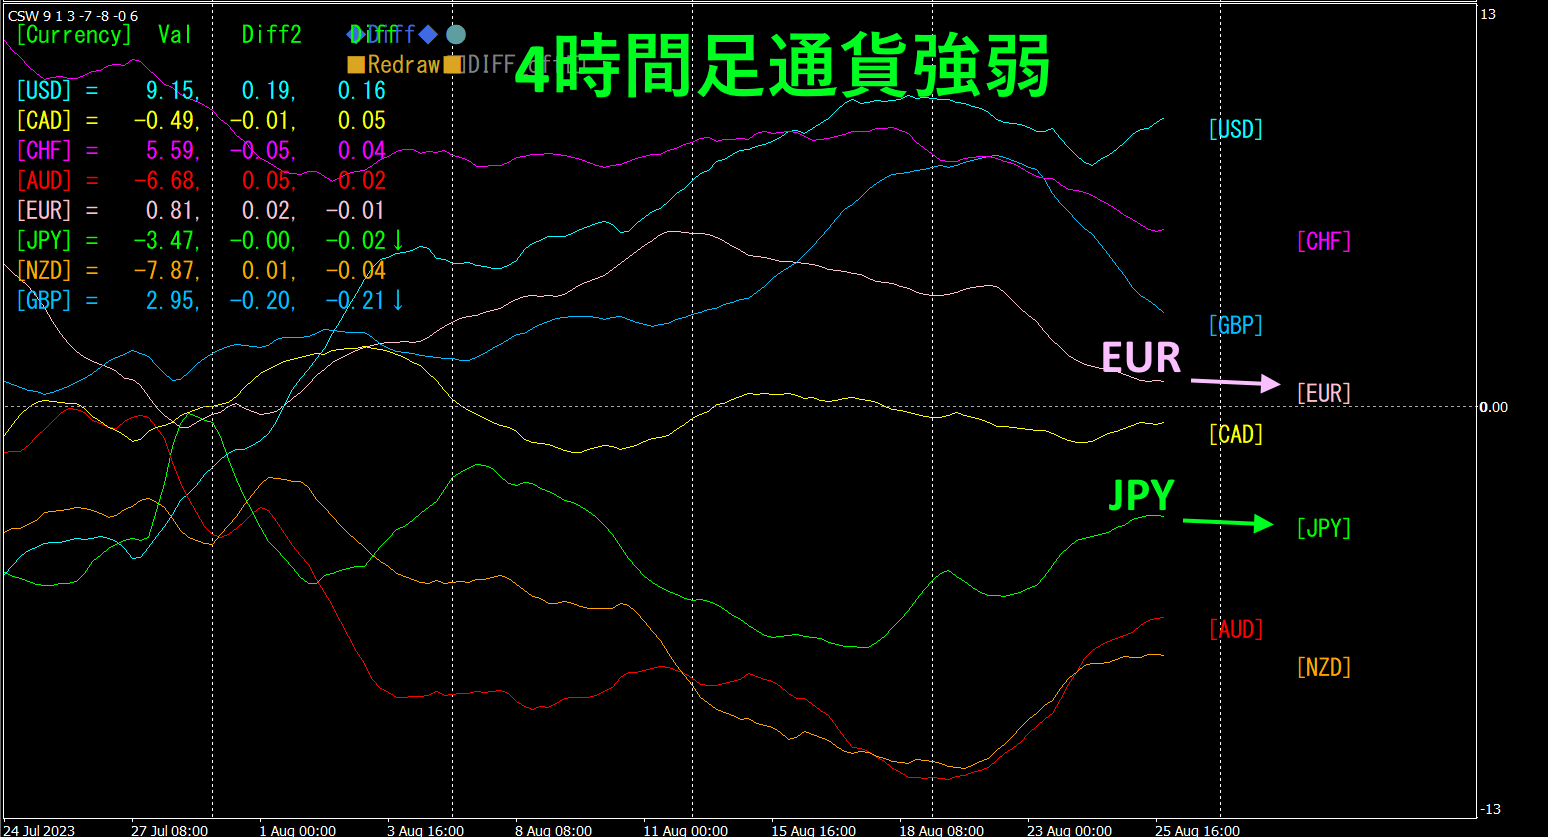
Pink isEUR, green is.JPY is aboveJPY, and both are slightly downward with no clear direction. The future move of will likely be range-bound for a while.
4. From all currency pairs, locate a bottom and establish a trend strategy (targetingUSDCHF).
2505“Bottom Search” Indicatorを使って、次のターゲットとなる通貨ペアとしてUSDCHFを探し出しました。
のチャートを見てみましょう。
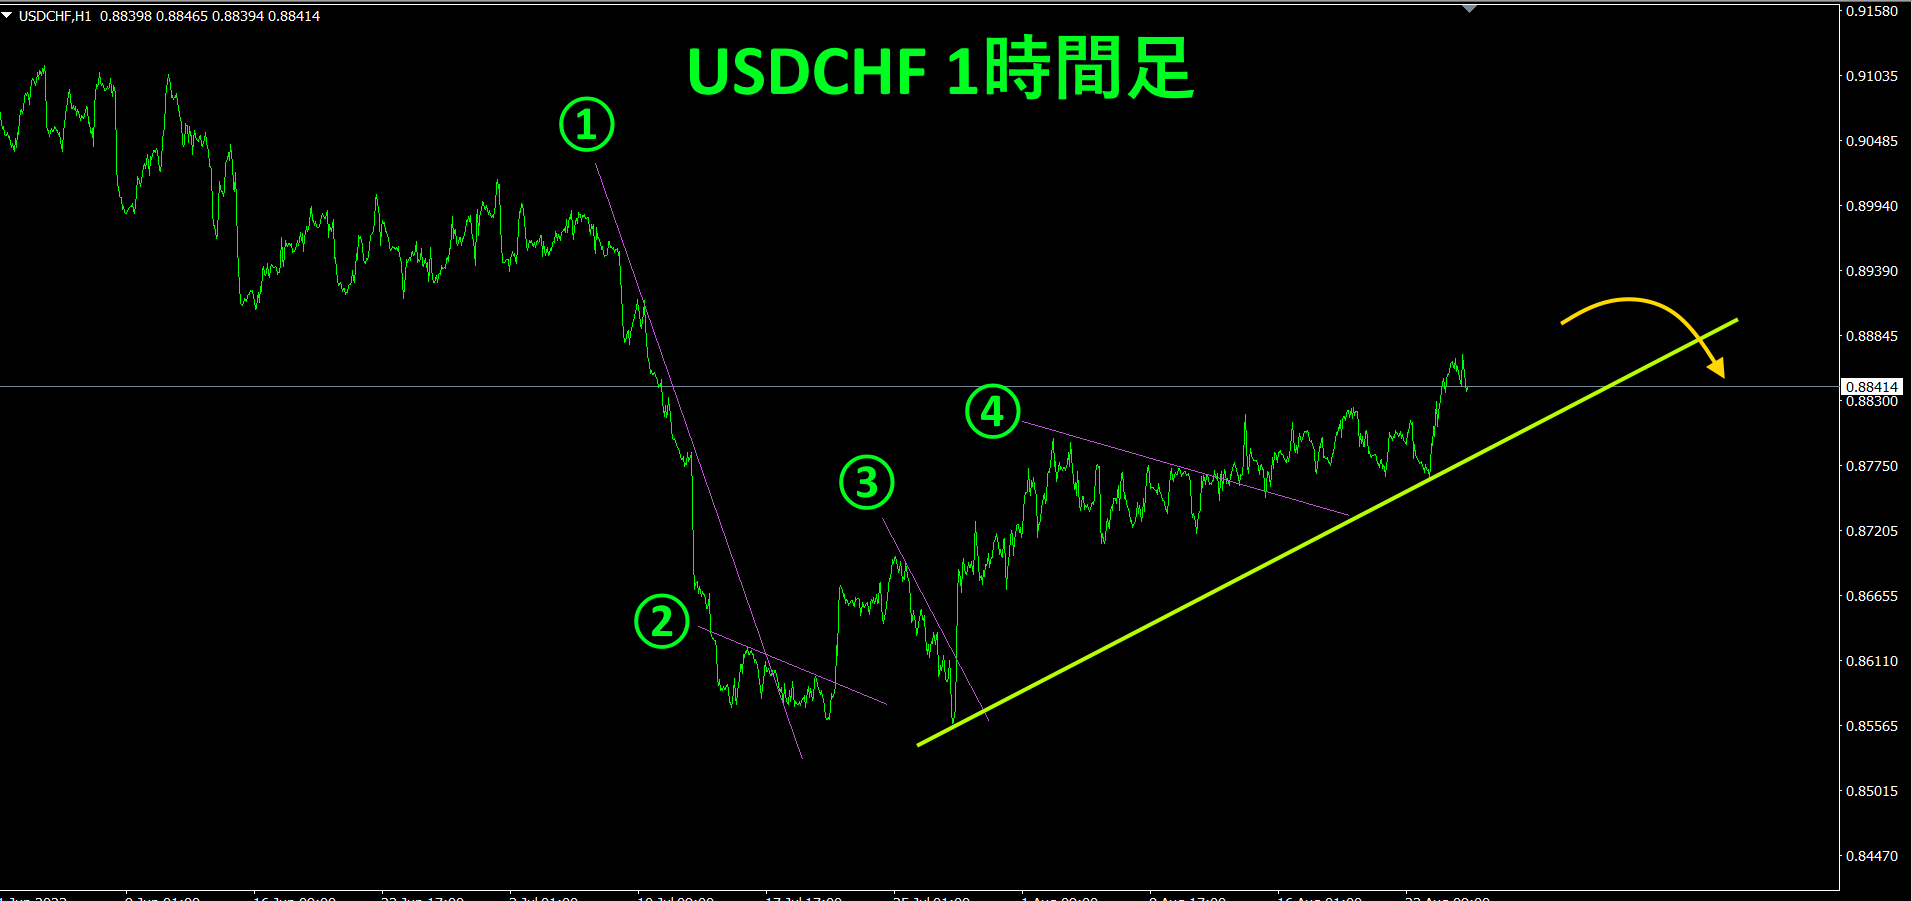
USDCHFは、「大底から反転」のフェーズなので、①~④のように、切り下げラインを引いておき、これを上抜けて来たら買いでエントリーします。④の切り下げラインをレートが上抜けしたので、現在は買いポジションを保有している状態です。今後、黄緑色の上昇トレンドラインを割ってきたら、決済するだけです。
以後は、これを繰り返すだけの、「シンプルで分かり易いトレード」です。現在のレートは、0.88414です。日足チャートで見て下落の始まった0.8980付近までは戻すと考えられますので、まだまだ150pips程の戻し幅があることになります。これを「Trend Line EX」を使って、ただひたすら取りに行くだけです。
「Trend Line EX」があれば、斜め切り下げラインを引いておき、これを上抜けたら自動で買い、切り上げラインを割ったら自動で決済という放置型のトレードができます。
※「Trend Line EX」

https://www.gogojungle.co.jp/tools/indicators/42257
“8C Currency Strength Visualization Indicator” interested parties can refer to the following page.
MT4 version https://www.gogojungle.co.jp/tools/indicators/39150
MT5 version https://www.gogojungle.co.jp/tools/indicators/39159
【My listed products】


