
【Q19】How to insert RSI?
Q19. How to insert RSI?
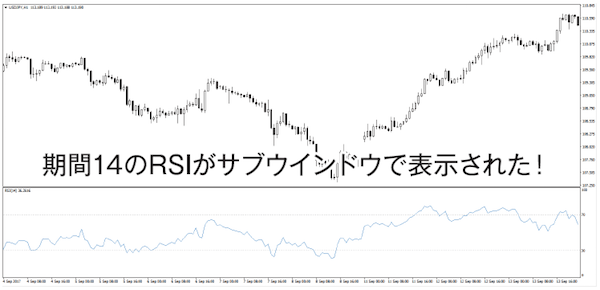
A19. Select “Relative Strength Index” and set the parameters
“Insert” → “Indicators” → “Oscillators” → “Relative Strength Index”
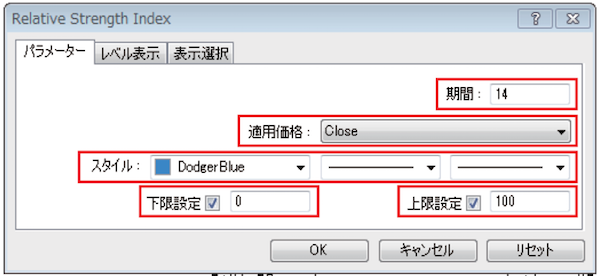
Period: enter the period for calculating RSI
Applied price: choose from seven options such as “Close” close price, “Open” open price, etc.
Style: choose RSI color, line shape (solid or dashed), and line thickness
Lower limit: the lower bound in the sub-window. For oscillators that range from 0 to 100%, it is common to check this
Upper limit: the upper bound in the sub-window
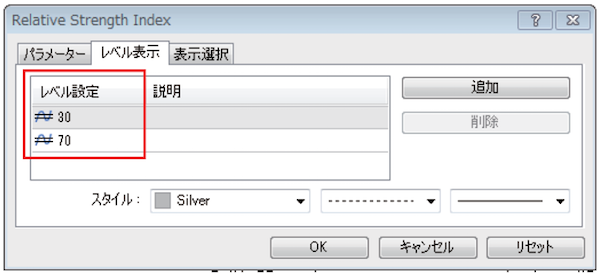
In Level Settings, you can set levels to draw auxiliary lines. If you want to change them, click the number and re-enter
The oscillator is displayed in a separate window, not in the candlestick window
Solve MT4 questions with the Q&A list (43 items)!
<Introduction>
- 01. Table of Contents
- 02. Not only chart analysis: what MT4 can do
- 03. Basic knowledge before/after MT4 installation and initial setup to start analysis
<Q&A>
- Q1. How do I open a chart?
- Q2. The chart isn’t a candlestick chart
- Q3. How do I switch time frames?
- Q4. How do I go back in time on a chart?
- Q5. The chart moves by itself
- Q6. Can I view multiple charts?
- Q7. It occasionally makes sounds. How can I stop it?
- Q8. How to change chart colors?
- Q9. What are the basic colors?
- Q10. Which items’ colors can I change?
- Q11. I want to display multiple charts side by side
- Q12. How many charts can I arrange?
- Q13. How to enlarge one of the arranged charts?
- Q14. How to insert technical indicators into a chart?
- Q15. How to insert moving averages?
- Q16. How many moving averages can be displayed?
- Q17. How to delete a technical indicator?
- Q18. How to insert Bollinger Bands?
- Q19. How to insert RSI?
- Q20. How to enlarge the sub-window?
- Q21. How to delete a sub-window?
- Q22. How to insert Stochastic?
- Q23. How to display multiple oscillators?
- Q24. Isn’t it hard to read if there are too many sub-windows?
- Q25. How to save your own chart analysis environment?
- Q26. Can I save chart combinations?
- Q27. How to draw lines on a chart?
- Q28. How to move a drawn line?
- Q29. How to delete a line?
- Q30. Can I draw a short diagonal line?
- Q31. Can I draw a horizontal line at a round price?
- Q32. How to draw Fibonacci retracements
- Q33. How to draw shapes?
- Q34. How to draw arrows?
- Q35. Please tell me about automated trading
- Q36. How can I create an EA?
- Q37. Is MetaEditor the English version?
- Q38. How to run an EA?
- Q39. If you can’t program, can you still use EAs?
- Q40. How to use a custom indicator?
- Q41. What is a custom indicator?
- Q42. Where are custom indicators located?
- Q43. What’s the difference between MT5 and MT4?
Visit FX攻略.com official site too!!

“FX攻略.com” is a domestic monthly FX specialized information magazine founded in 2008 (monthly issue release on the 21st / [print] 750 yen [digital] 600 yen). It conveys the latest information while condensing the fundamentals of investing and the essence of FX on the pages. If you haven’t read it yet, please pick it up at bookstores nationwide! (Also available online)
■ FX攻略.com Official Site
http://fx-koryaku.com/
■ FX攻略.com Official Twitter
https://twitter.com/fx_koryaku_com
■ FX攻略.com Official Facebook
https://www.facebook.com/fxkoryaku/
FX攻略.com MT4 Feature

For those interested in MT4 but feel it looks difficult, this is FX攻略.com’s MT4 feature.
FX攻略.com editorial team has prepared a【MT4 Start Manual】to all applicants!!!
For details on how to obtain the manual, please check in the “MT4 Comprehensive Feature | Beginner’s guide to using MetaTrader 4 (MT4)” section.