

Utilization of the "Visualization Indicator" (Part 108)
Usage of "Visualization Indicator" (its108)
1. Advance and develop the "28 Currency Pairs List Indicator" into an indicator
"8 CP Visualization Indicator" for drawing GBP/AUD GBPAUD chart with
The "8 CP Visualization Indicator" includes Oceania version, London version, New York version, AnyCP version. This time, the Oceania version was used.
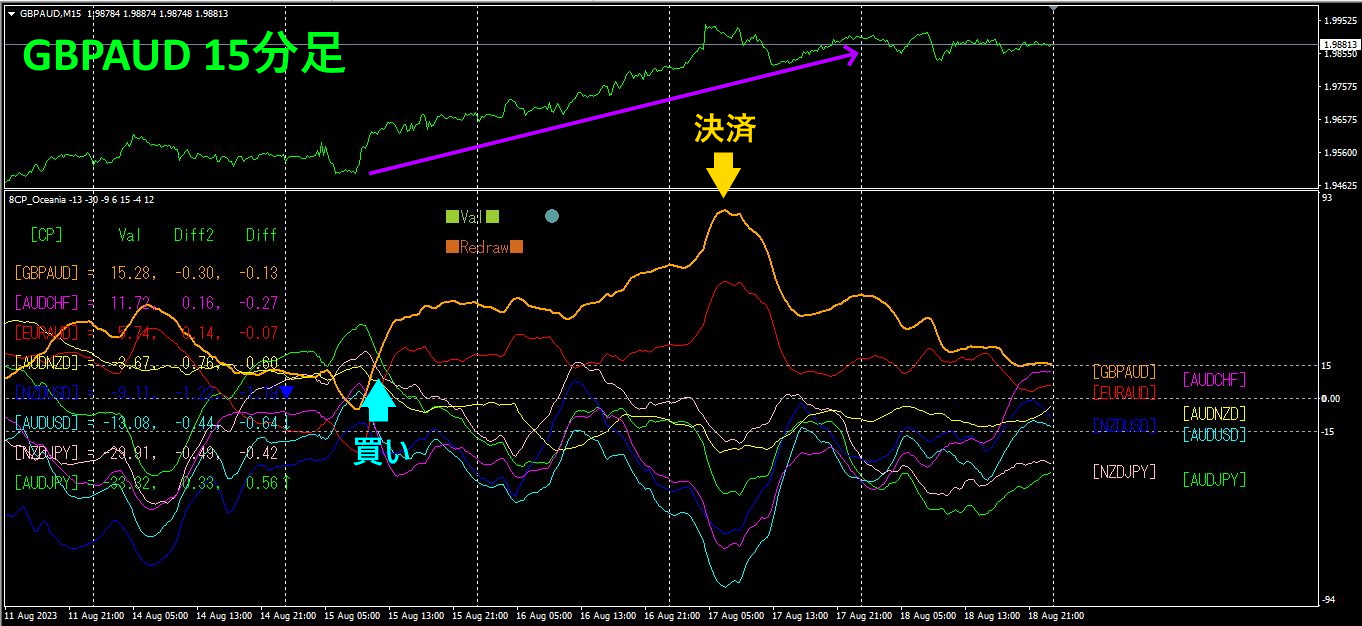
The top half is the 15-minute chart of GBPAUD. The bottom half is from the "8 CP Visualization Indicator." The orange bold line graph corresponds to GBPAUD.
On Tuesday, GBPAUD broke above the other chart groups, so I entered a long position. On Thursday, the graph peaked and reversed, so I closed the position. From Tuesday to Thursday, the trend was a steadily rising uptrend, so the profit of about310 pips was obtained.
2. Best Select Try the Indicator
The figure below is a screenshot from August, 17, 01:09 (JST).
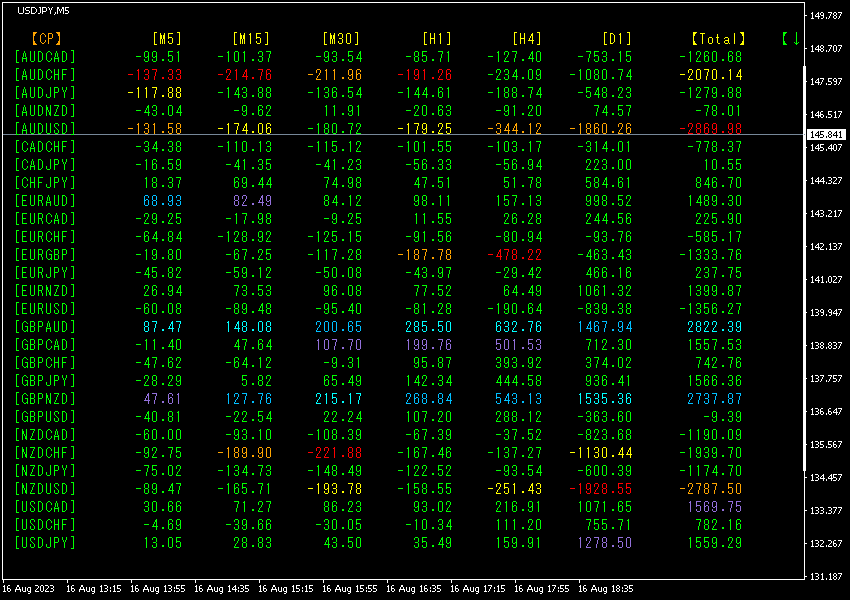
Currencies are sorted in ascending order by name. In the center, GBPAUD shows blue coloration across all timeframes, and the Total value is 2822.39, indicating a strong positive figure. GBPAUD indicates a strong upward trend.
Now, let us look at the GBPAUD chart.
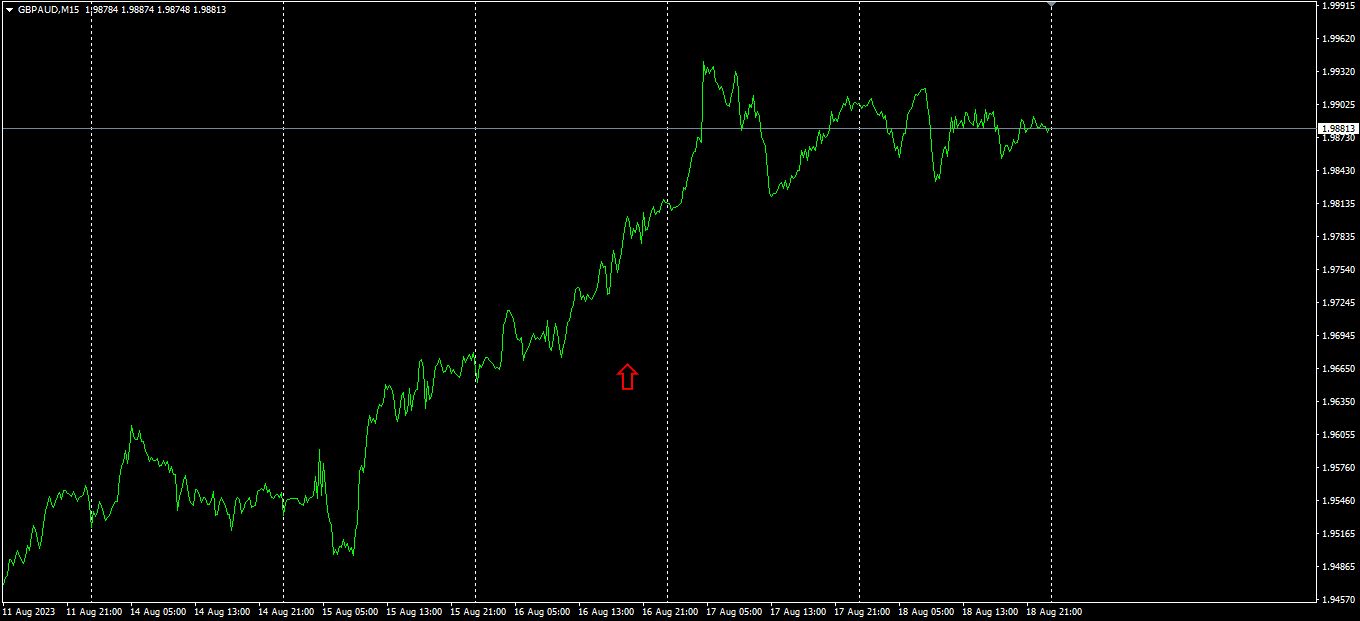
The red arrow marks the screenshot point. It is in the middle of a large upward trend with a rising right shoulder. The price continued to rise after the arrow as well. If you had bought here, you could have gained about140 pips of movement.
The "28 Currency Pairs Best Select Indicator" enables you to easily identify which currency among 28 pairs is currently exhibiting the strongest trend. It also indicates, with numbers and colors, whether you should trade now. It provides a quick snapshot of all currency pairs' movements.
The "28 Currency Pairs Best Select Indicator"Indicator .

https://www.gogojungle.co.jp/tools/indicators/35128
3. Since May of the year before last, how has EURJPY moved?
year 5 month EURJPY movement tracked.
To view the overall trend, I am drawing about 3 weeks of the latest 30-minute charts.
Previously, I wrote as follows.
EUR is positioned above JPY, slightly downward; while JPY is also downward, the angle of JPY is slightly more downward, so EURJPY is likely to trend higher in the future.
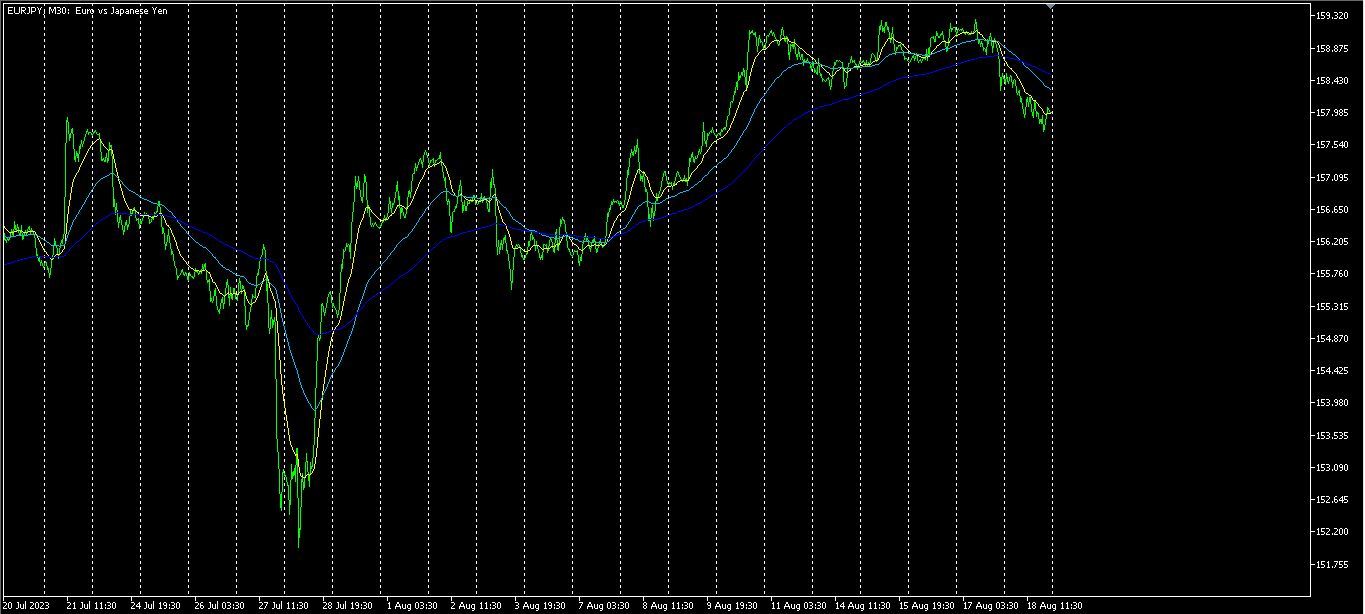
From Monday to Thursday, it moved slightly upward.
4 Hours currency strength chart.
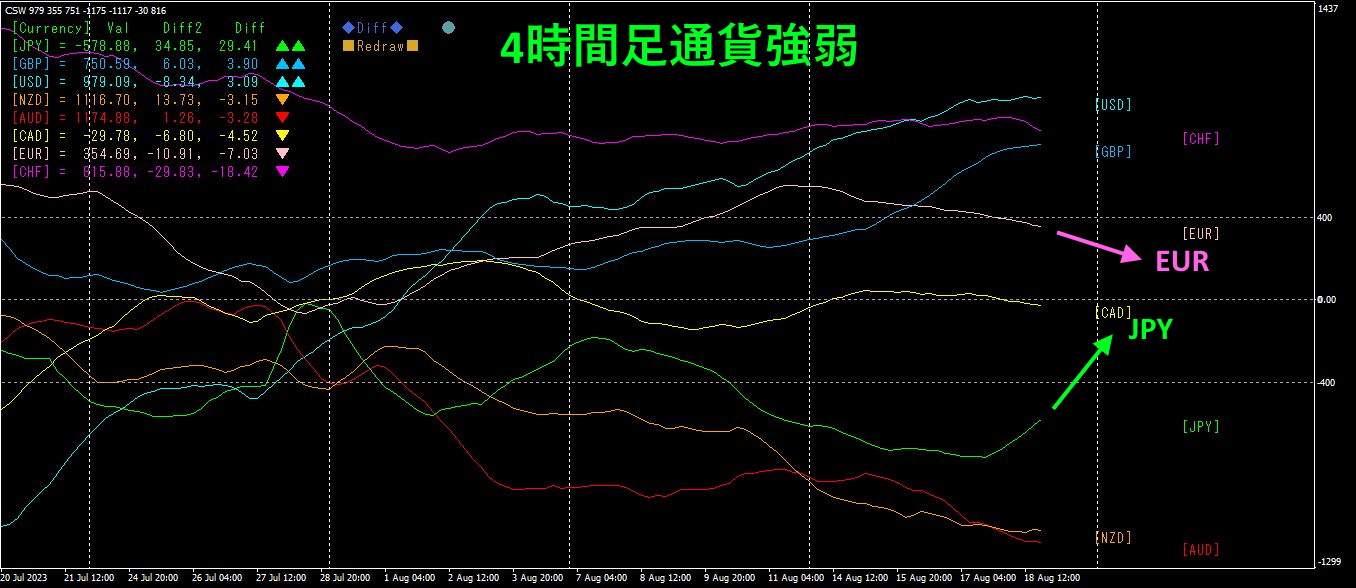
Pink is EUR, green is JPY. EUR is above JPY, and trends slightly downward, while JPY has moved strongly upward. Going forward, EURJPY is expected to decline.
4. Find a bottom across all currency pairs and build a trend strategy (targeting USDCHF)
2505 "Extreme Bottom Search Indicator" was used to identify the next target pair as USDCHF.
chart
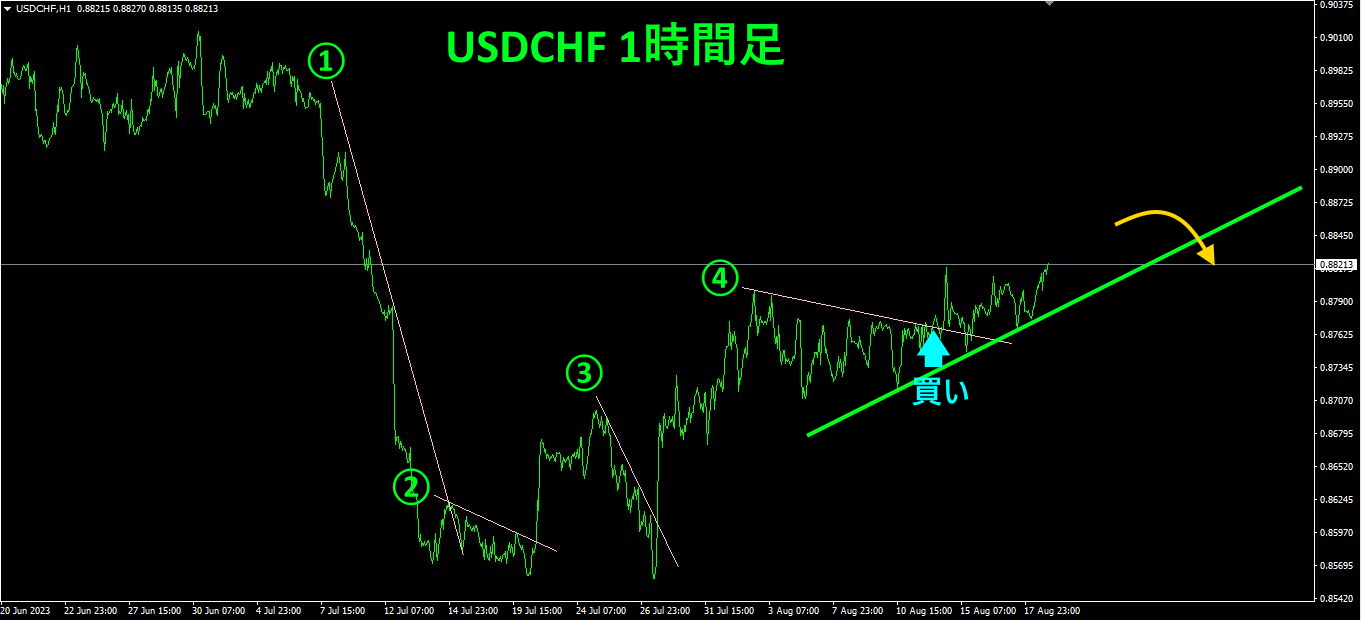
USDCHF is in the "reversal from the bottom" phase, so as shown in steps ①–④, I draw a downward-sloping line and enter a buy when it breaks above. The rate has broken above the downward line at step ④, so I currently hold a long position. If the green rising trendline is broken in the future, I will simply exit.
From here on, I will repeat this simple and easy-to-understand trading method. The current rate is0.88313. If I look at the daily chart, I expect a rebound back up to around0.8980, so there is still about150 pips of possible retracement. I will simply try to catch that using the Trend Line EX.
" Trend Line EX if available, you can draw an inclined downward line, and when it breaks above, it automatically buys; if it breaks below the rising line, it automatically exits—a passive trade.
※“Trend Line EX

https://www.gogojungle.co.jp/tools/indicators/42257
If you are interested in the "8C Currency Strength Visualization Indicator," please refer to the following page.
MT4 version https://www.gogojungle.co.jp/tools/indicators/39150
MT5 version https://www.gogojungle.co.jp/tools/indicators/39159
【My products for sale】


