

Billions of traders are doing scalping
Good evening, everyone.
From around noon, perhaps due to China real estate, the yen has become the strongest.
The weakest is the pound, followed by the Australian dollar.
The chart below is the GBP/JPY 5-minute chart.
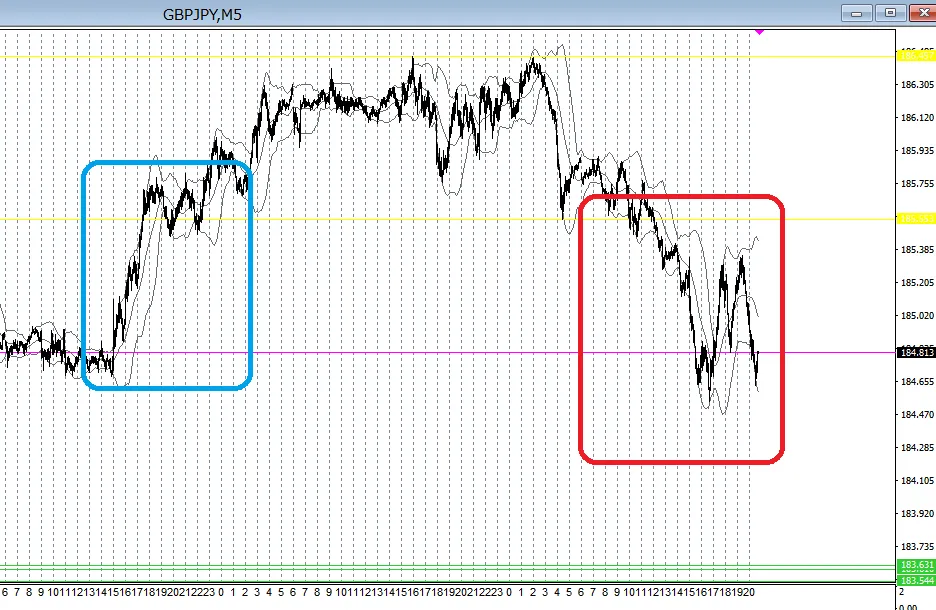
If you look at the million-trader charts, you can see clearly that GBP/JPY has been undershooting the previous day's low (yellow horizontal line) and
the selling pressure has intensified.
In any timeframe, I think charts tend to be more or less left-right symmetric.
The GBP/JPY above shows a roughly symmetrical relation between the rise on August 16 and today's decline.
Users should think that if there is a clean rise and fall in the million-trader chart, eventually the opposite trend will come.
My personal view is that clean rises and falls tend to occur when one of the currencies is either the strongest or the weakest.
Today the yen is the strongest, so the cross yen pairs are fairly cleanly dropping.
As for the current USD/JPY, after the 5 PM rally, I would like to eat up the rise with selling, but the price range isn’t very clear at the moment.
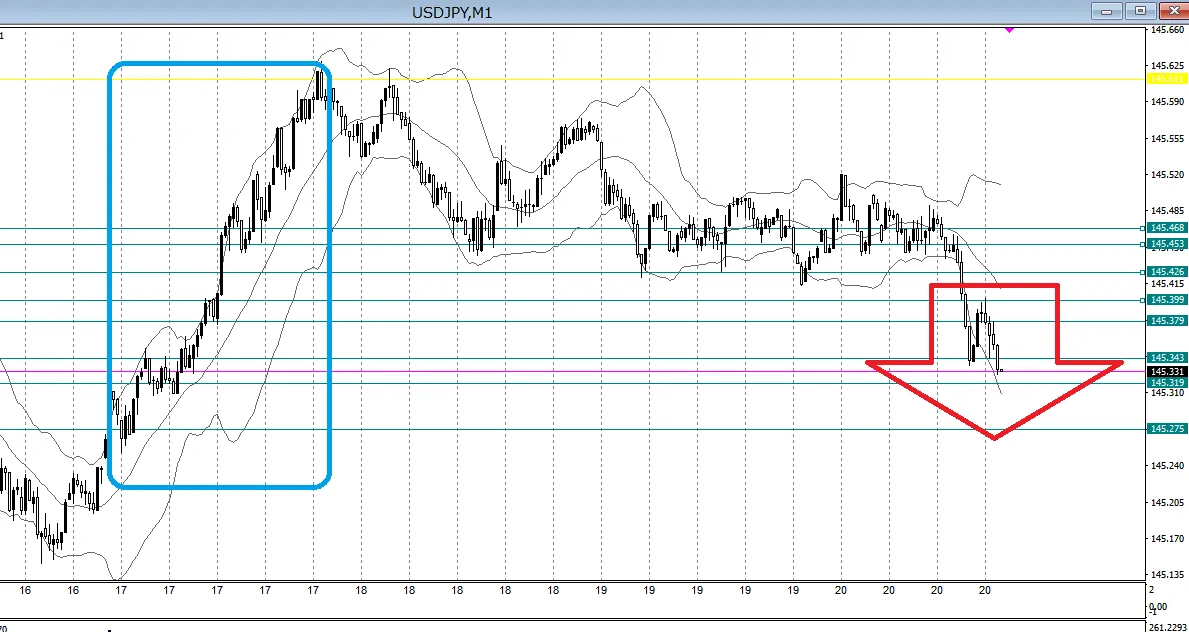
For million-trader scalpers, focus on the moments of switching between buying and selling,
and before clearing the 30% zone, form a scenario for the next move and watch closely.
And then, here it comes!
When the moment arrives, enter smoothly and close out your position.
This is one strategy, but you could also keep the 1-minute chart of USD/JPY and cross Yen pairs open, and trade the pair that appears the clearest and easiest to understand.
Besides USD/JPY, I watch GBP/JPY, EUR/JPY, and AUD/JPY.
Today is Friday.
We should be careful not to forcefully dive in.
The scalping that the million-traders are doing
https://www.gogojungle.co.jp/tools/indicators/42559
Stress-free unconventional hedging (well, it hardly loses)
FX's unusual hedging
↓
https://www.gogojungle.co.jp/tools/ebooks/19435