

Utilization of the "Visualization Indicator" (No. 107)
Utilization of the “Visualization Indicator” (part107)
1. Further evolving the “28 Currency Pair List Indicator” into an indicator
“8CPVisualization Indicator”to plotAUDJPY"/>
The “8CPVisualization Indicator” includesOceania version,London version,NewYork version,AnyCP version. This time, theOceania version was used.
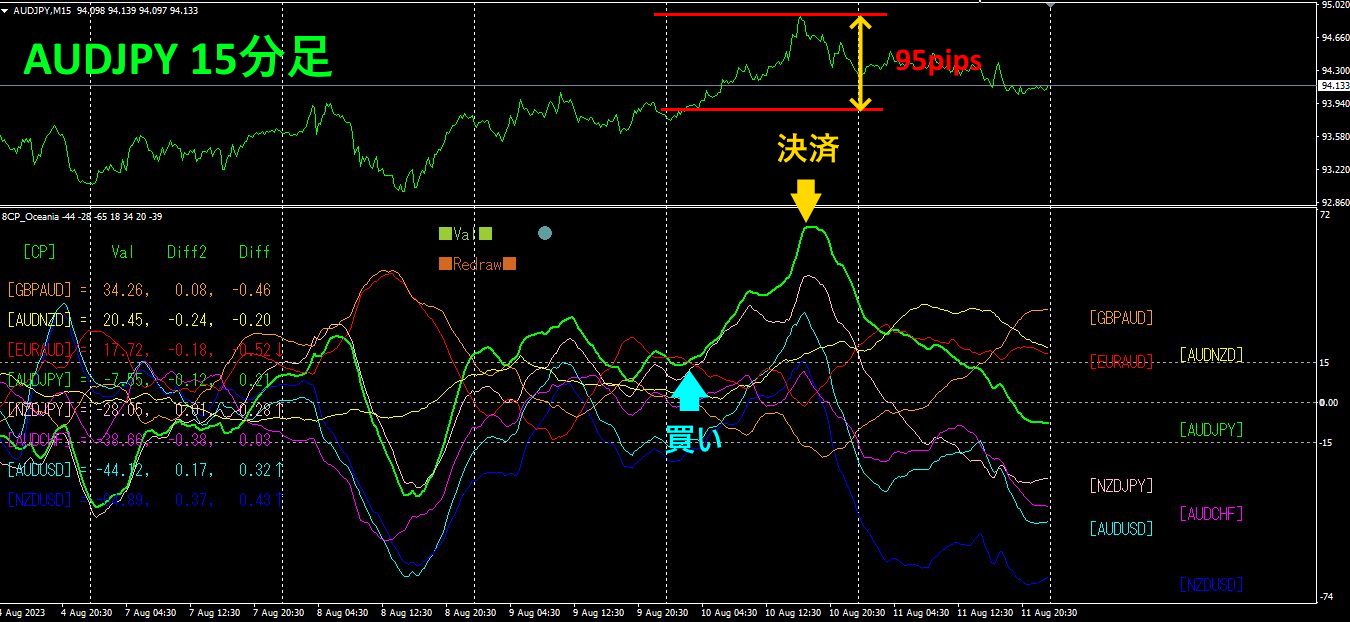
The upper half is a 15-minute chart ofAUDJPY. The lower half shows data from the “8CPVisualization Indicator.” The green thick line graph corresponds toAUDJPY.
On Thursday, AUDJPY rose above other chart groups, so I entered a buy. As the graph reached a peak and reversed, I closed the position the same day.Profit of about95 pips was obtained.
2. Best SelectTry the Indicator
The figure below is a screenshot taken onAugust,11,02:46 (JST)
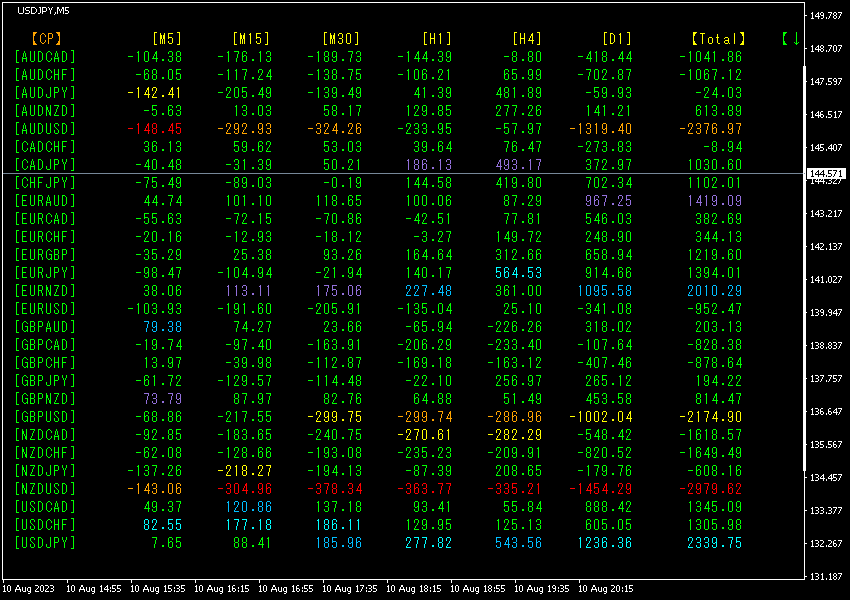
The currency pairs are sorted in ascending order. In the fourth line from the bottom,NZDUSD shows red coloring on all timeframes, and theTotal-2979.62.
Now, let’s look at the chart forNZDUSD.
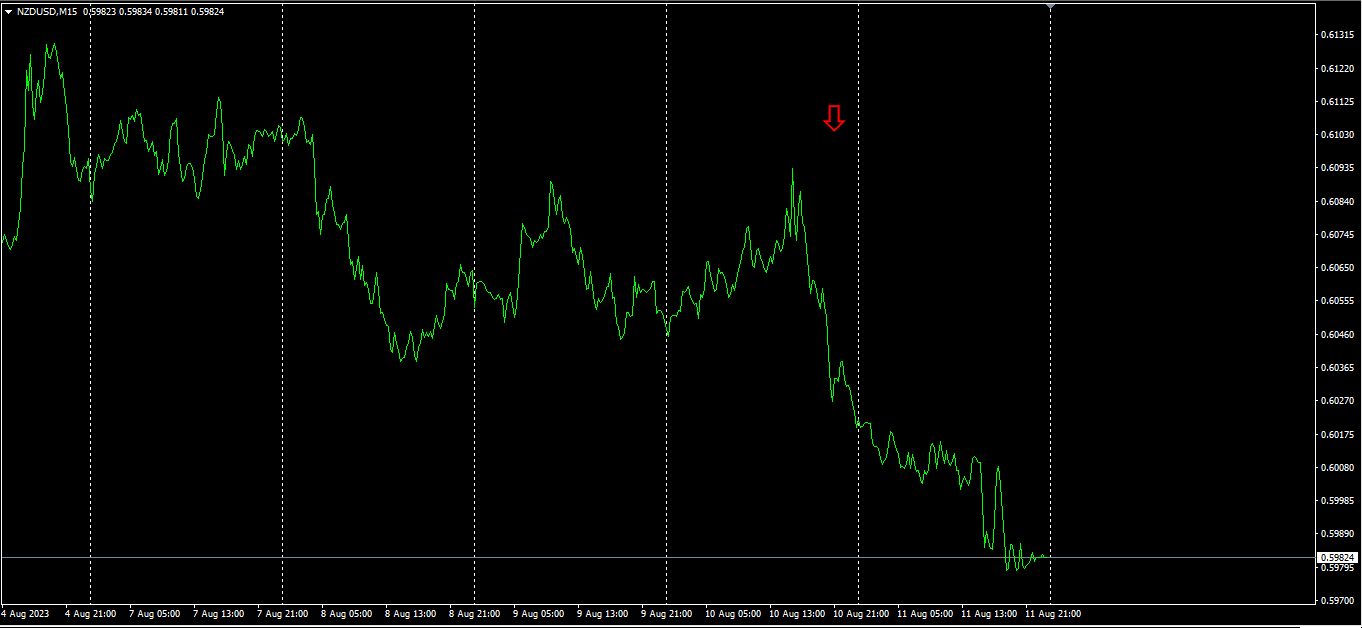
The red arrows mark the point where the screenshot was taken. It is in the middle of a steep downward trend with a downward-sloping right shoulder. The decline continues beyond the arrows. If you had sold here, you could have captured more than50 pips by the weekend.
The “28 currency pairsBest Select indicator allows you to easily identify which currency among the 28 pairs is showing the strongest trend. It also tells you, with numbers and colors, whether you should currently trade. It enables you to judge the overall movement of all currency pairs at a glance.
“28 currency pairsBest Select

https://www.gogojungle.co.jp/tools/indicators/35128
3. Since last year May, what happened to EURJPY which we have been tracking
Since May,2021,EURJPY
To view the overall trend, I have drawn about30 minutes of the most recent3 weeks.
Last time I wrote the following.
EUR isJPY above it, trending upward,JPY also upward, but the angle forJPY is slightly steeper, so in the future may trend downward.
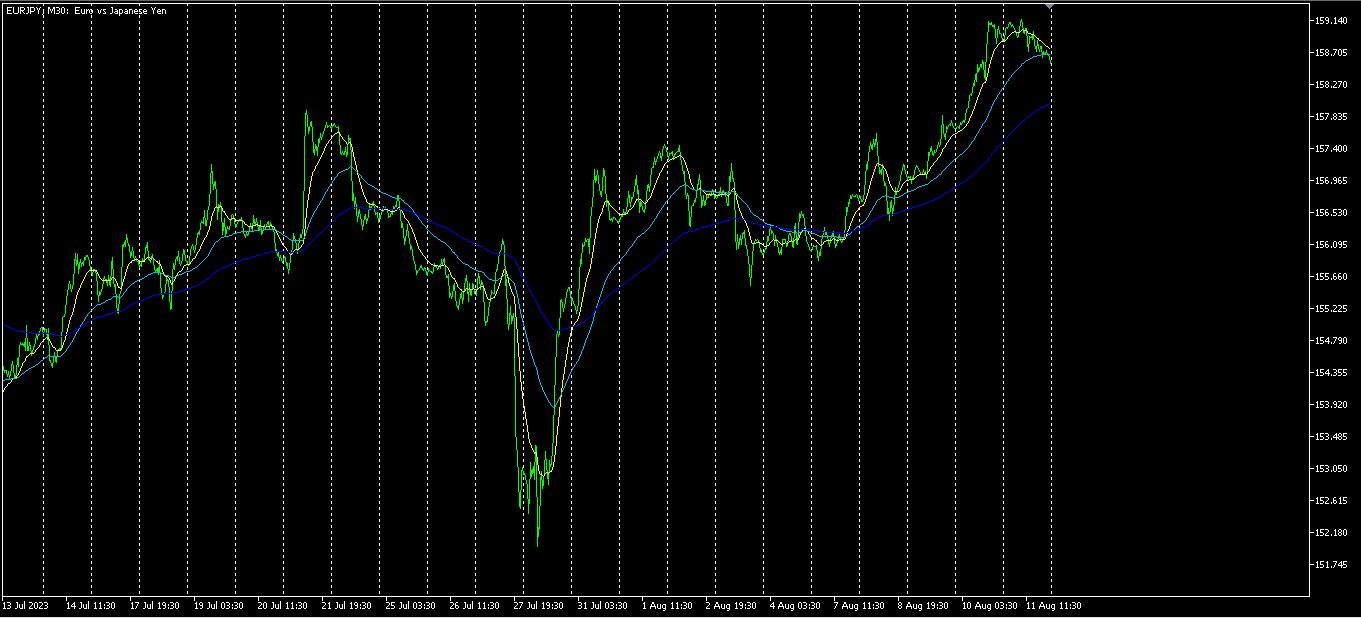
The downward pressure was only on Monday. From Tuesday onward, it surged significantly.
4A 4-hour currency strength chart.
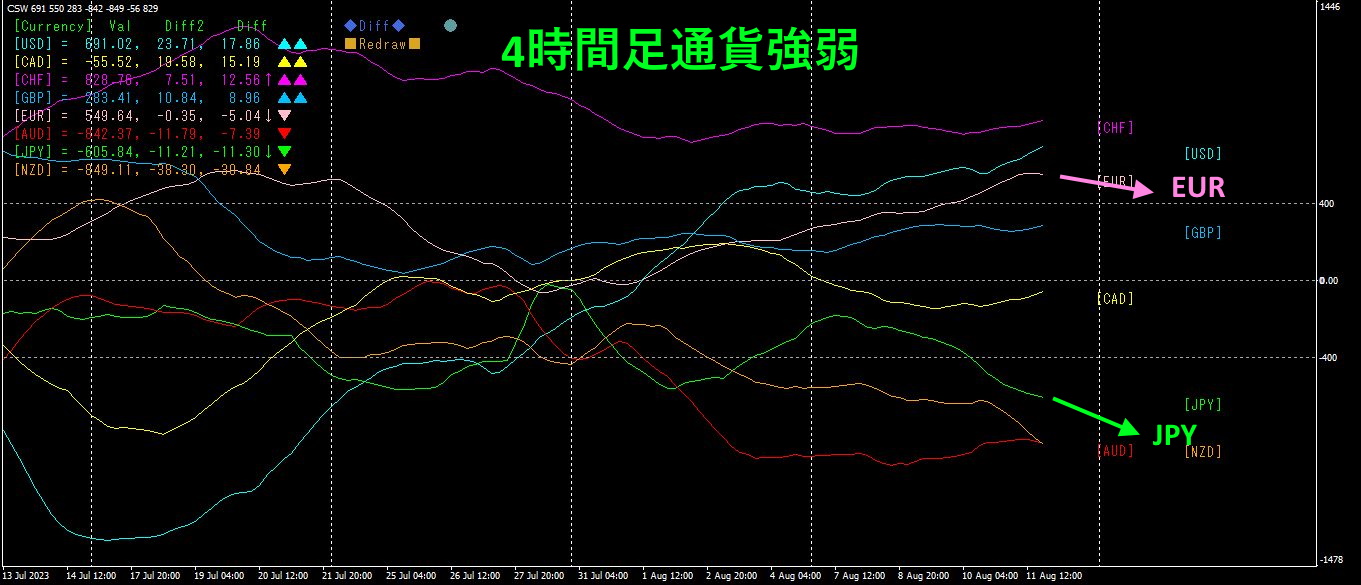
Pink isEUR, green isJPY.EUR sits aboveJPY, with a slightly downward tilt, andJPY also declining somewhat, but the angle forJPY is slightly more downward, so in the future may rise slightly.
4. Find the bottom across all currency pairs and build a trend strategy (target:USDCHF)
2505“Bottom Search Indicator”SearchUSDCHF
chart.
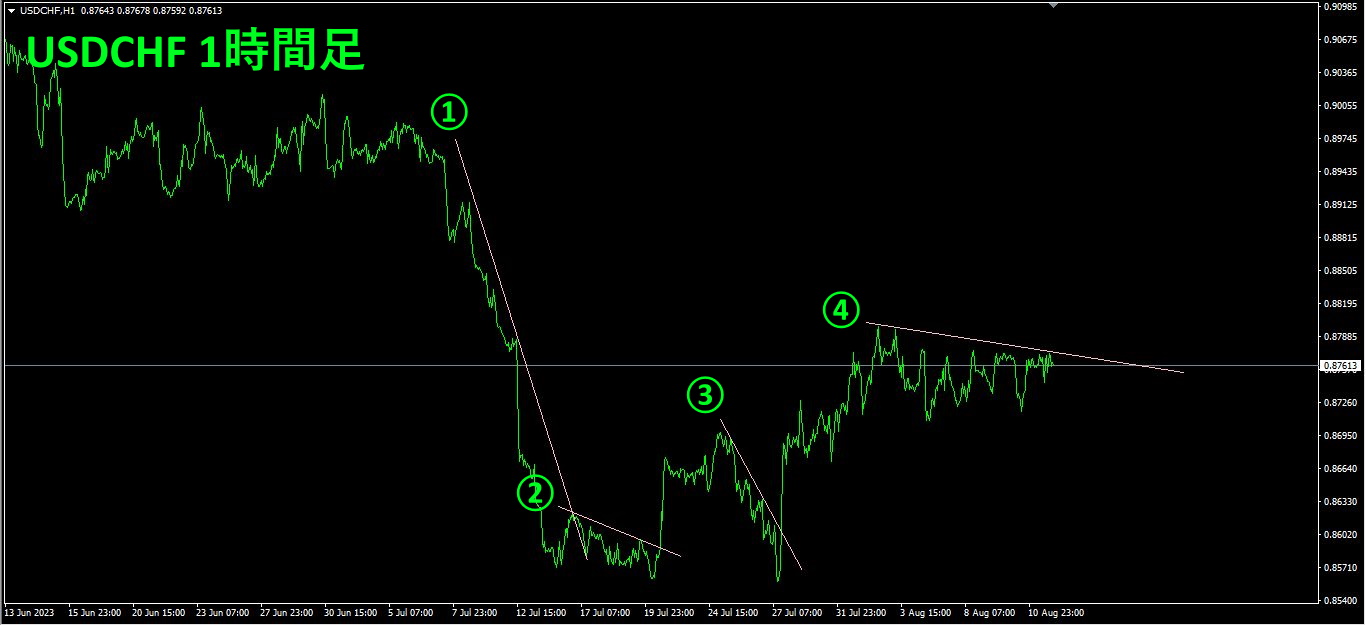
USDCHF is in the phase of “rebounding from the bottom,” so I will draw a down-sloping line as steps ①–④, and when it breaks above it, I will enter a buy; when it breaks above, I will enter a buy, and when it breaks below the rising line, I will automatically exit.
From then on, it is just repeating this very simple trade. The current rate is0.87613. On the daily chart, it is expected to retrace up to around8980200 pips of potential retracement. Use “” to simply go for it.
“Trend Line EX” lets you draw an oblique downward line; if the price breaks above it, it buys automatically, and if it breaks below the rising line, it automatically exits as a passive trade.
※“Trend Line EX

https://www.gogojungle.co.jp/tools/indicators/42257
If you are interested in the “8C Currency Strength Visualization Indicator,” please refer to the following page.
MT4 version https://www.gogojungle.co.jp/tools/indicators/39150
MT5 version https://www.gogojungle.co.jp/tools/indicators/39159
【My items for sale】


