

Utilization of the "Visualization Indicator" (Part 106)
Utilization of the "Visualization Indicator" (part106)
1. Evolve and develop the "28 Currency Pairs List Indicator" into an indicator
“8CP Visualization Indicator” to drawCADJPY
“8CP Visualization Indicator” hasOceania version,London version,NewYork version,AnyCPNewYork version.
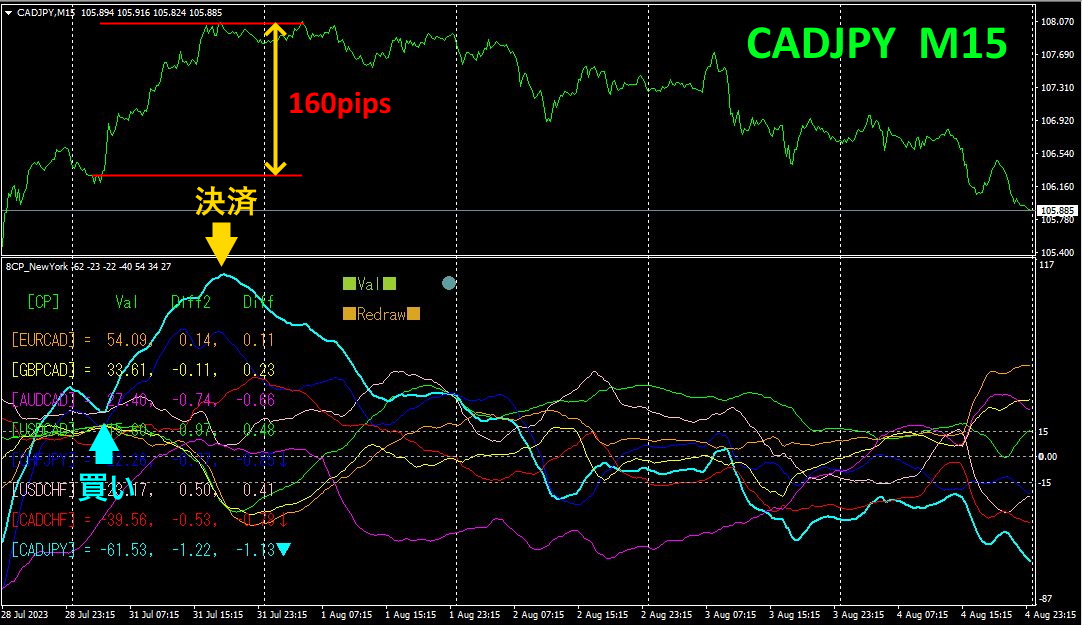
The top half is the 15-minute chart ofCADJPY. The bottom half is from the “8CP Visualization Indicator.” The blue light-thick line chart corresponds toCADJPY.
On Monday, CADJPY broke above the other chart groups, so I entered a long position. As the graph peaked and reversed, I closed the position.Approximately160pips of profit was obtained.
2. Best Select Try the Indicator
The following diagram is a screenshot taken on2023 year August 1 day 21:51 (JST) .
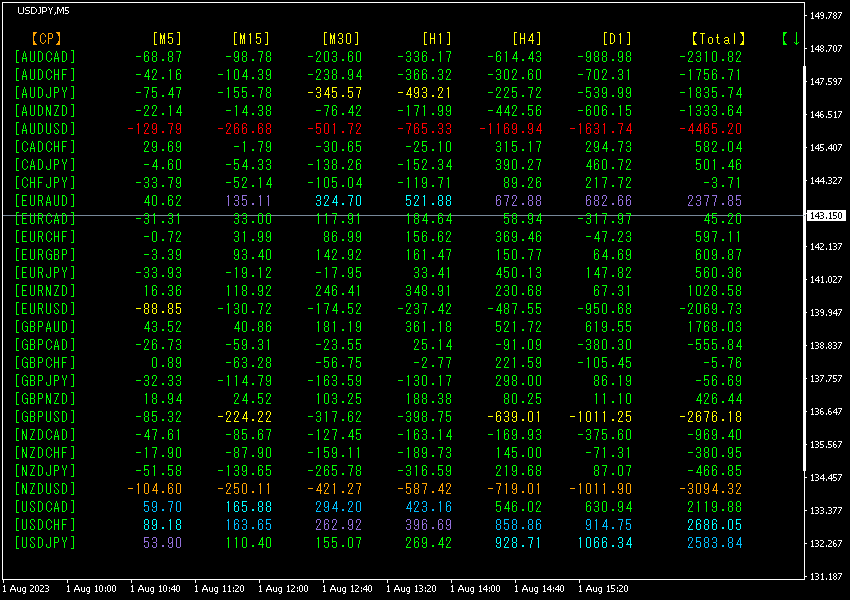
The currency pairs are sorted in ascending order by name. In the fifth row from the top,AUDUSD is shown in red on all timeframes, and theTotal value is-4465.20, a large negative number. This indicates a strong downtrend inAUDUSD.
Now, let's look at the chart for.
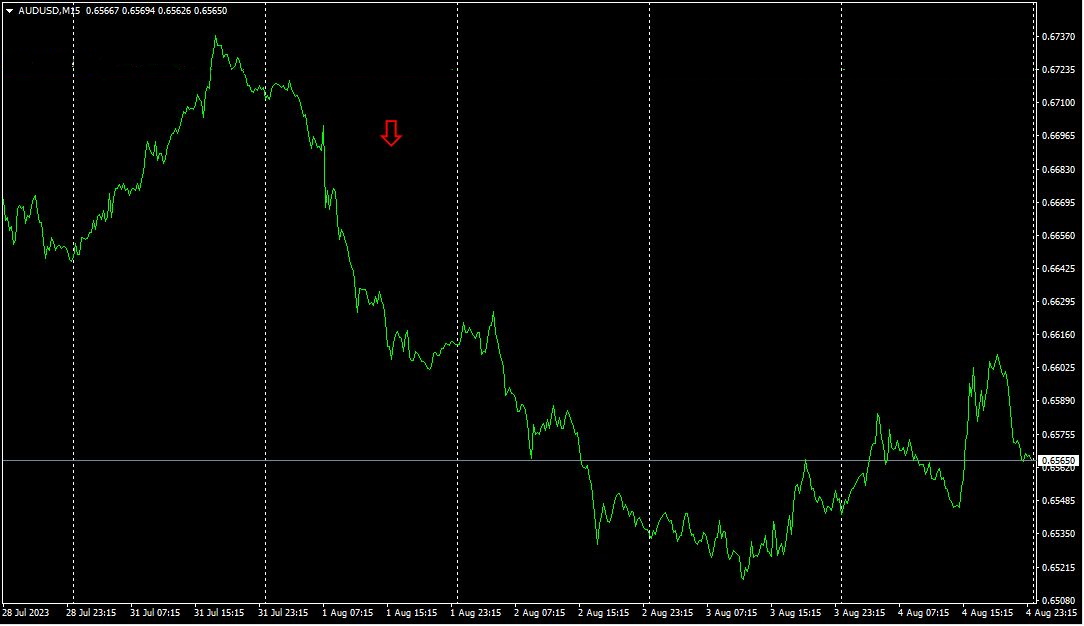
The red arrow marks the point when the screenshot was taken. It is in the middle of a large downward trend that slopes downward to the right. After the arrow, the decline continued and fell by another. If you had sold from the recent low on Tuesday morning, you could have captured more than of movement.
The “28 currency pair indicator allows you to easily identify which currency among the 28 pairs is exhibiting the strongest trend. It also tells you, with numbers and colors, whether you should trade now. It provides a clear, at-a-glance sense of the overall movement across all currency pairs.
“28 currency pairsBest Select indicator”

https://www.gogojungle.co.jp/tools/indicators/35128
3. What happened to EURJPY, which I have been tracking since May of the previous year?
Since May year 2021, May EURJPY.
To view the overall trend, I have drawn about3 30 weeks of the last minutes chart.
Last time, I wrote as follows.
EUR is above it, moving upward,JPY is moving downward, so is expected to rise.
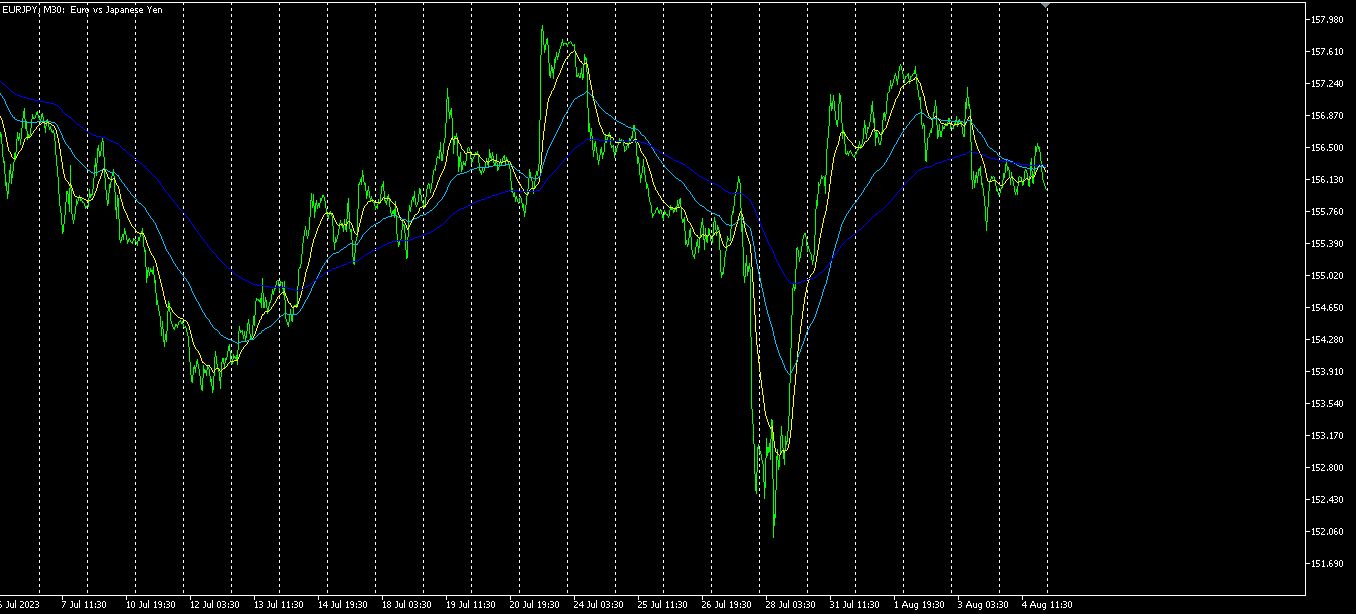
Monday saw a strong rise. Since then, it has retreated somewhat.
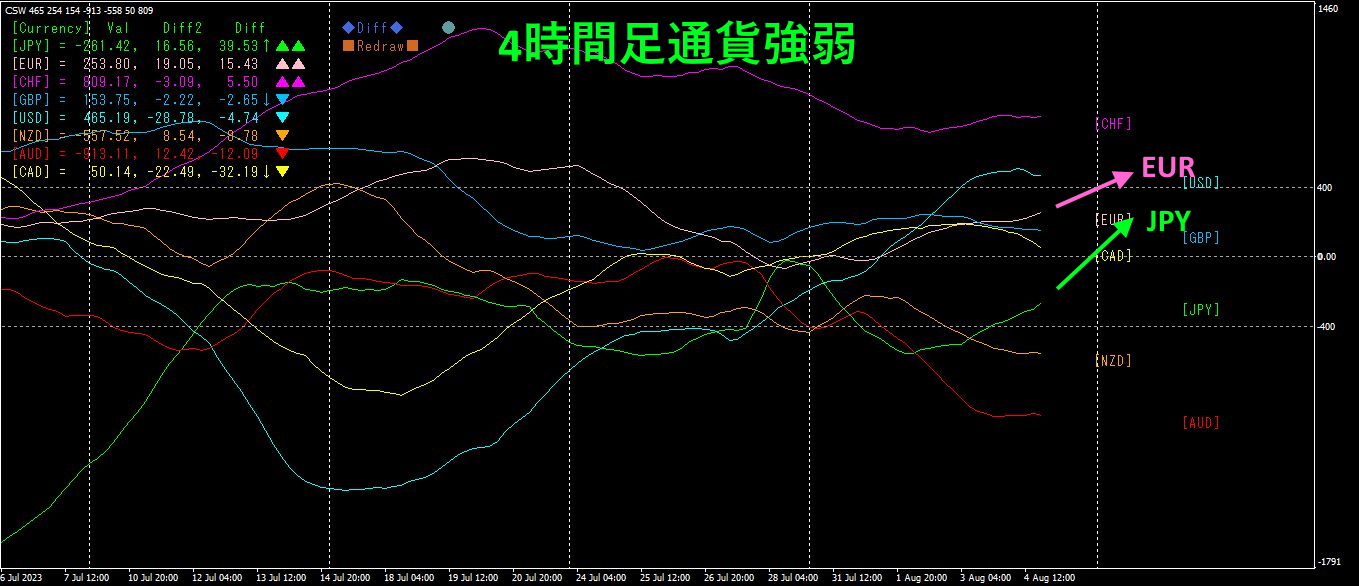
Pink isEUR, green is. is above and both are rising, but the angle of ascent is slightly steeper for, so going forward, is likely to trend downward.
4. Scan all currency pairs to find the bottom and build a trend strategy (target:)
2505“Nadir Search Indicator” was used to identify the next target currency pair as.
chart.
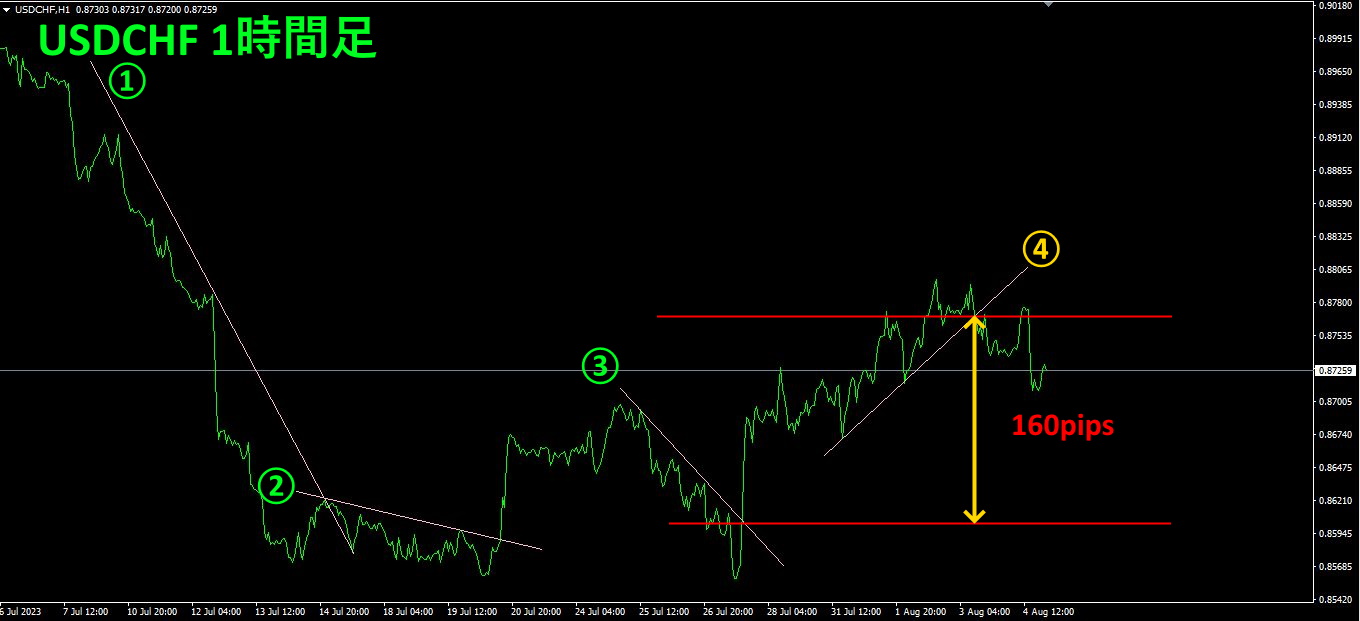
USDCHF is in the “rebound from the bottom” phase, so I drew downward sloping lines from steps ①~③, and when it broke above these lines I entered a long position. After it broke above the bottom line at step ③, I set a take-profit at the break of step ④, yielding a profit of about.
Since then, this is simply a repeated, very straightforward trade that has reliably produced profits. The current rate is0.87259. On the daily chart, I expect a retrace back toward around 0.87980, which means there is still about of potential retracement. I will continue to chase this using the “Trend Line EX.”
“Trend Line EX” enables you to draw a diagonal downtrend line, and when it breaks above, it automatically buys; when the line rises and is broken, it automatically closes the position, i.e., a passive trading approach.
※“”

https://www.gogojungle.co.jp/tools/indicators/42257
If you are interested in the8C currency-strength visualization indicator, please refer to the following page.
version https://www.gogojungle.co.jp/tools/indicators/39150
version https://www.gogojungle.co.jp/tools/indicators/39159
【Products I Have for Sale】


