

Usage of the "Visualization Indicator" (Part 104)
“Visualization Indicators” usage (part104)
1. Further evolve the “28 Currency Pairs List Indicator” into an indicator
“8CP Visualization Indicator” to plotGBPAUD
The “8CP Visualization Indicator” comes in Oceania, London, New York, and AnyCP versions. This time, we used theOceania version. 版、 version, andAnyCP version. This time, we used theOceania version.
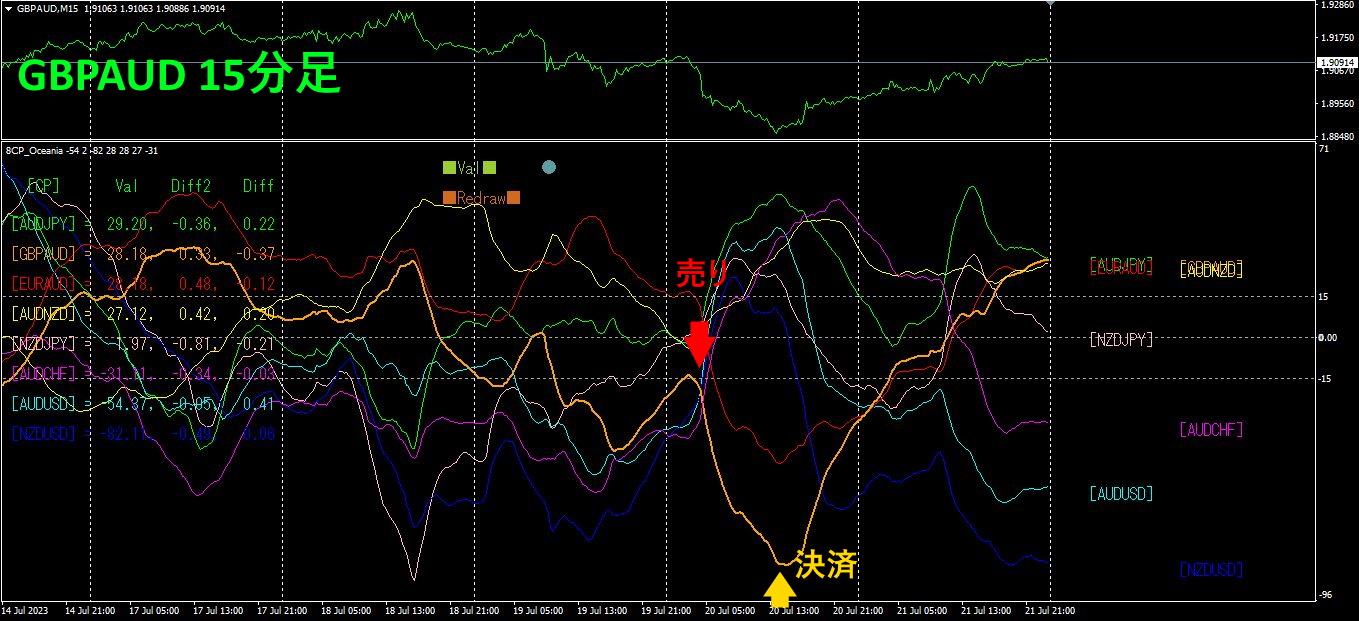
The upper half is a 15-minute chart ofGBPAUD. The lower half is from the “8CP Visualization Indicator.” The orange thick-lined graph corresponds toGBPAUD.
On Thursday, GBPAUD fell below other graph groups, so we entered a sell. As the graph hit a bottom, we closed the position.Profit of about120 pips was earned.
2. Best Select Try the indicator
The figure below is a screenshot taken onJuly,,22:08 (JST).
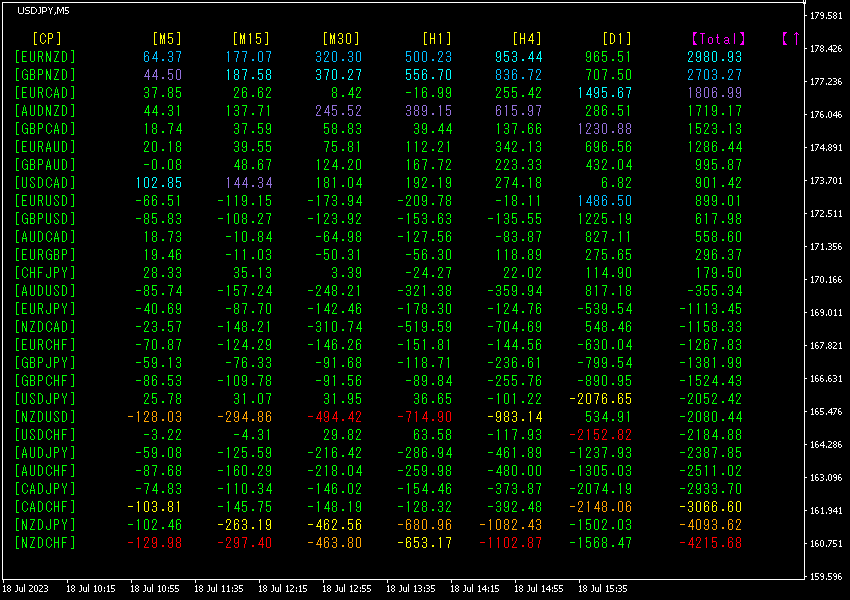
values are sorted in descending order. The bottom row’sNZDCHF is red on all timeframes except[D1], and the total value is-4215.68, a large negative number. This indicates a strong downtrend for NZDCHF. shows a significant downward trend.
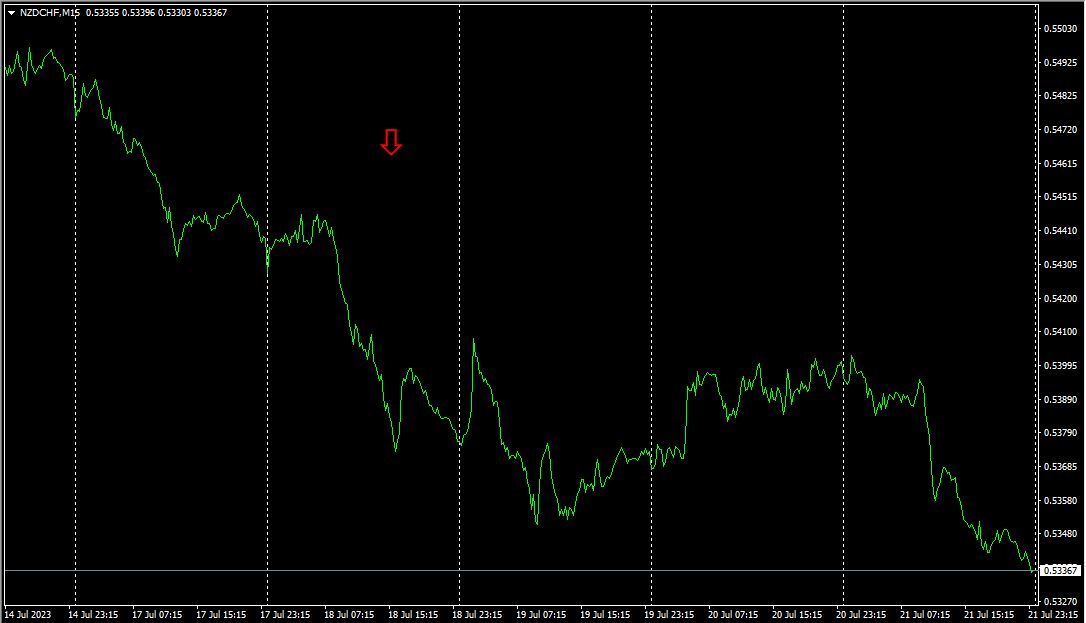
The red arrows mark the screenshot point. It is mid a descending trend with a right-shouldered decline. The overall direction is down, so sticking to selling on rallies yields profit. You could place a stop near the recent high and hold until the weekend.
“28 currencies Best Select indicator” allows you to easily identify which currency among 28 pairs is currently showing the strongest trend, and whether you should trade now via numeric and color cues. It enables at-a-glance assessment of all currency pairs’ movements.
“28 currency pairs indicator”

https://www.gogojungle.co.jp/tools/indicators/35128
3. What happened to EURJPY, tracked since last year’s May5?
year May, May EURJPY to movement tracked.
To view overall trends, a30-minute chart showing roughly the past3 weeks is drawn.
Previously, it was written as follows.
EUR isJPY positioned above, and the recently converged graphs have widened.EUR trended upward,JPY downward, so EURJPY is expected to rise.
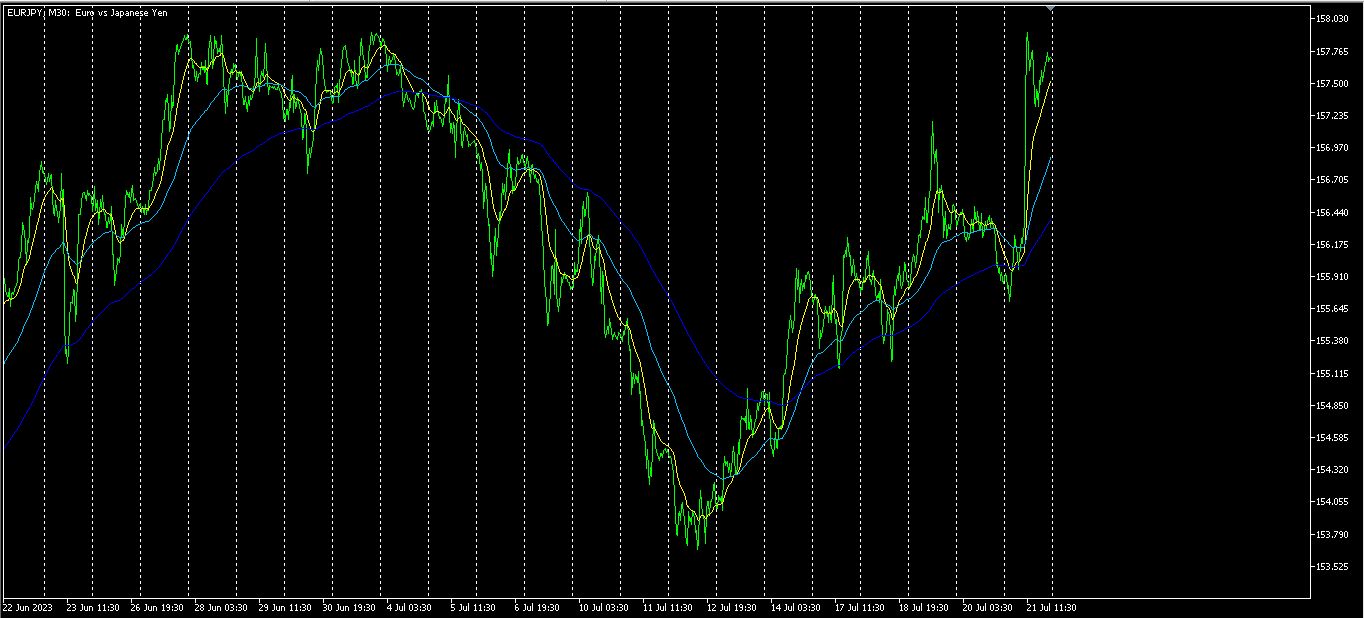
As expected, it has risen sharply.
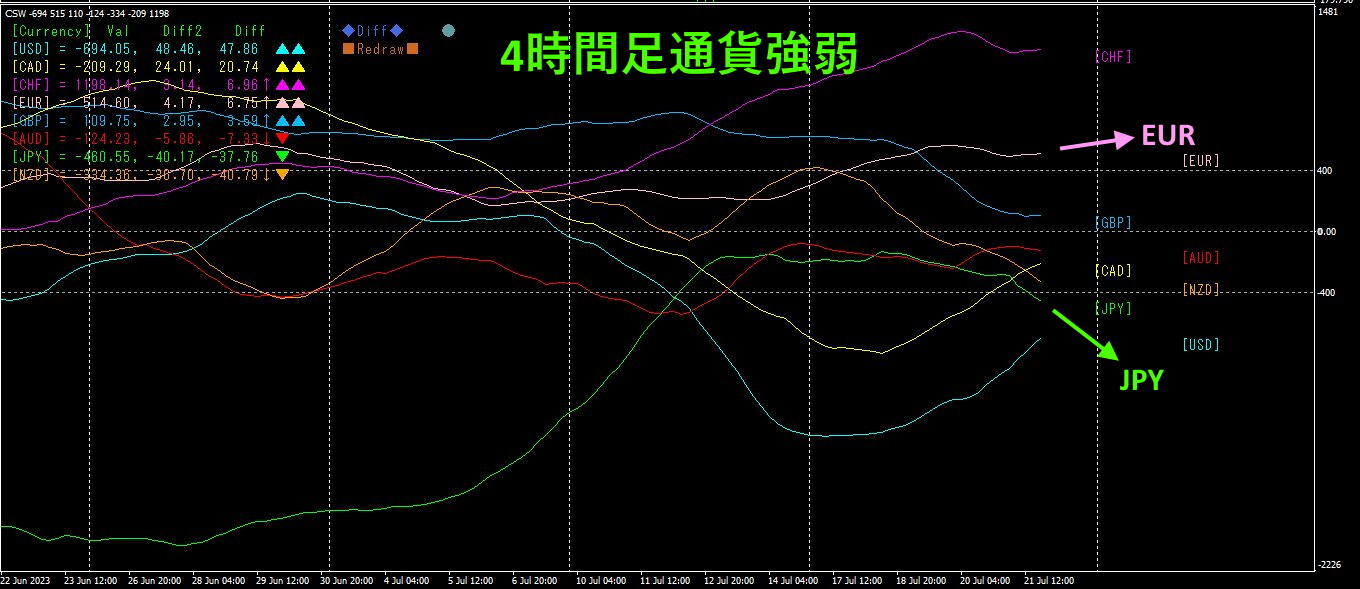
Pink isEUR, green isJPY.EUR is aboveJPY, so the direction is up for EURJPY, but since it has reached near the recent high, the move may stall.
4. Scan all currency pairs to find a bottom and formulate a trend strategy (target:USDCHF)
Previously, we used42505“Bottom Search Indicator” to identify USDCHF as the next target currency pair.
chart.
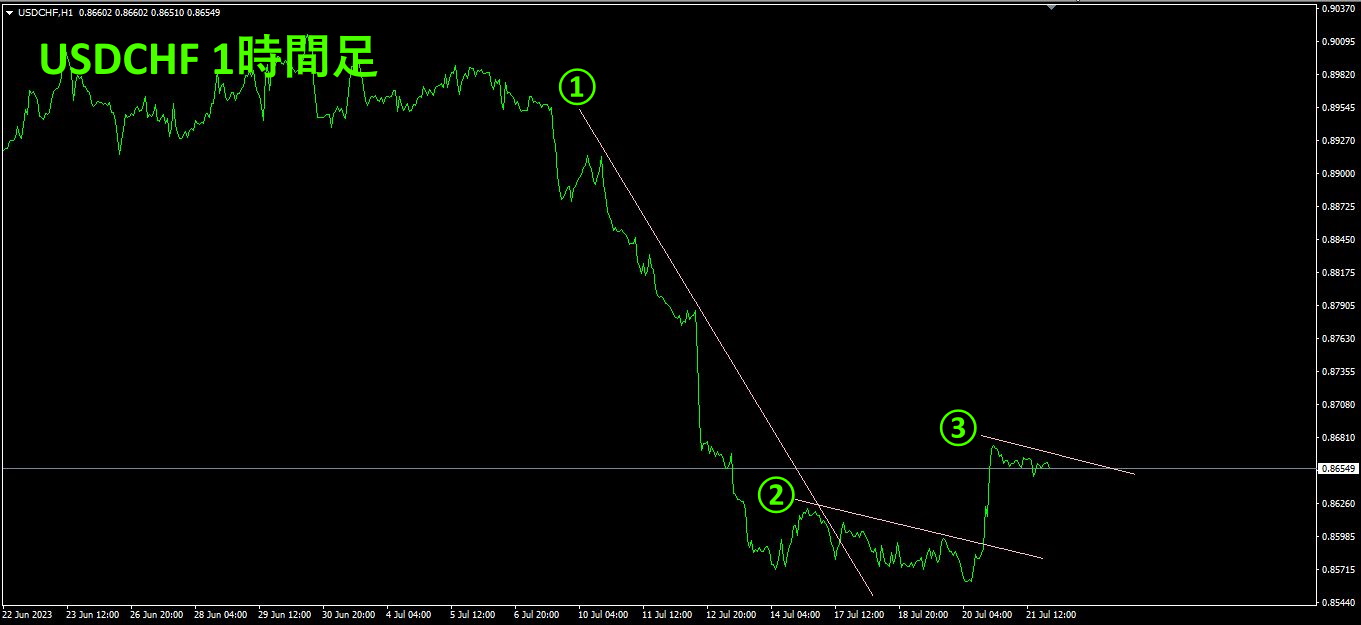
USDCHF has entered the “rebound from the bottom” phase, so steps ①–③ involve drawing a descending line and entering a buy when it breaks above. Trading becomes very simple, with less second-guessing.
The rise from step ② to ③ is about80 pips, so if you trade 1 lot,1 CHF = £163, your profit would be£130,400.
“Trend Line EX” is finally ready to be used: draw a diagonal downline, and if it breaks above, you can enter a buy automatically. If you don’t own “Trend Line EX” yet, please consider purchasing it.
※“Trend Line EX”

https://www.gogojungle.co.jp/tools/indicators/42257
If you’re interested in the “8C Currency Strength Visualization Indicator”, please refer to the following page.
version https://www.gogojungle.co.jp/tools/indicators/39150
version https://www.gogojungle.co.jp/tools/indicators/39159
【My listed items】


