

Utilization of the "Visualization Indicator" (Part 103)
“Visualization Indicator” usage (Part103)”
1. Evolve the “28 Currency Pairs List Indicator” and develop the indicator
“8CPVisualization Indicator”to drawAUDCAD.
There are versions of the “8CPVisualization Indicator”Oceania version,London version,NewYork version,AnyCP version. This time, we used theNewYork version.
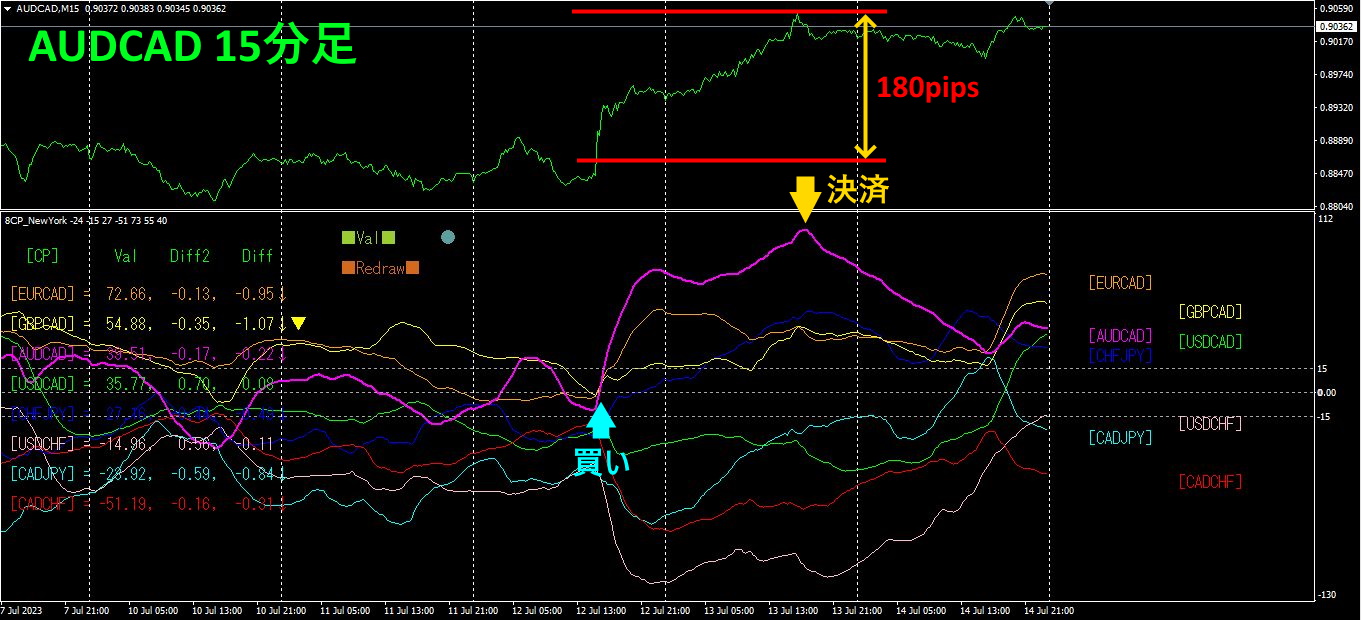
The upper half is theAUDCAD 15-minute chart. The lower half is from the “8CP Visualization Indicator.” The red-purple thick line graph corresponds toAUDCAD.
On Wednesday, AUDCAD broke above other graphs, so we entered a long trade. As the graph reached its peak, we closed the position.Approximately180 pips of profit was obtained.
2. Best SelectTry the indicator
The figure below is a screenshot taken at2023 year7 month12 day12:07 (JST)
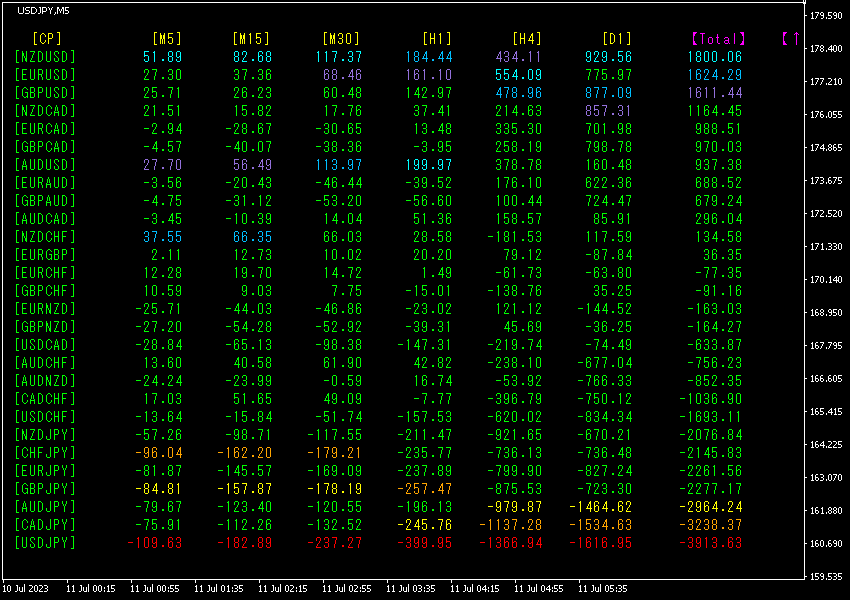
Values are sorted in descending order. The bottom rowUSDJPY shows red color on all timeframes, and value is-3913.63, a large negative number. indicates a strong downtrend.
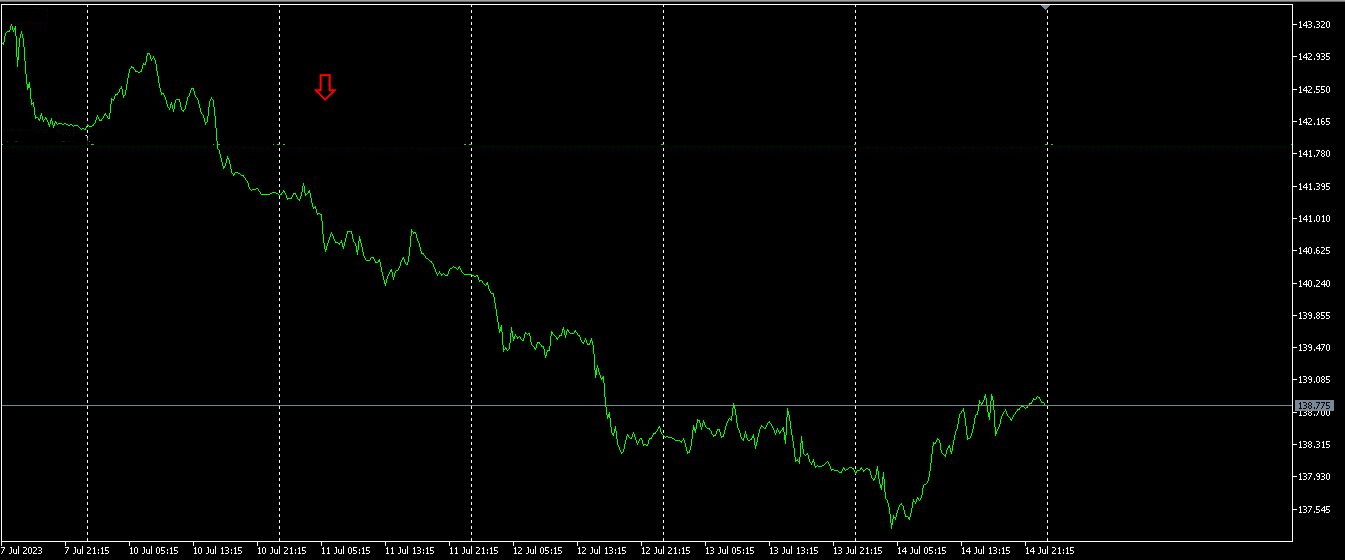
The red arrows indicate the point where the screenshot was taken. It captures a drop in the middle of a long downtrend. If you had sold from here, you would have earnedabout350 pips of profit.
The “28 currency pairs Best Select indicator makes it easy to find which currency pair among the 28 has the strongest trend. It also tells you whether to trade now with numeric and color cues. It allows you to assess all currency pairs at a glance.
The “28 currency pairs Best Select indicator

https://www.gogojungle.co.jp/tools/indicators/35128
3. Since two years ago, what happened to EURJPY which has been tracked since May5?
Since May2021month has been tracked.
To see the overall trend, a30-minute chart shows about the last3 weeks.
Last time, I wrote the following.
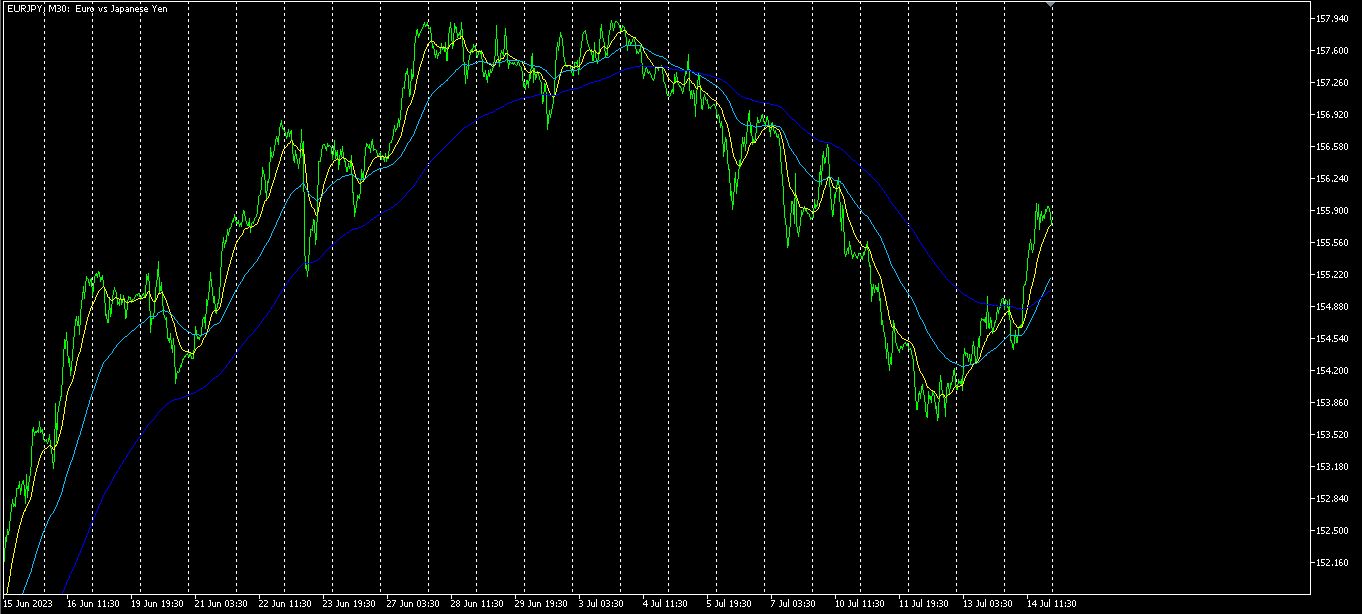
As expected, early in the week it did decline robustly. Since then, it has begun to rise.
Pink isEUR, green is is positioned aboveJPYJPY., and the previously converging spacing between the two graphs is widening again.EUREUR is rising,JPY is falling, so EURJPY is expected to rise in the future.
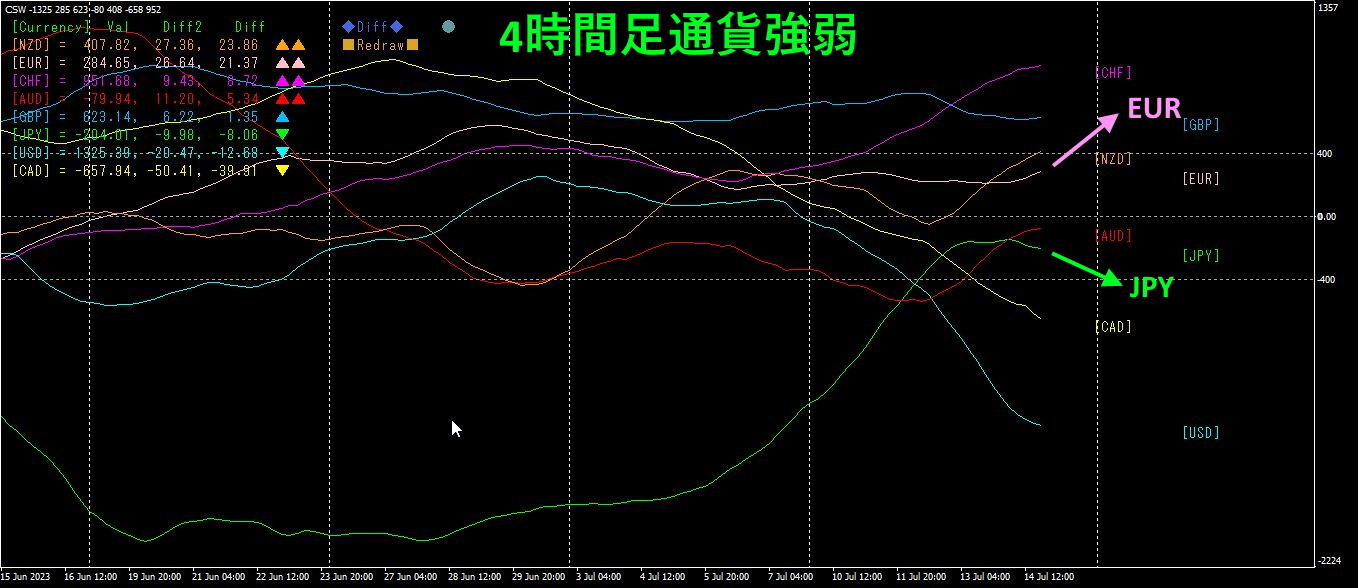
4. Find the bottom across all currency pairs and build a trend strategy (target: USDCHF)
Last time,42505 “天底 Indicator” was used to identify USDCHF as the next target.
chart.
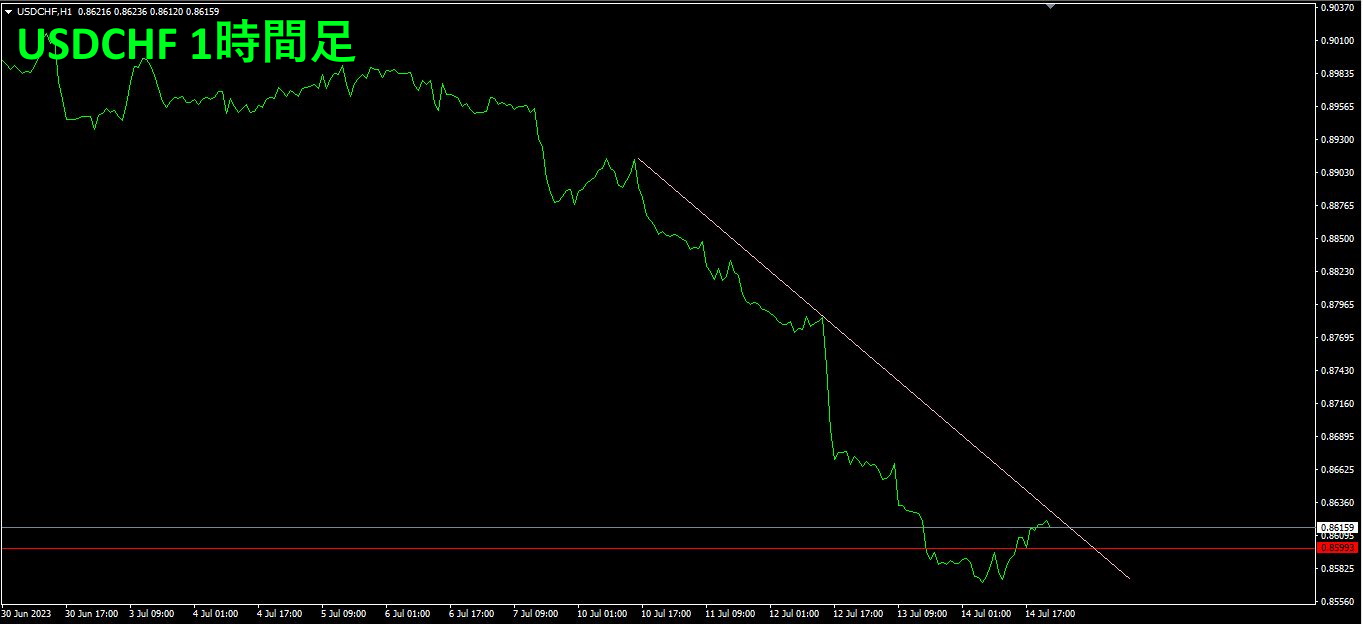
Looking at USDCHF on the1 hour chart shows signs of bottoming and reversing. The red horizontal line marks the recent low on the weekly close, indicating a near bottom. The major bottom on the weekly timeframe is still one level lower, so further downside is possible.
If you own theTrend Line EX, you can draw a diagonal down-sloping line and, once it breaks above, automatically enter a buy. It may be prudent to wait a bit more.
※“Trend Line EX”

https://www.gogojungle.co.jp/tools/indicators/42257
For those interested in the “8C Currency Strength Visualization Indicator,” please refer to the page below.
MT4 version https://www.gogojungle.co.jp/tools/indicators/39150
MT5 version https://www.gogojungle.co.jp/tools/indicators/39159
【My listed items】


