

"1-minute chart" Today (7/2) capture the "winning pattern" and enter!
『1-minute chart』
Today (7/2)) catch the “winning shape” and enter!
(BTCUSD)
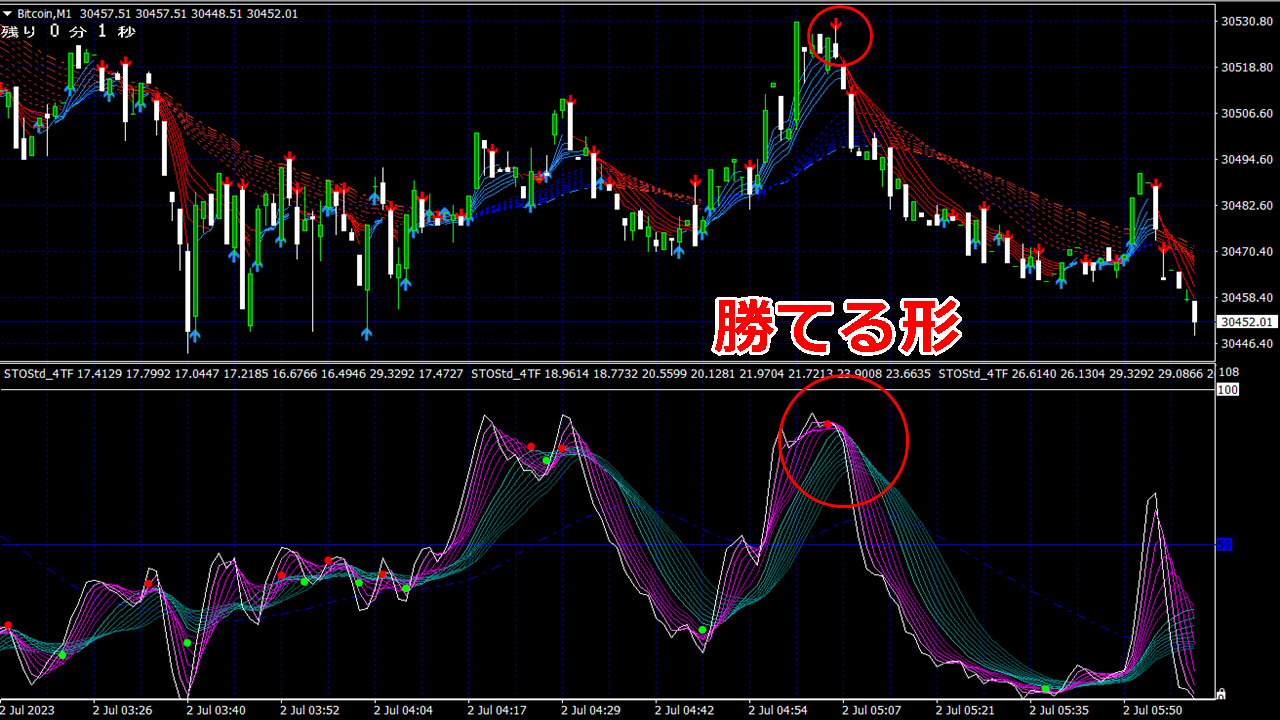
★After sign lights up, enter when the pink band is overlapped by the green band!
(Click image to enlarge)
Capture vast opportunities on the 1-minute chart! BO & FX dual-purpose indicators
We will reveal a rock-solid entry method using the'1-minute indicator'
<Entry steps①② are simple!>
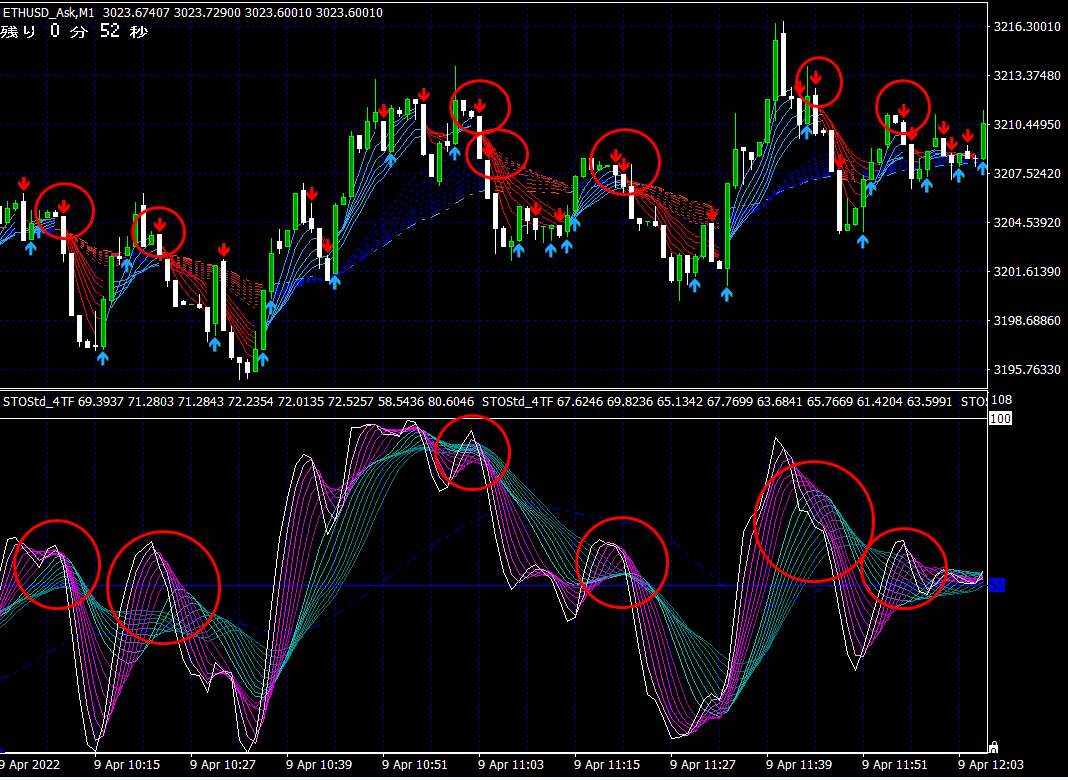
In an uptrend,

①Turn on the arrow signal to prepare for entry.
②When the arrow signal is on,the pink band of the indicator should be rising from below and covering the green bandfrom underneathin a scooping shape,then enter on a high option with 1-minute or 3-minute timeframe just before the current candlestick closes or right after it closes.
※Just because a sign is lit does not mean you enter; if the indicator does not scoop up the green band, do not enter (frequency of entry on sign lighting is only a few times in a period).
※On the 1-minute chart, there are dozens to around 100 entry opportunities per day
“Enter only on the winning shape!”
< Shape scooping up the green band= What is a winning shape? >
Points where similar entries are possible are the indicator shapes shown in the image below.

In a downtrend,
①Turn on the arrow signal to prepare for entry.
②When the arrow signal is on,the pink band of the indicator should be overlapped by the green bandfrom abovein a scooping shape,then enter a low option about several seconds before the current candlestick closes or right after it closes on a 1-minute or 3-minute basis.
※Sign lit does not mean entry, so if the indicator does not scoop up the green band, do not enter (entry frequency on sign lighting is only a few times in a period).
※On the 1-minute chart, there are dozens to around 100 entry opportunities per day
“Enter only on the winning shape!”
< Shape overlapped by the green band= What is a winning shape?
Points where similar entries are possible are the indicator shapes shown in the image below.
× ![]()


