

Usage of the "Visualization Indicator" (Part 101)
Utilization of the “Visualization Indicator” (Part101)
1. Further evolve the “28 Currency Pairs List Indicator” into an indicator
“8CPVisualization Indicator”to plotEURJPY.
The “8CPVisualization Indicator” hasOceaniaLondon version,NewYork version,AnyCP version. This time, we used theLondon version.
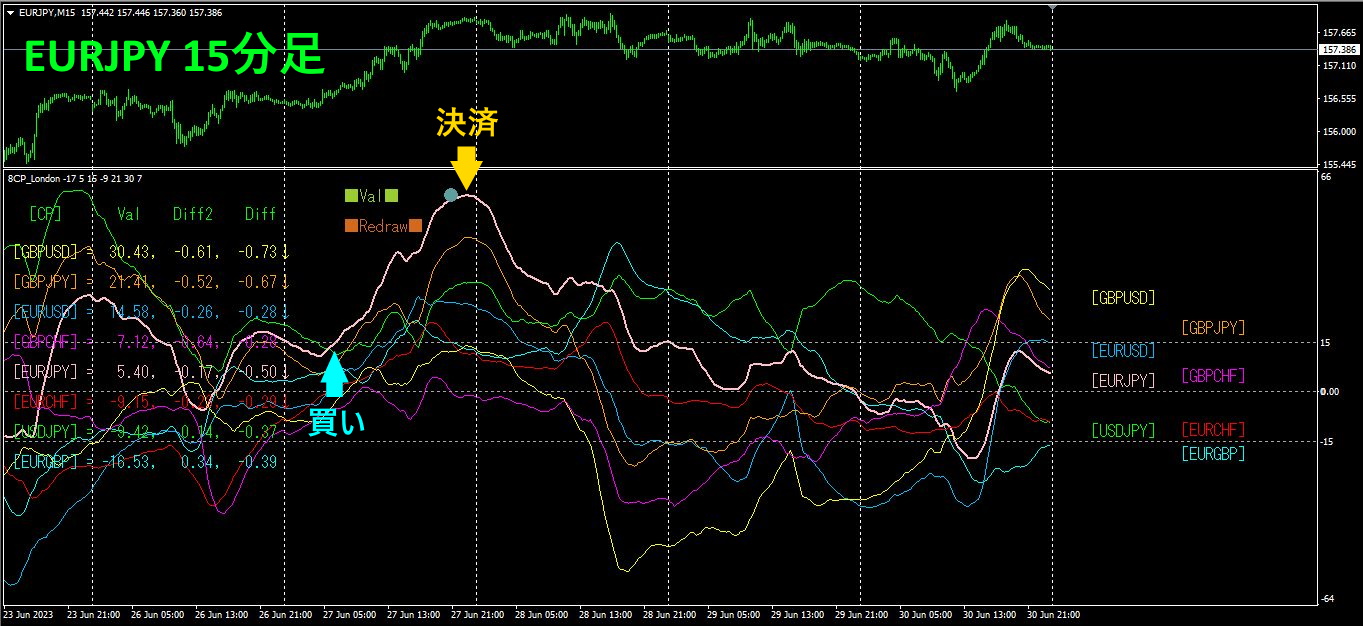
The upper half is a 15-minute chart ofEURJPY. The lower half is from the “8CPVisualization Indicator.” The pink bold line graph corresponds toEURJPY.
On Tuesday,EURJPY rose above the other graphs, opening a long entry. Since the day’s graph reached the peak, I closed the position.Profit of about130 pips was earned.
2. Best SelectTry the Indicator
The below image is a screenshot taken onJune 27, 2023, 18:40().
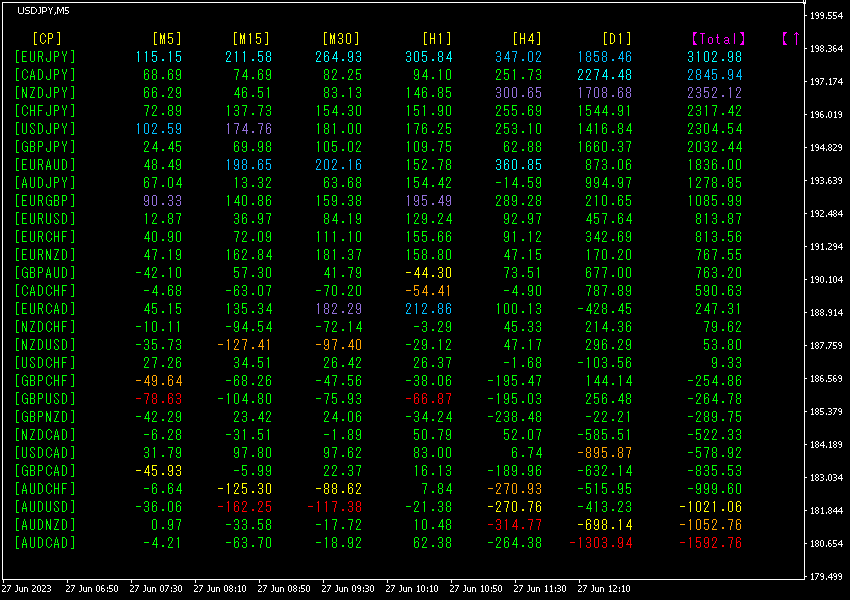
Sorting by descending value. The top row’sEURJPYis shown in light blue on all timeframes, and the total value is, a large figure. This indicates a strong upward trend for3102.98.
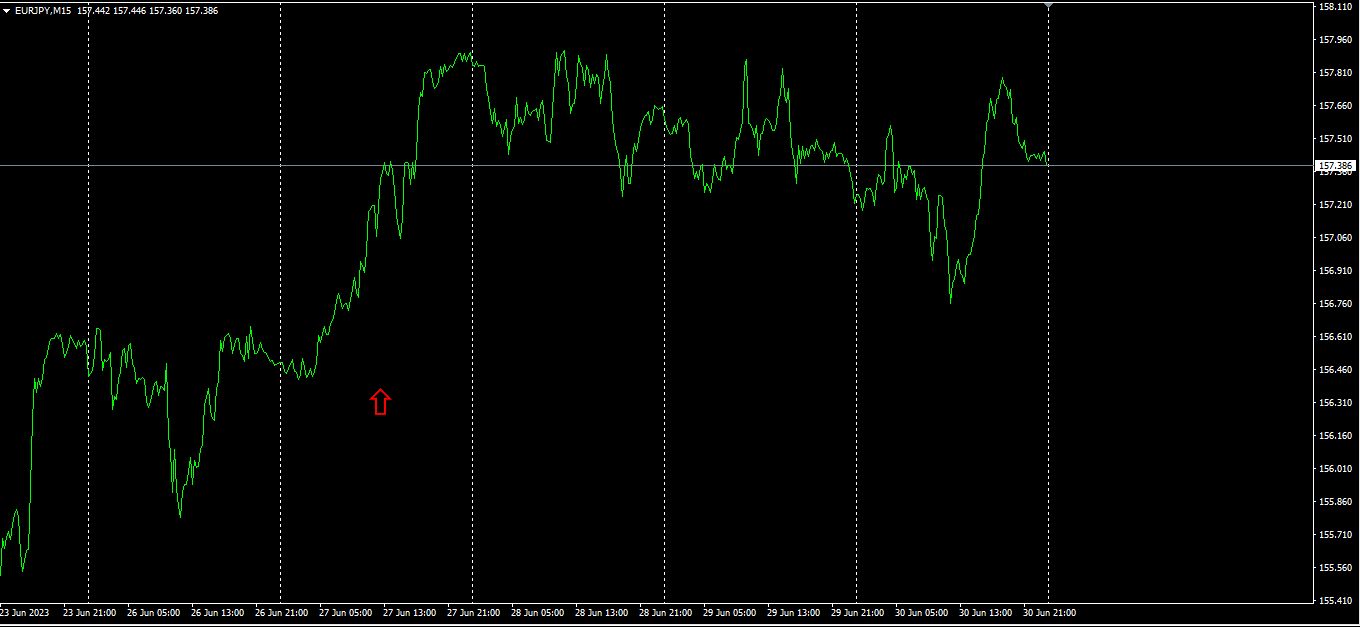
The red arrows indicate the points at which the screenshot was taken. They accurately capture sharp rises within an uptrend.
“28 currency pairsBest Select indicator makes it easy to identify which currency among the 28 pairs is showing the strongest trend. It also tells you whether you should trade now with numeric and color cues. It allows you to gauge the overall movement of all currency pairs at a glance.
“28 currency pairsBest SelectIndicator”

https://www.gogojungle.co.jp/tools/indicators/35128
3. What happened to EURJPY since May of the year before last?Five months agoEURJPY movement?
From 2021 year5 monthEURJPY movement.
To view the overall trend, I’ve drawn about the last weeks on a 30-minute chart.3
Previously I wrote the following.
JPY is downward,EUR is also downward. The downward angle ofJPY is larger than that ofEUR. Going forward,JPY is expected to reverse and rise, soEURJPY would likely peak and then go down.
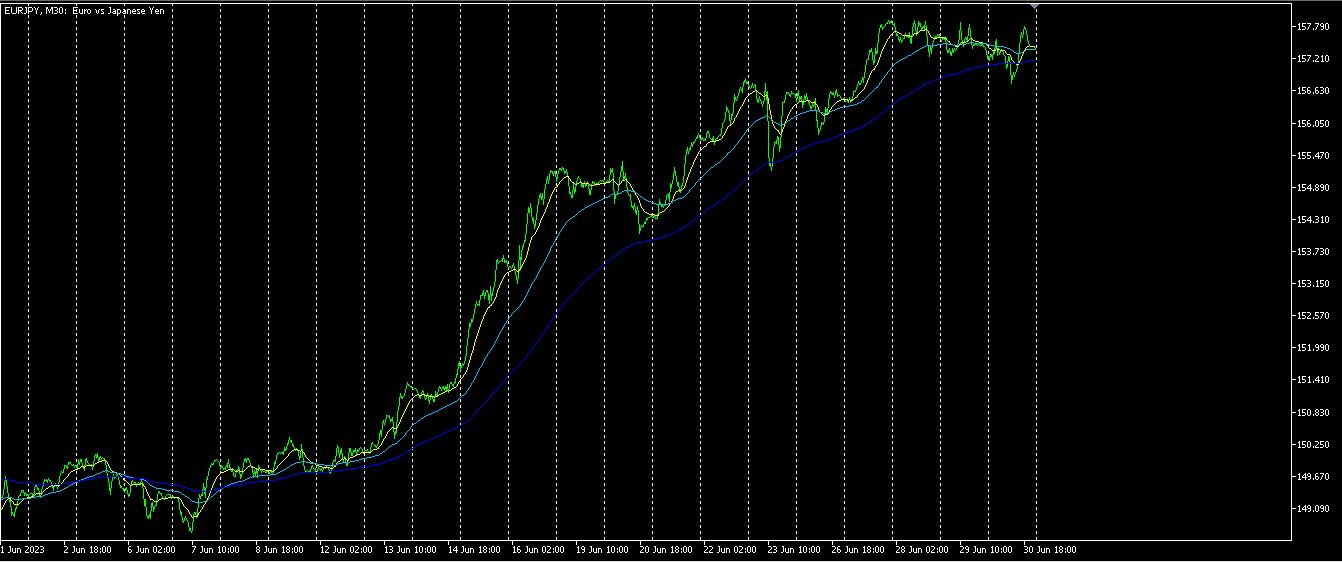
As expected, it has topped out.
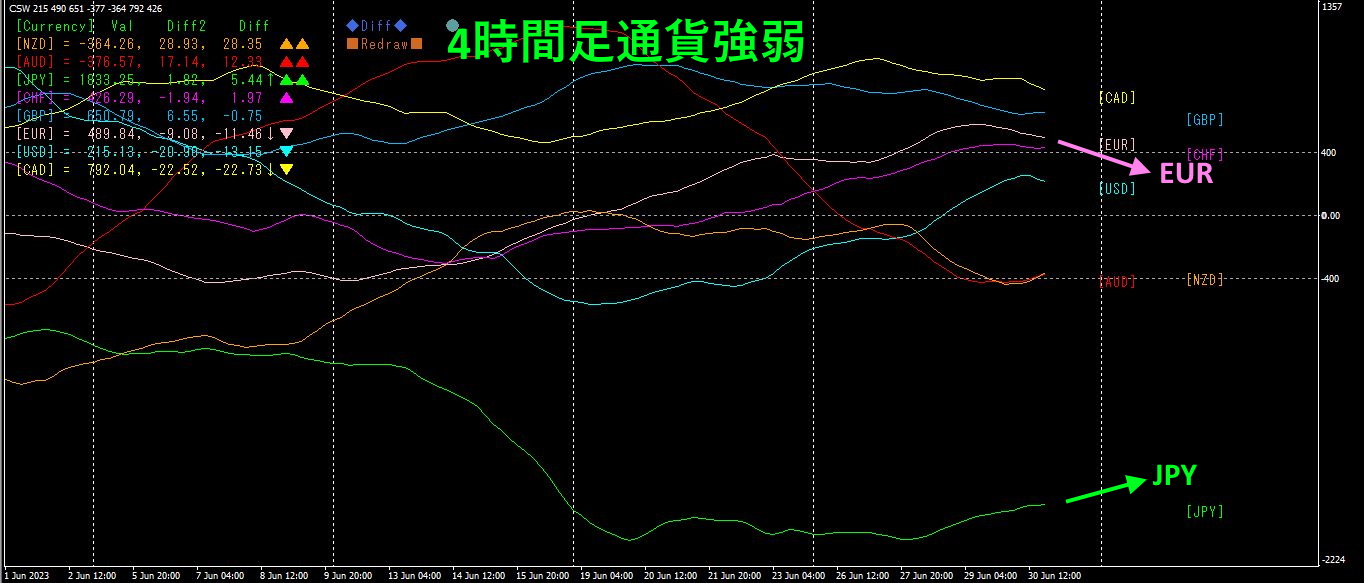
Pink indicatesEUR, green indicatesJPYJPY. Since is rising andEUR is falling,EURJPY is expected to trend downward.
4. Find tops and bottoms across all currency pairs and devise a trend strategy (End)
We have formed a trading strategy to “buy AUDJPY at its bottom.”
Last time,
The daily high from2022 year9 month1398.512 is approaching, so I will end the series of “buy from big bottoms.”
I wrote that.
For confirmation, I will look at the chart.
4We show the timeframe’s chart.
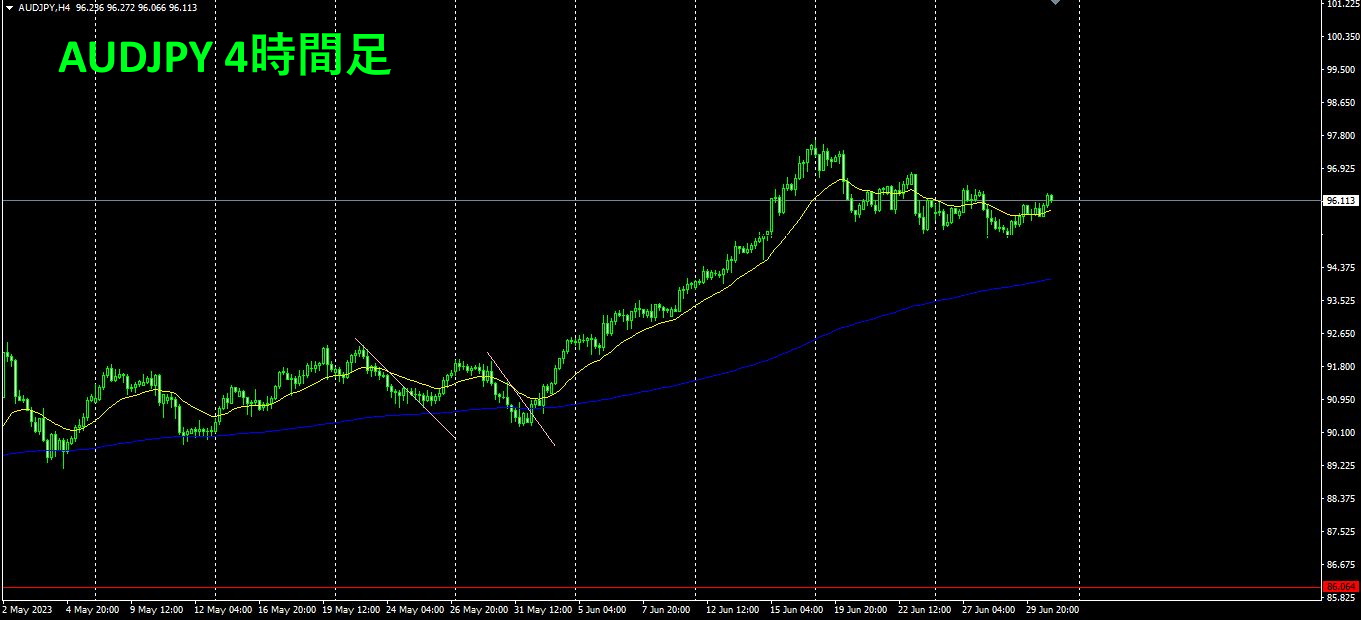
Indeed, it seems it cannot rise any further.
Using the semi-automaticEA’sTrend Line EX””1590 pips
With this, the “buy from the bottom of AUDJPY” trading strategy ends.
※“Trend Line EX”

https://www.gogojungle.co.jp/tools/indicators/42257
“8CCurrency Strength Visualization Indicator” Anyone interested, please refer to the page below.
MT4 version https://www.gogojungle.co.jp/tools/indicators/39150
MT5 version https://www.gogojungle.co.jp/tools/indicators/39159
【My items for sale】


