

Translate the following HTML to English, keep HTML format, do not use code blocks, and do not insert line breaks. Decode standard entities before translating. Original: 億トレーダー達がやってるスキャルピング&普通じゃない両建て Translation: Ethical traders are doing scalping &
Good morning everyone.
I have replied to all the messages I received last night, but if there are still people who have not received my message, please let me know via a message.
Yesterday, the USD/JPY touched 145 yen for the first time in a while, which was a topic on TV.
I don’t watch TV much, but yesterday every channel was saying “FX-general,” “Inbound-general,”
and so on.
In the early Heisei era, TV showed Japanese people around the world “shop like crazy,” but now it seems to be the exact opposite.
How long will this last, I wonder?
Whether Japan's economy is doing well or poorly, I won't be greatly affected, but ideally, it would be nice if everyone around me were in a prosperous mood
and bustling.
When the economy is bad, strange crimes increase and things get dangerous.
I want the Japanese government to do something about it.
The image below is the one-minute chart of GBP/JPY around the London FIX last night.
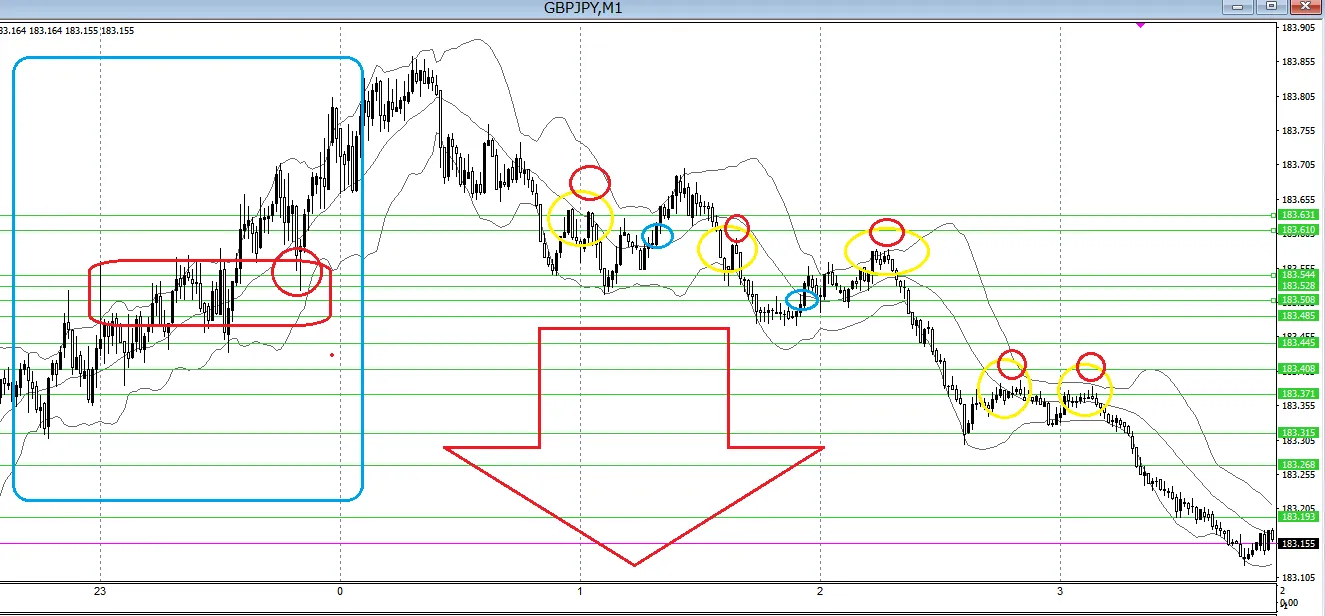
When I could see the blue □ rising, I could draw the billion-trader line (multiple green horizontal lines), but before that last night was, as usual, the end of the month’s last Friday, so I was thinking of positioning in connection with the London FIX.
From the result, while the blue □ was within the red circle, I added long positions as I waited for a rise. If it broke through, I planned to switch to an unusual hedged position, so I would keep adding until the red □ broke below.
As you can see, it rose as befits the last day, and I took profits after surpassing the high.
There are scenes where volatility occurs about 70% of the time, so the option not to do it isn’t really there.
And then, I look at the billion-trader line.
End of the month, London FIX rise.
I had a feeling it would drift down, but the pace of the decline was slow after all.
I drew the line before 1:00, so I would take a short position while watching the line. Since it’s the weekend, spending a blue weekend losing money would be awkward, and I had decided to do only the FIX in the morning, so I watched for about two hours and did not trade.
For the scalpers among billion-traders, the image is to explore positions inside the yellow circle and use the red circle as the stop-loss line.
The position is “sell-only,” so there’s no need to think about extraneous things.
Likely, I will stop out in a situation like the blue circle, but if I stop out with a spread of about +3 PIPs,
the yellow-circle position can turn positive enough.
Having an image and a scenario is very important.
In particular, billionaire traders’ scalping should be easier to form scenarios with multiple lines, after all.
If you trade normally, this billionaire-trader line doesn’t exist, but probably everyone uses indicators like B-bands or multiple moving averages, Stochastics or RSI, takes positions, and when it rises you rush to stop out and look at a chart that’s fallen and think you must sell higher, right?
I think so.
That isn’t wrong, either.
Billionaire traders’ scalping is break-trade aimed, but to take it to an extreme, aiming to break a line that's incredibly high above is also a break-trade.
In the end, nothing is wrong; it’s just a difference whether the result happened or not.
However, if there is a clear indicator to achieve that result, it becomes easier to engage and trade from a favorable position, which is the scalping line of billionaire traders.
There are many horizontal and diagonal trading lines in the world, but the billionaire traders’ scalping line is one of them.
However, it’s a bit different in that it’s a line with a sense and rarity.
The accuracy of the line will be evident if you read the purchasers’ reviews.
If
“You’re stuck in trading”
“I want to quit relying on indicators for my positions”
“I want to trade with solid personal judgment”
“I want to become better at trading and earn money at my own pace”
“I’ve traded for years but overall I’m in the red”
If you have any such worries or thoughts, please read from the beginning the investment guide+ that I wrote.
You will surely discover something.
And today
About the unusual hedging in FX
This product can be called a purely logical tool.
So, I’d like to write about how I usually use this product in different situations.
Users of unusual hedging, please read it as an entry point and take it as such.
① U.S. economic indicators and key speeches
Employment statistics, CPI, FOMC, Powell’s press conference
② U.K. economic indicators
Quarterly inflation report, policy rate, BOE governor’s speech
③ Euro-area economic indicators
ECB policy rate, ECB president’s press conference
④ Australian economic indicators
Employment statistics, RBA policy rate
⑤ If BOJ crosses 12:40
⑥ 4-hour and 1-hour horizontal line reached or just before reaching
⑦ After NY close, range break aiming for Tokyo start
⑧ Tokyo time in a range and the B-band widens from the European session
⑨ London FIX
and so on, I often enter reversals and follow-trends in extremely volatile situations.
Hedging positions also depend on personal preference, so there is no single rule.
Ultimately the aim is to finish with overall positive positions, but the first position being profitable as expected is best.
If you have hedging as part of the first decision, it reduces hesitation.
In a world where perfect trading does not exist, I want to utilize any essence that brings us a bit closer to perfection.
Thank you again today.
Genuine, no-cheat, real-method
↓
The scalping that billionaires are doing
↓
https://www.gogojungle.co.jp/tools/indicators/42559
Stress-free irregular hedging (well, you’ll hardly lose)
↓
https://www.gogojungle.co.jp/tools/ebooks/19435