

【June 29, 2023】Historical verification using the Sky and Earth indicators (USD/JPY)
Investment Navigator+ uses my developed“Heaven and Earth Indicator” for chart analysis, butthis time, instead of chart analysis,I would like to perform a backward test.
If it can be of any help to all of you, I would be grateful..

The Heaven and Earth Indicator is a trading method using an original indicator developed by me, Abusan, released in February 2022.
Thanks to everyone's support,「GogoJungle Award 2022 Winner」
※This article is a chart analysis using only the Heaven and Earth Indicator series.To keep beginners to advanced users on equal footing, traditional FX theories (Dow Theory, Fibonacci, Elliott Waves, cycle theory, price action, Grahnbill laws, etc.) are all ignored in this explanation. Please understand.
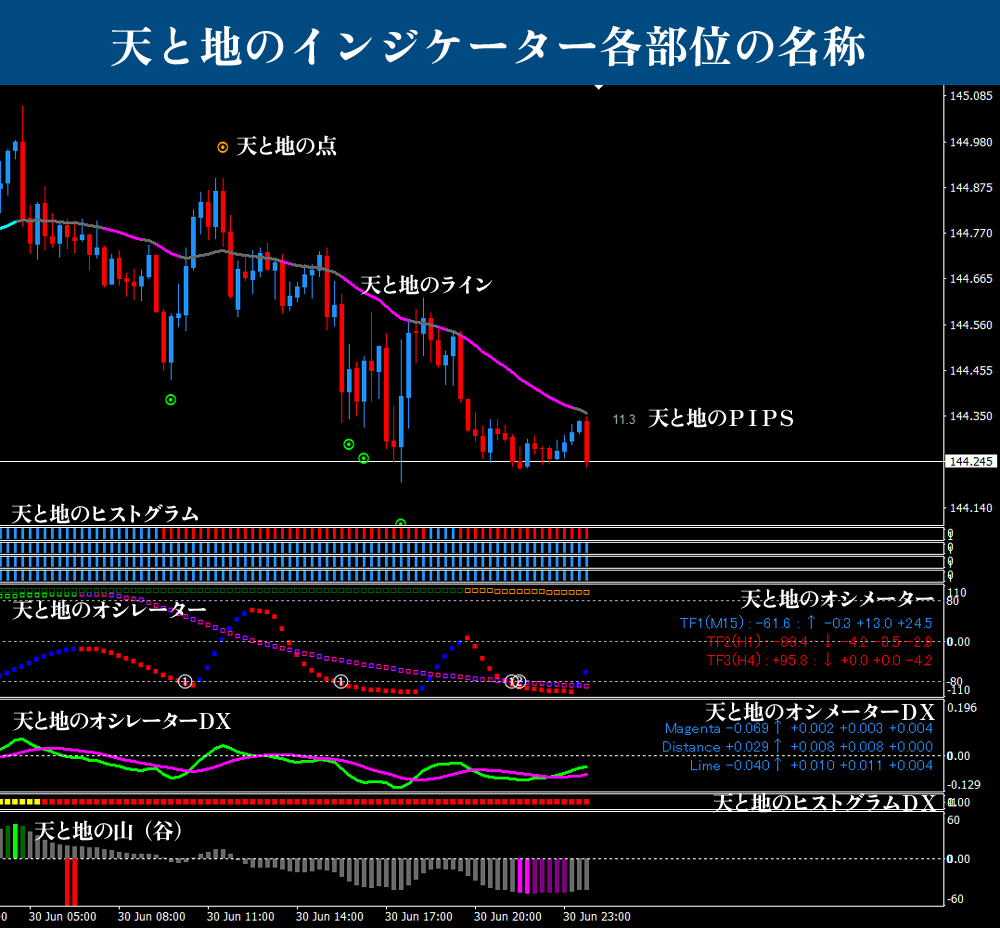
■ Heaven and Earth Indicators
https://www.gogojungle.co.jp/tools/indicators/35780
■ Heaven and Earth Mountains
https://www.gogojungle.co.jp/tools/indicators/37744
■ Heaven and Earth EA ~ Semi-discretionary Auto Trading System ~
https://www.gogojungle.co.jp/tools/indicators/43213
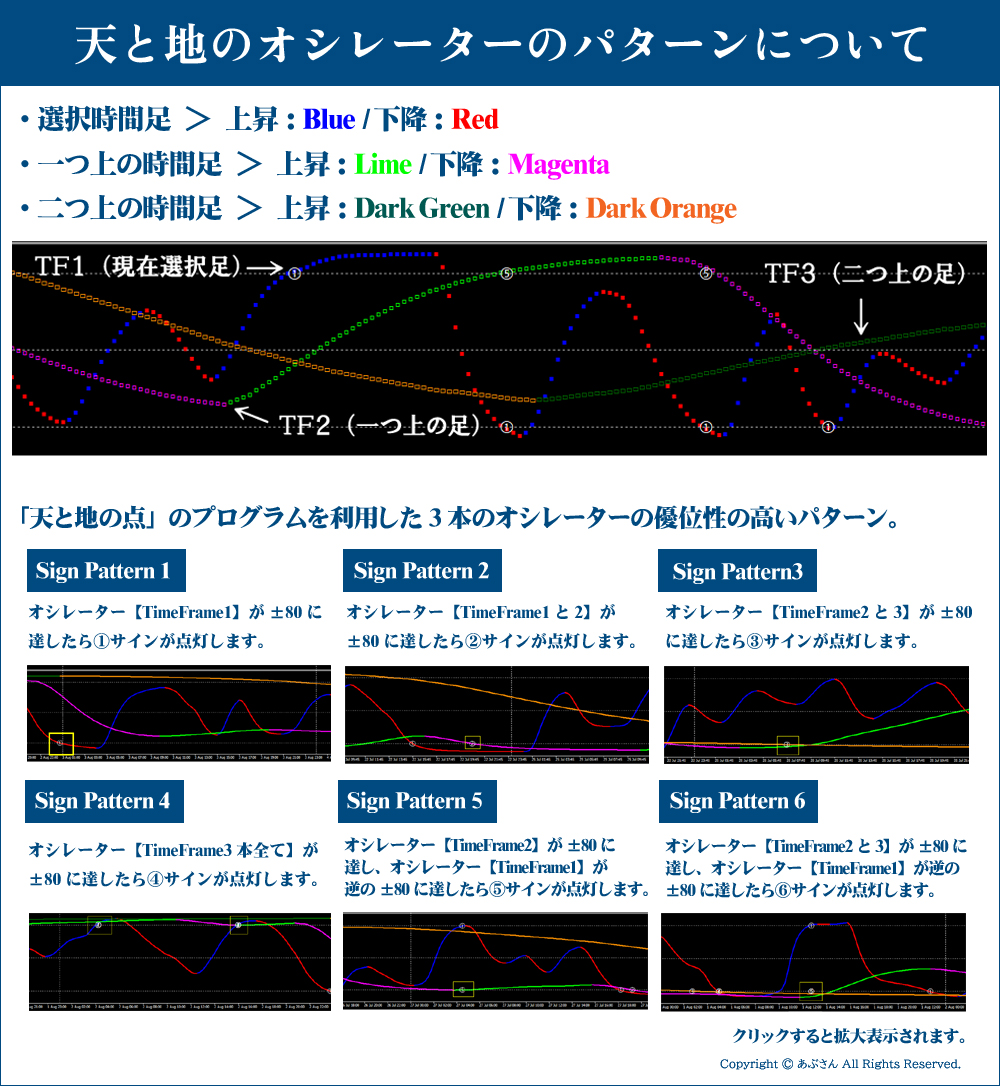
※For the specialized terms used on this blog, please refer to the sections below: “Names of the parts of Heaven and Earth Indicator” and “About the patterns of Heaven and Earth Oscillators.” If you have any other questions, please refer to the Heaven and Earth Indicator sales page for a general idea. Users should have no problems if they read the manual.
Thank you in advance!

Dollar-Yen 15-minute chart + 4-hour chart Backtest (June 27–29, 2023)
※Please look at the green vertical line. There is a green vertical line at the same location on the 15-minute chart as well. (Using the LINK LINE) I will explain how I think and actually enter trades at this vertical line.
■ 4-hour Chart (Context)
For a long period, a strong uptrend has continued. A sudden drop is scary, but as far as the oscillator shows, all are rising, and the histogram colors are all blue, indicating a bullish bias. Ideally, an oscillator reaching +80 would be likely to reverse, but in cases like this, from the oscillator, you can judge that the upward momentum has not yet weakened, and since this is a 4-hour chart, even a small rise can yield a large price move. That is what we aim for on the 15-minute chart.
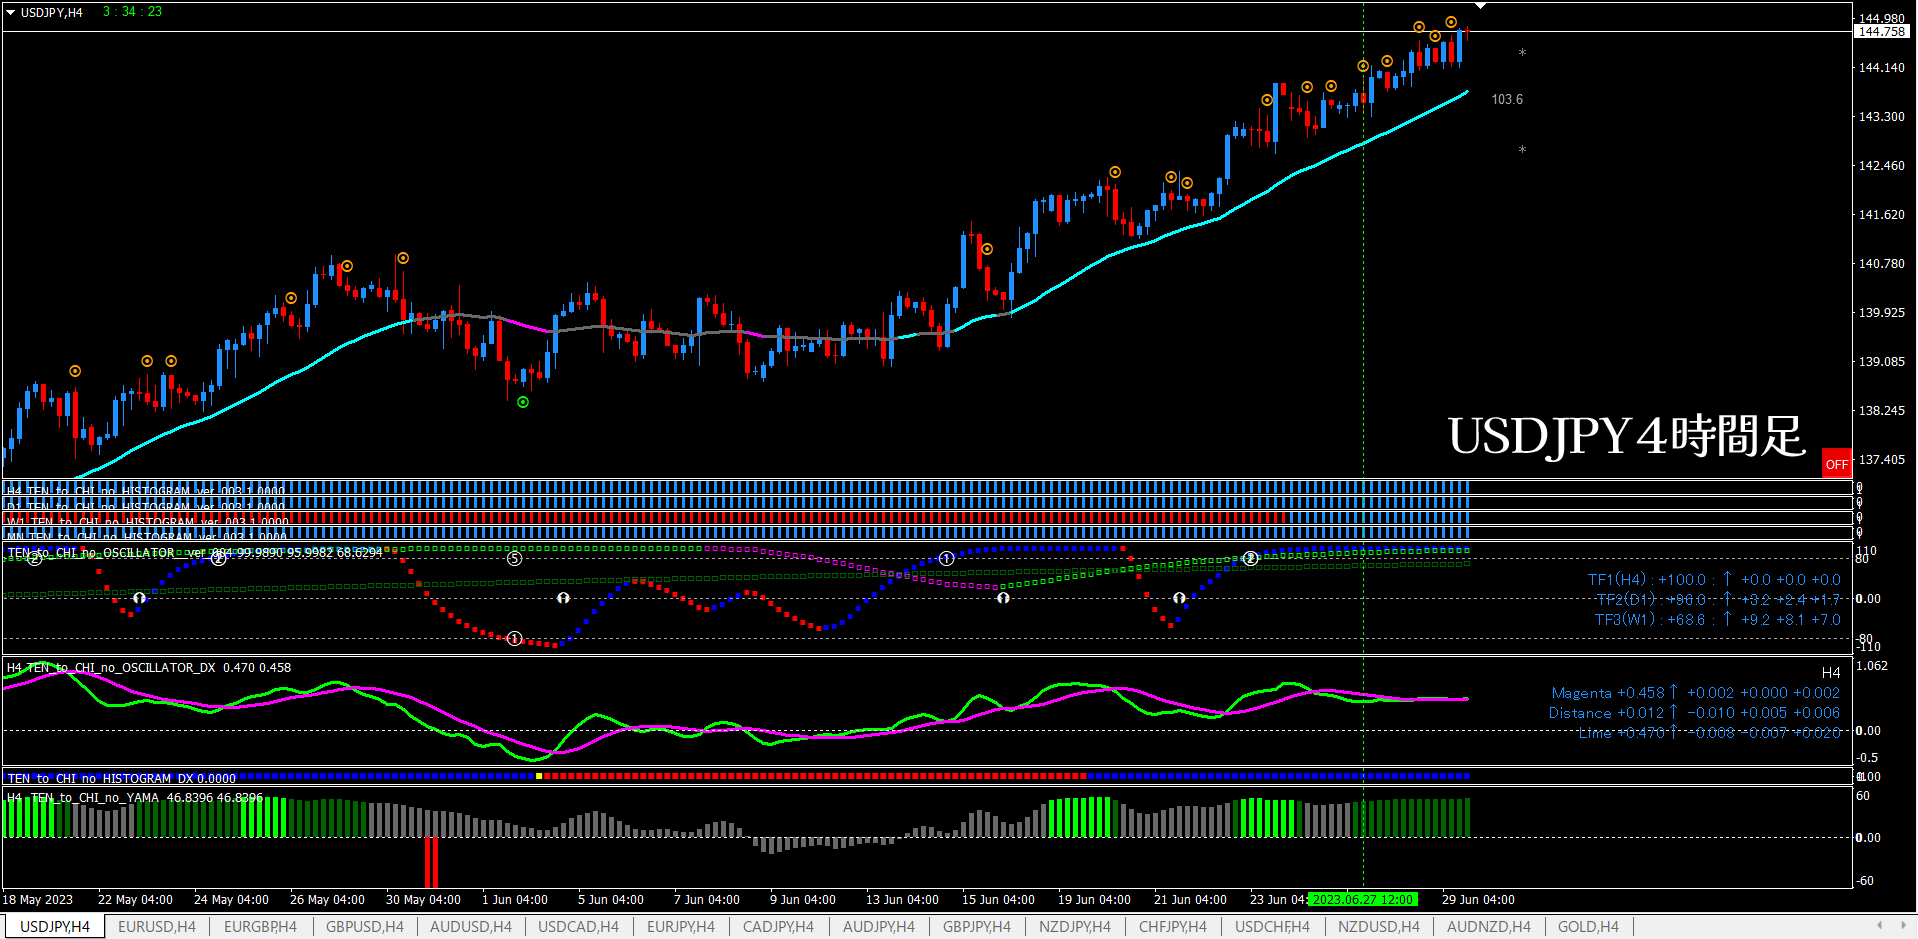
Since I judged the 4-hour chart to be strongly bullish, I will only go long. When a long entry signal appears, I will aim for even a small basis. This decision is possible thanks to the simultaneous monitoring method of 15-minute + 4-hour charts.
Enter on the alignment of Oscillator TF2 and Long Signal. This step is repeated until the oscillator values on the 4-hour are decreasing. All long entries have been quite smooth. The far-right long signal suggests momentum to the upside still continues
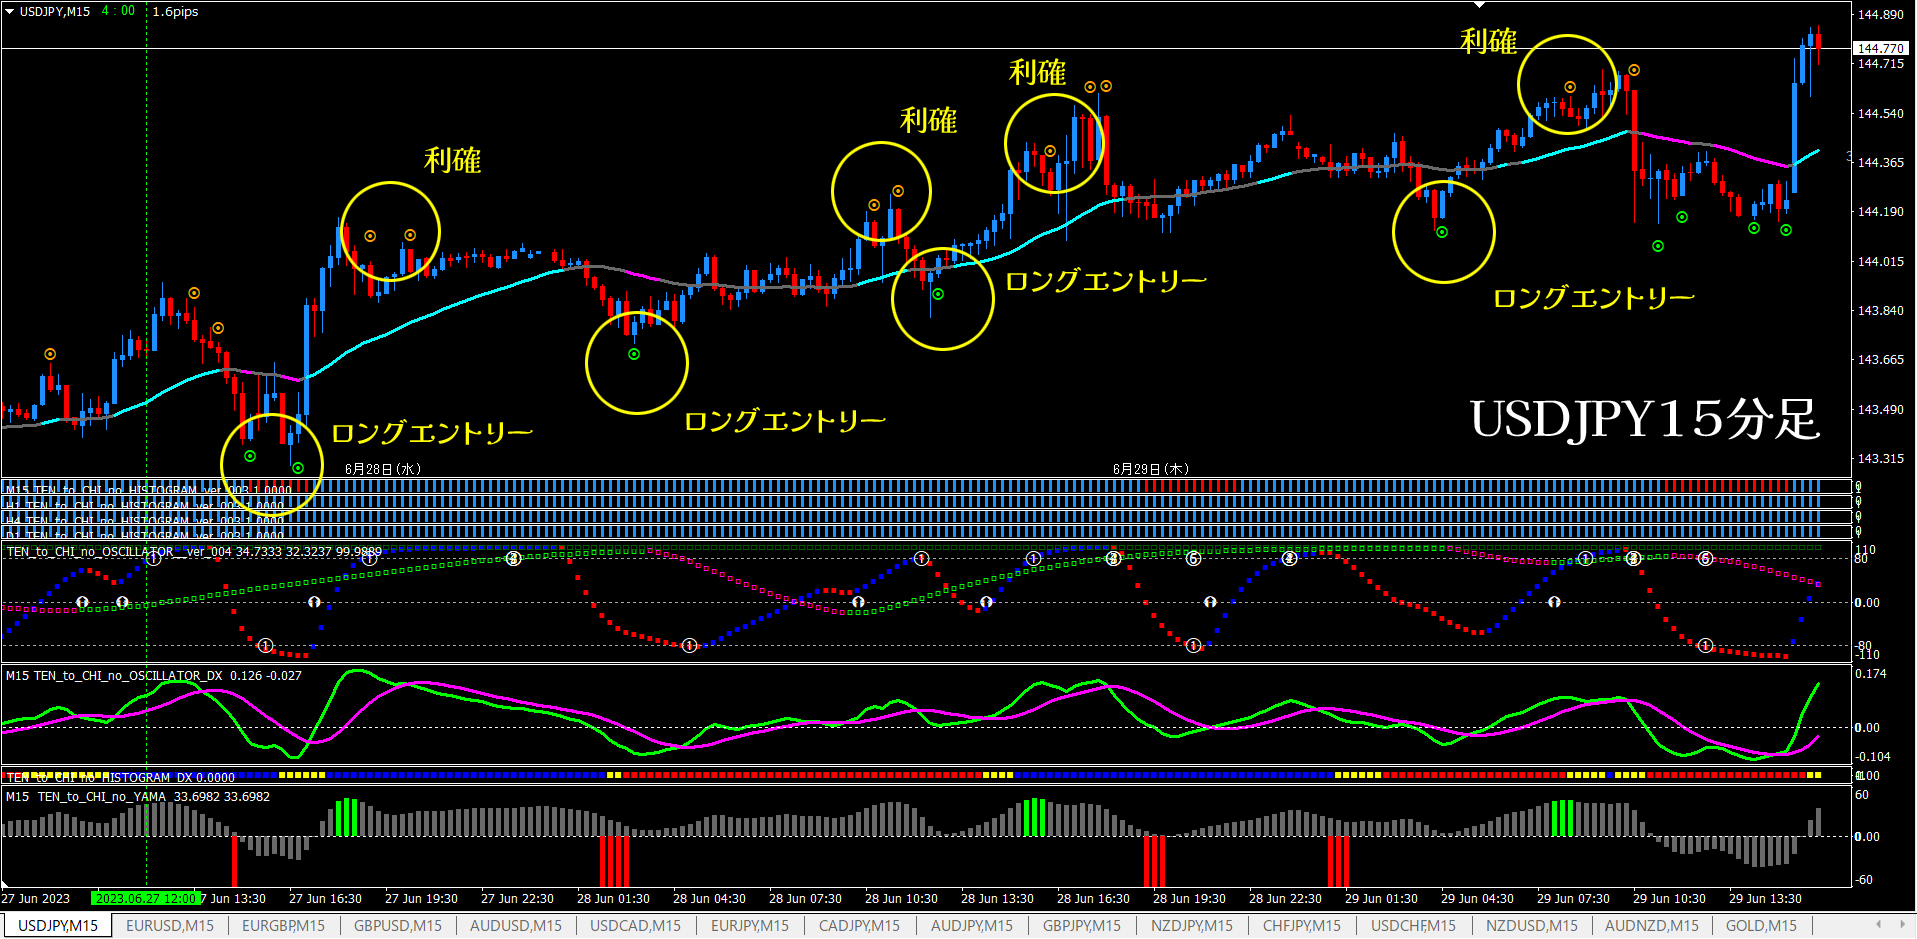
■ If using Heaven and Earth EA (on the 15-minute chart)
Once you can determine a strong rise on the 4-hour chart, the rest is easy. On the 15-minute chart you can use EA Pattern ①, ②, or ③.
As an example, we will use EA Pattern ①.
The setup should be when Oscillator TF2 turns green (lime). Just repeat this process over and over.

That is all.
I hope this is helpful.
