

Usage of the "Visualization Indicator" (Part 100)
Utilization of the "Visualization Indicator" (its100)
1. Further evolve the "28 Currency Pair List Indicator" into an indicator
“8CPVisualization Indicator”to drawGBPAUD.
The “8CPVisualization Indicator” includesOceaniaLondon edition,NewYork edition,AnyCP edition. This time, I used theOceania edition.
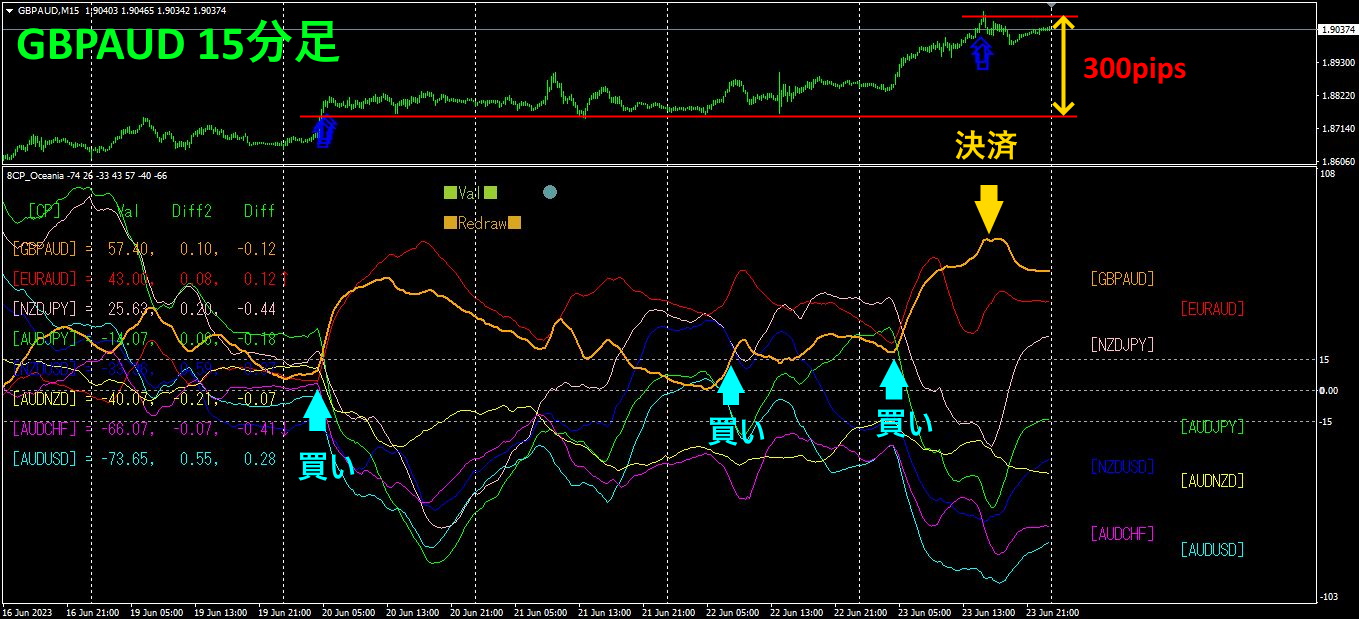
The upper half is theGBPAUD 15-minute chart. The arrows on the upper half indicate the alert positions of the “28 Currency Pair List Indicator”.CP Visualization Indicator”. The orange bold line graph corresponds toGBPAUD.
On Tuesday,GBPAUD broke above other chart groups, so I entered a buy. Later, I added to the position on Thursday and Friday, and will close on the weekend. From Tuesday to the weekend,about300pips of profitwas obtained.
2. Best SelectTry the indicator
The figure below is a screenshot dated2023 year June23日 00:43 (JST)
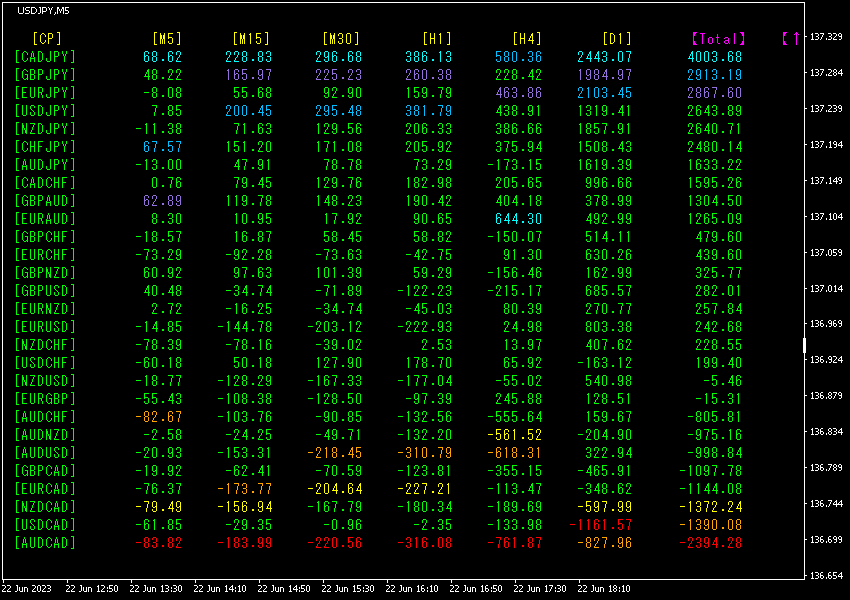
TotalSort the values in descending order. The top row,CADJPY is displayed in light blue on all timeframes, and theTotal value is4003.68, an extremely large number. has a strong upward trend.
Now, let's look at theCADJPY chart.
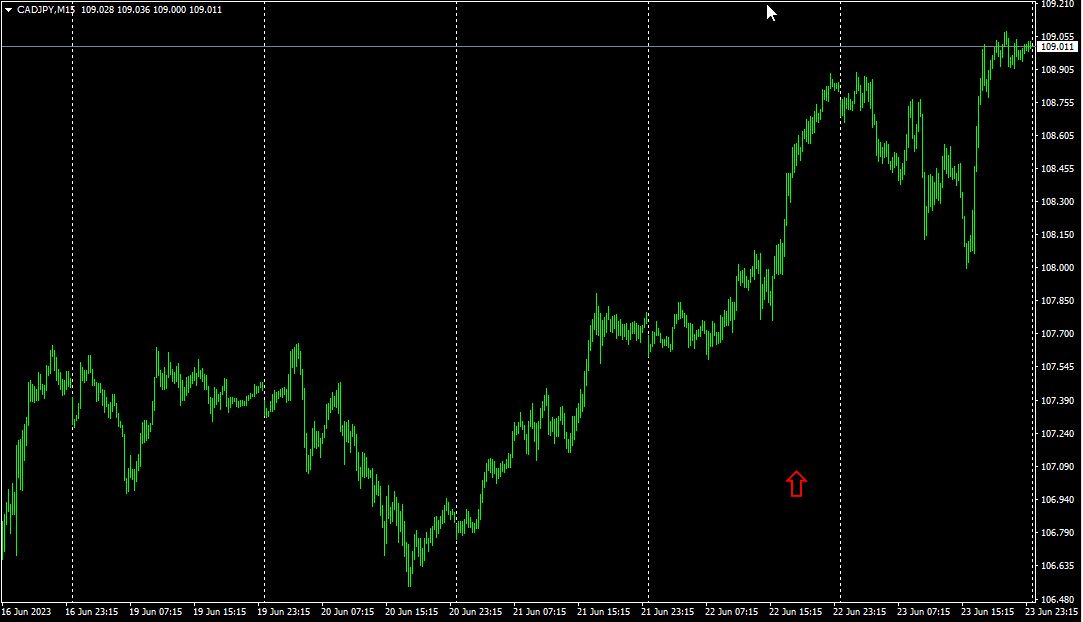
The red arrow marks the point where the screenshot was taken. It accurately captures the sharp rise within an uptrend.
The “28 Currency Pair Best Select indicator” enables easy identification of which currency among 28 pairs is exhibiting the strongest trend. It also tells you, with numbers and colors, whether you should trade now. It is a powerful indicator for evaluating trends across all currency pairs at a glance.
The “28 Currency Pair Best Select indicator”

https://www.gogojungle.co.jp/tools/indicators/35128
3. What happened to EURJPY, which I have been tracking since May of the year before last?
Since May 2021, EURJPY has been moving.
To view the overall trend, I’ve drawn about30 minutes of the latest about3 weeks on the 30-minute chart.
Last time, I wrote the following.
At the start of the week, both EUR and JPY were slightly downward, but afterwardEUR turned upward,JPY moved sharply downward. As a result,EURJPY rose significantly. In the future,JPY is likely to remain weak,EUR will stay strong, soEURJPY
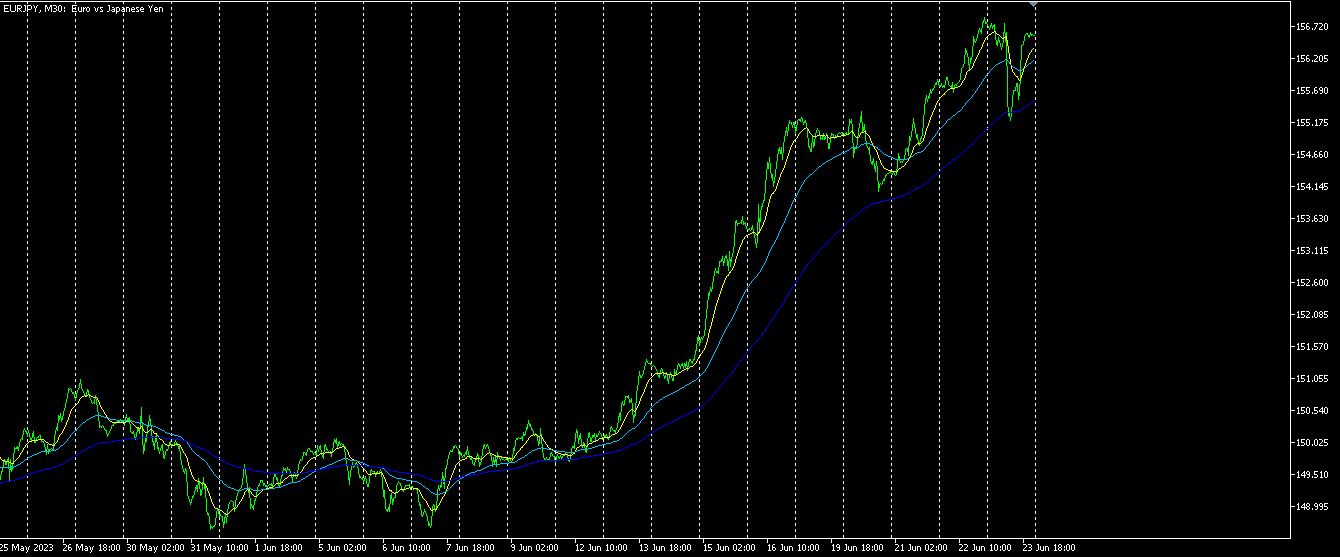
It continues to rise further.
4Timeframe currency strength chart.
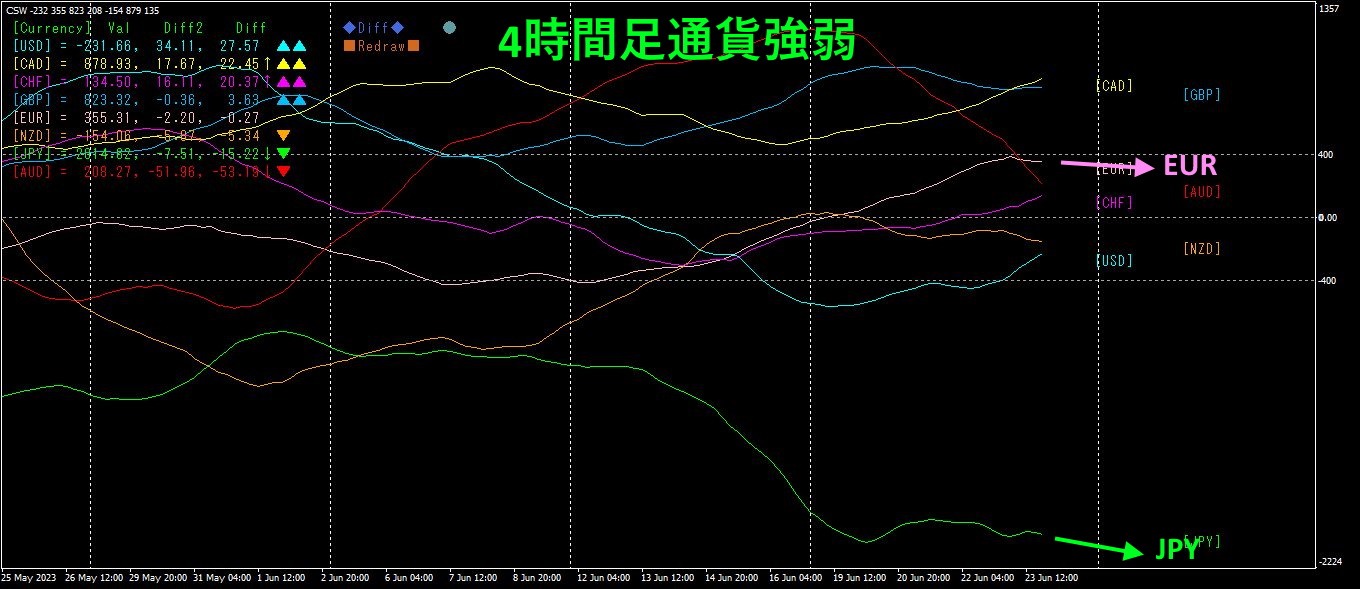
Pink isEUR, green isJPY.JPYEUR is also downward. Currently, the downward angle of is larger than that of. In the future, it is expected that will reverse and rise, so
4.
I am planning a trade strategy to “buy AUDJPY at the bottom.”
Last time,
The moving averageEMA20 did not break below and is rising. I believe it will continue to rise, so hold this position as is.
That is what was written.
4I will show the chart for the time frame.
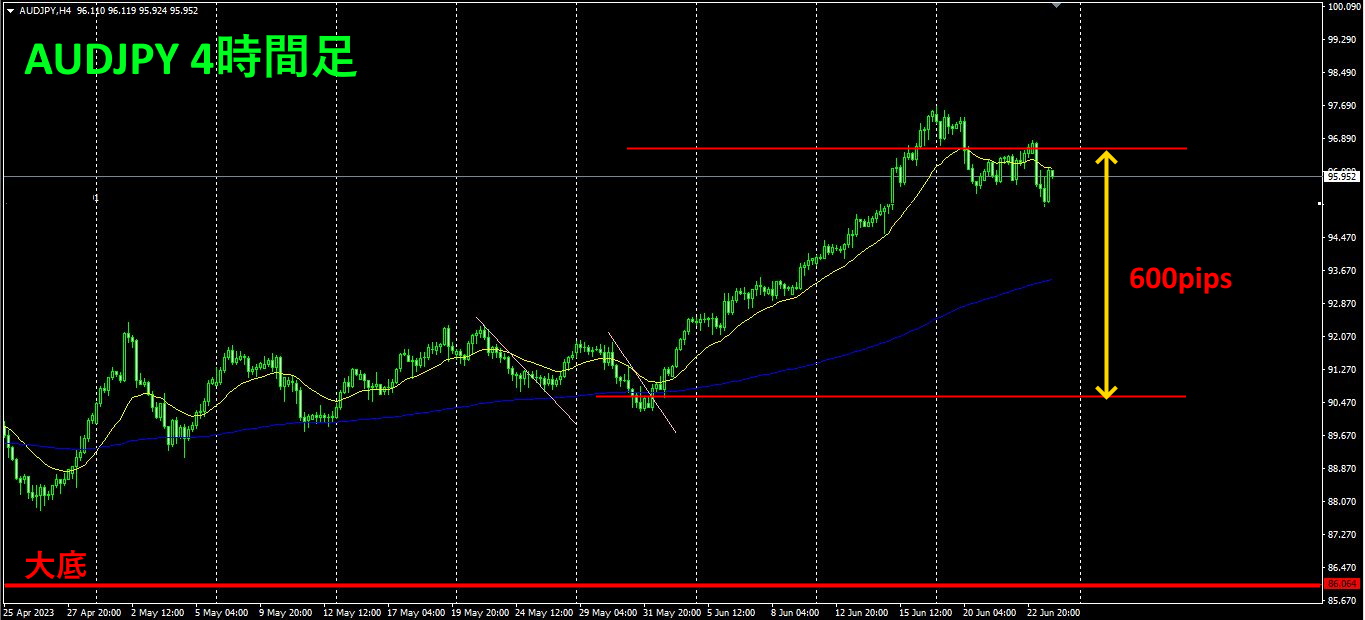
It rose further, but since it fell below theEMA20, I took profits. Profit was about600pips.
By simply repeating a straightforward trade of “buy after breaking above a diagonal descending line,” I secured a total of990pips in realized profit from steps ① to ⑤. Since I closed the position bought after breaking line ⑥, an additional600pips of profit was added, bringing the total to1590pips.
The previous daily high,2022 year9 month13 day98.512 is approaching, so I will end the series of “buying from the bottom” trades.
※“Trend Line EX”

https://www.gogojungle.co.jp/tools/indicators/42257
If you are interested in the “8C currency strength visualization indicator,” please refer to the following page.
MT4 edition https://www.gogojungle.co.jp/tools/indicators/39150
MT5 edition https://www.gogojungle.co.jp/tools/indicators/39159
【My Listed Products】


