

Utilizing the "Visualization Indicator" (Part 99)
Usage of the "Visualization Indicator" (its99)
1. Further evolve the "28 Currency Pair List Indicator" into an indicator
"8CPVisualization Indicator"to plotGBPJPY.
The "8CPVisualization Indicator" includesOceania版,London版,NewYork版,AnyCP版. This time, we used theLondon版.
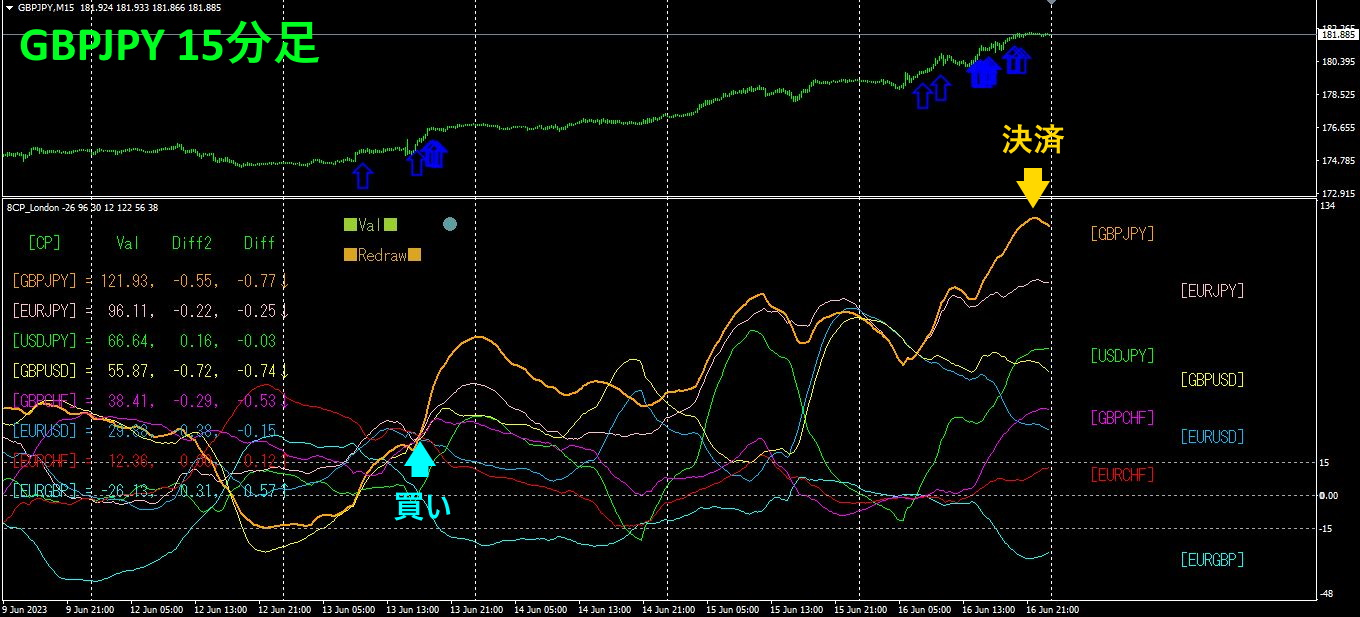
The upper half is theGBPJPY,15-minute chart. The arrows in the upper half indicate the alert positions of the28Currency Pair List Indicator. The lower half is from the8Visualization Indicator. The orange bold line chart corresponds toGBPJPY.
On Tuesday, GBPJPY rose above other chart groups, so I entered a buy. Since the uptrend continued, I held until the weekend to close. About620 pips profit was obtained.
2. Best SelectTry the indicator
The figure below is a screenshot taken on2023 June15 at14:28 (JST).
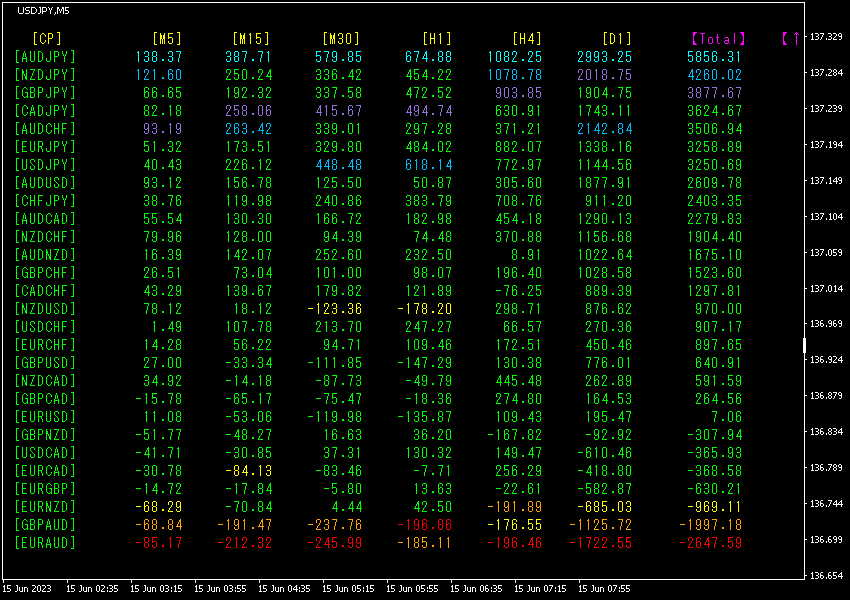
TotalThe values are sorted in descending order. In the topmost row,AUDJPY is displayed in light blue on all timeframes,Total value is5856.31, indicating an extraordinarily large number.AUDJPY shows a strong uptrend.
Now, let's look at theAUDJPY chart.
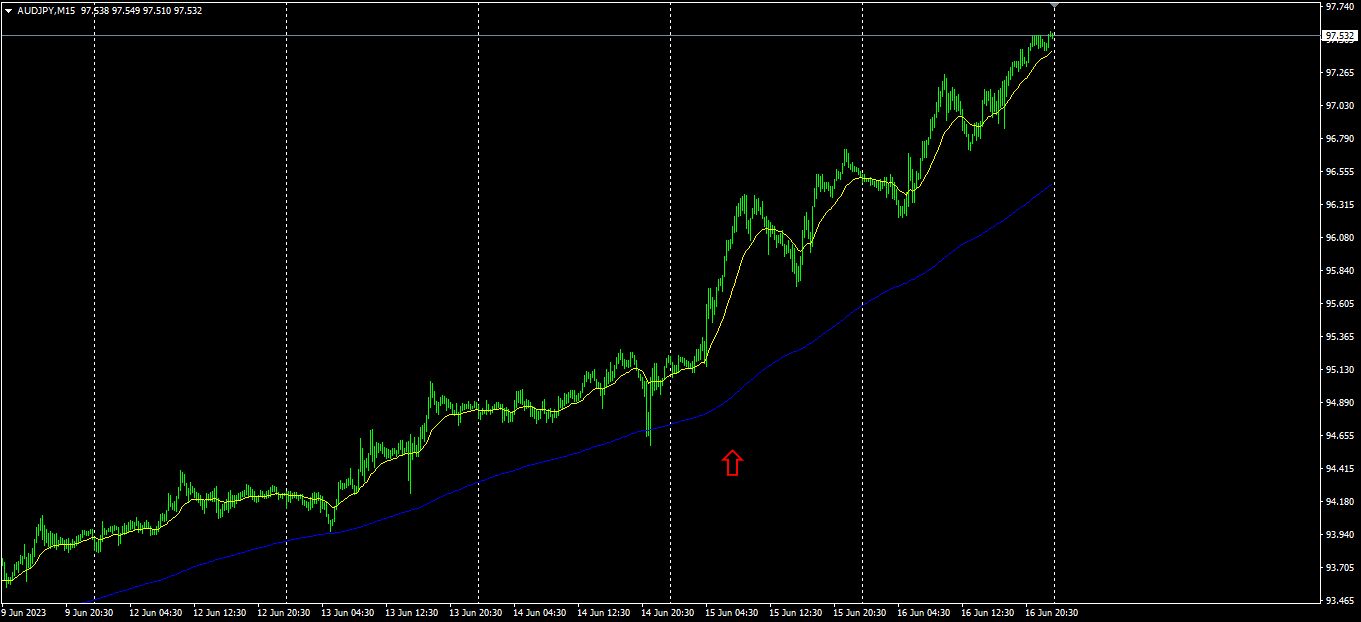
The red arrows mark where the screenshot was taken. It has been in a continuous upward trend with a particularly sharp rise captured. In such a chart pattern, buying at any point would be profitable—the "delicious market."
The"28 Currency PairsBest Select
The"28 Currency PairsBest SelectIndicator"

https://www.gogojungle.co.jp/tools/indicators/35128
3. Since May of the year before last, what happened with EURJPY?
From 2021 year5 monthEURJPY movement is being tracked.
To view the overall trend,30-minute chart covering about the last3 weeks is drawn.
Previously, I wrote the following.
EUR and JPYEURJPY is expected to move in a range..
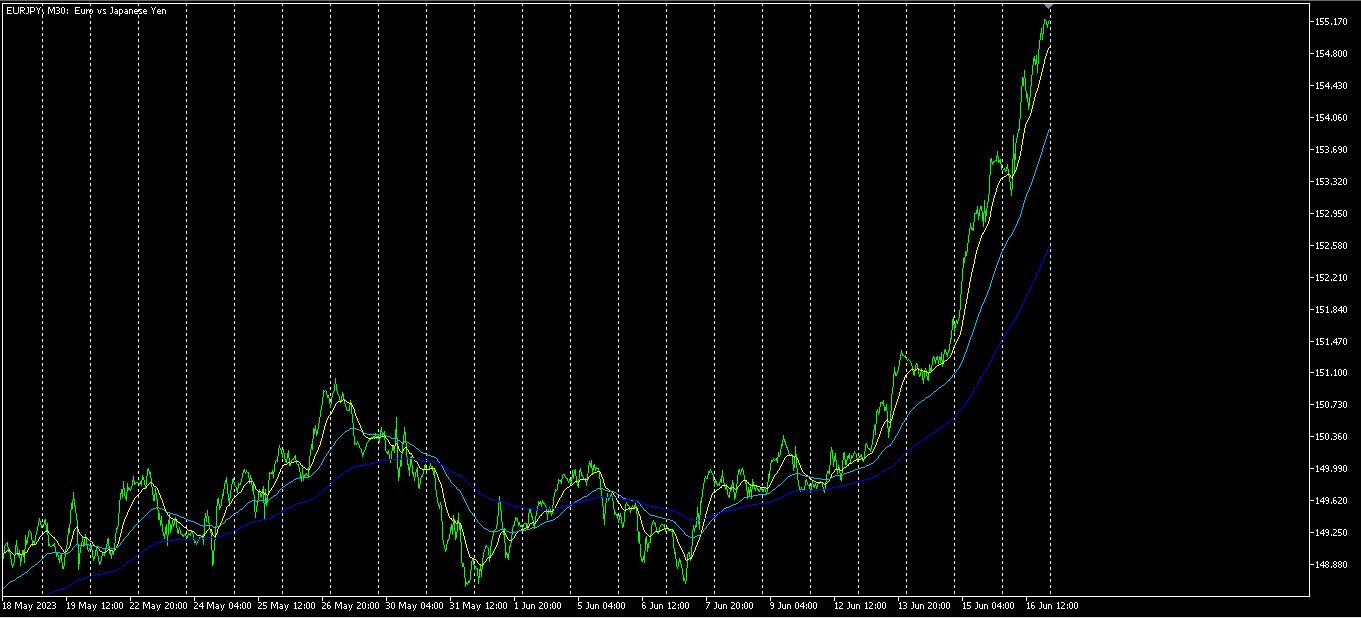
It rose sharply.
4-hour currency strength chart.
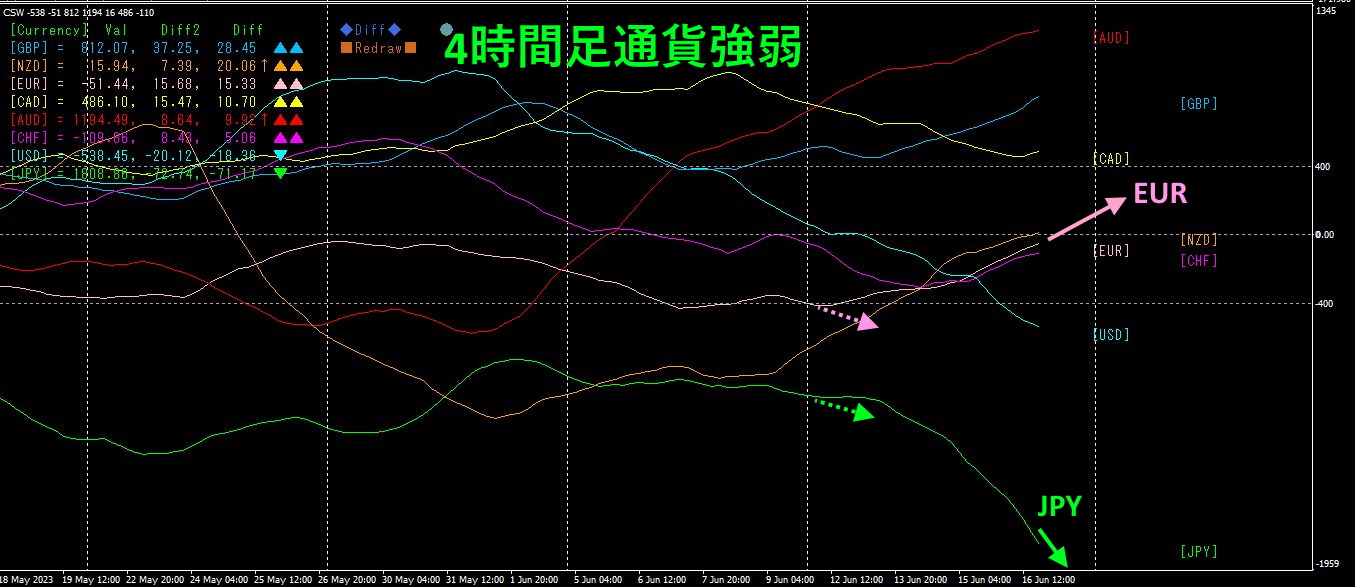
Pink isEUR, green isJPY. At the start of the week,EUR andJPY both trended slightly downward, but thenEUR moved up, andJPY fell sharply. As a resultEURJPY rose significantly. Going forward,JPY is weak andEUR is strong, so theEURJPY trend remains upward.
4. Look for peaks and troughs across all currency pairs and develop a trend strategy (continued)
We are planning a trading strategy to buyAUDJPY at a market bottom.
Last time,
the moving averageEMA20 was not breached and the price rose. It is expected to rise further, so continue holding.
That is what I wrote.
4-hour chart is shown.
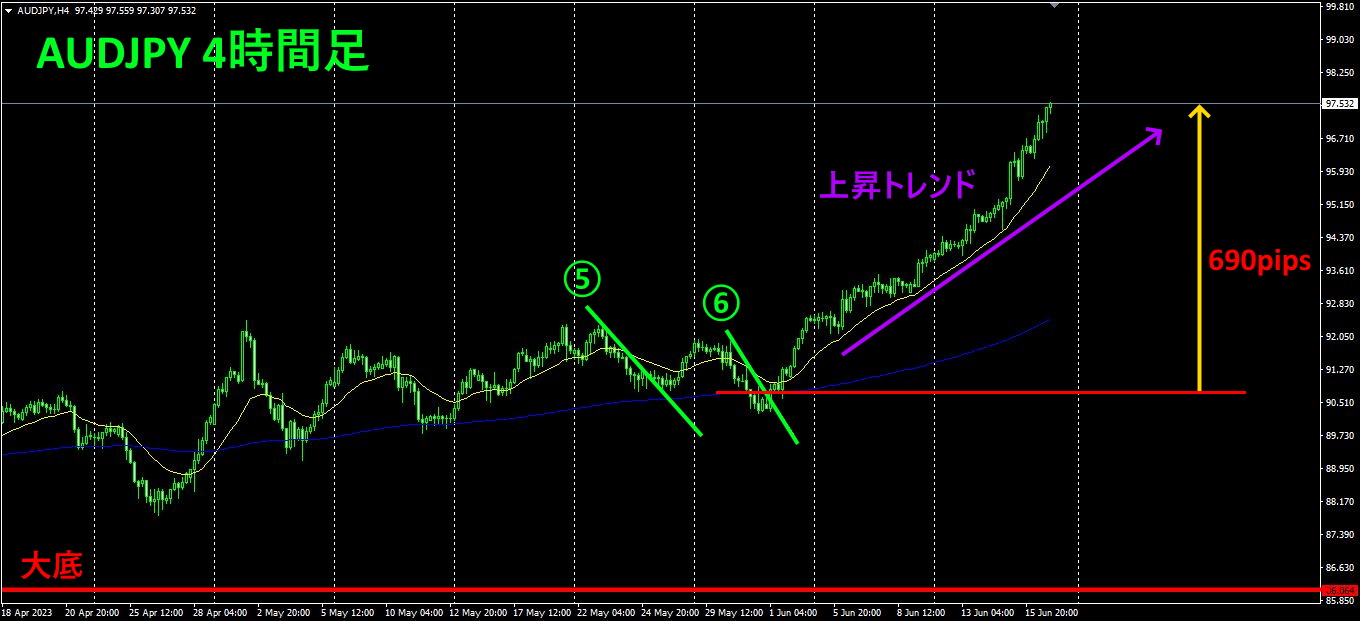
It rose at an even steeper angle. Unrealized gains increased to690 pips.
By simply repeating a straightforward trade of “break above the diagonal down-trending line to buy,” the total of profits from ① to ⑤ reached990 pips. Since I bought after the sixth line breakout, unrealized gains are690 pips and are still growing.
The moving averageEMA20 is still rising without being breached. It is expected to rise further, so keep holding.
If you ownTrend Line EX, enabling automatic profit-taking on trendline breaks or on EMA20 breaks will let you reap small profits while you wait.
※“Trend Line EX

https://www.gogojungle.co.jp/tools/indicators/42257
For those interested in the8C Currency Strength Visualization Indicator, please refer to the following page.
MT4 version https://www.gogojungle.co.jp/tools/indicators/39150
MT5 version https://www.gogojungle.co.jp/tools/indicators/39159
【My listed items】


