

A hundred million traders are scalping
Good morning everyone.
Regarding the messages received last night, I have just replied to all of them, so please let me know if you have not received a message.
As for last night's US CPI indicators, it moved as much as the previous employment statistics.
Recent CPI is dangerous, isn't it?
A few years ago, with such moves, I would lay out a bottom and top as a contrarian gambler’s trade, but recently I have stopped doing it altogether.
If I were to gamble, I would stand by from 22:23 (white vertical line) and go long after 22:30 (yellow square), with a stop at 13917. (Red horizontal line ~ two pips below)
From just after 22:30, this is the kind of scenario.
If you are a scalping user of a billionaire trader, by looking closely at the chart you can easily tell what I’m saying.
I hope you compare it with your own chart.
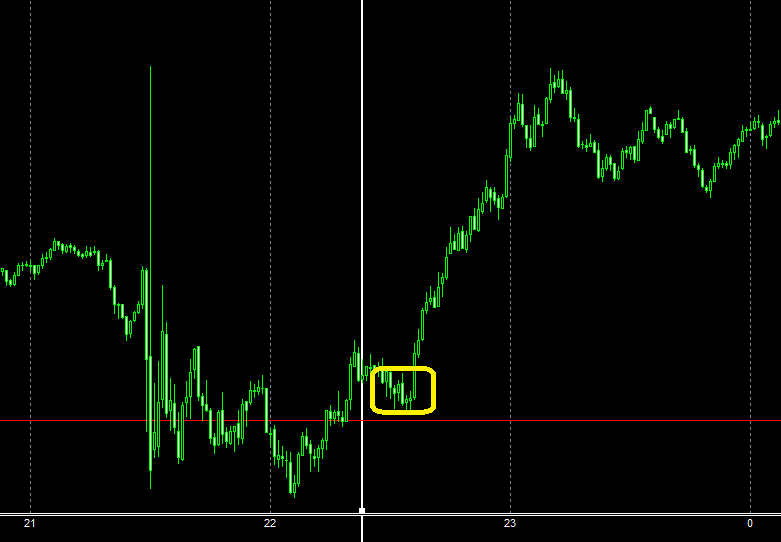
This position is to catch the initial movement likely to rise, but it may break 13917 many times.
No matter how many times it breaks below, if it breaks above this level, I will take positions again and again.
Until it goes up.
As it rises, raise the stop and wait with arms folded until the buy/sell switch occurs.
For the initial move when the buy/sell switch occurs, I view it like this, but for manual purchasers or traders with little experience, please trade according to the manual first.
For those with a decent amount of experience,be sure to set stops and stop losses, and you may try this initial move.
In this situation, those who cannot cut losses when it breaks below tend to have optimistic hopes.
And then it declines, expanding the losses...
If the price breaks the low after 22:00, all is lost.
This time the rise happened due to upward volatility, so it was just a fortunate rise.
And last night after CPI, there were two manual trading points.
Long positions after the NY start.
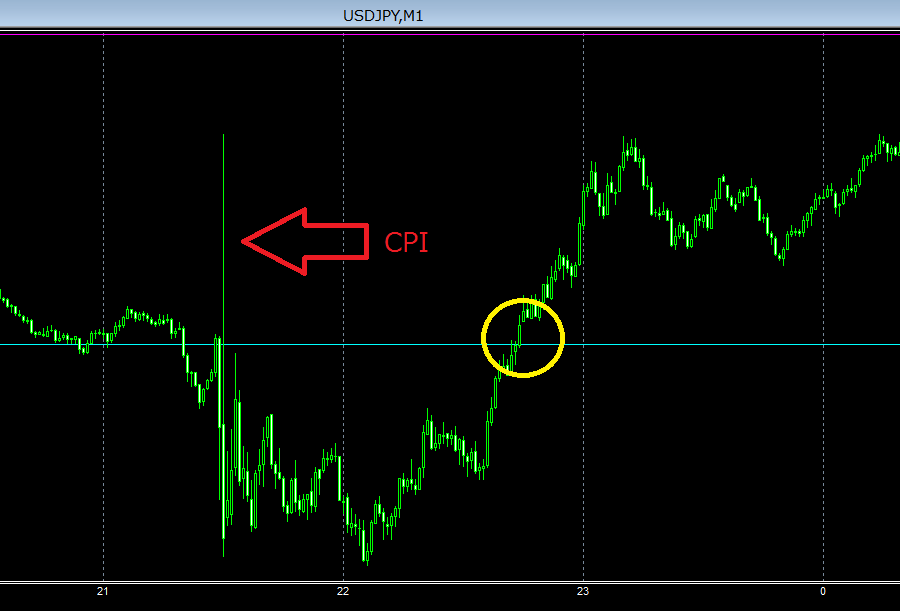
The rise is after 2 o’clock.
These two instances, as you can see, were almost a one-sided sense of dollar selling movement, so there was little room for downside.
Therefore, there were few moments where a line could be drawn.
But with such a big rise volatility, going long was probably easy.
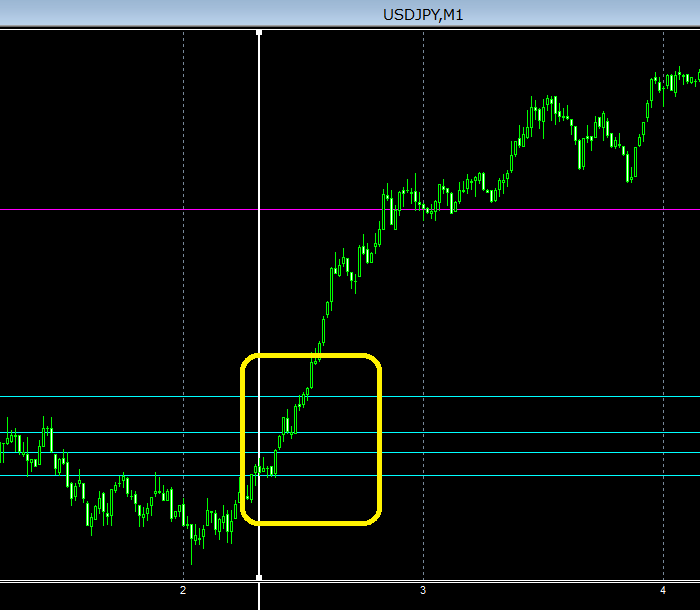
The part after midnight switching is a scene where you can do the “initial move” mentioned earlier.
The environment where the initial move tends to hit is when there is a persistent strong dollar selling and dollar buying.
It is not about buying or selling dollars.
If you don’t understand from the chart, introducing a currency strength indicator can give you a feel (it’s available for free).
The “yen” is the key, and the same applies not only to USD/JPY but to other yen pairs as well.
Looking at GBP/JPY in the same way, after building positions it rose by about 150 pips.
In such a scenario, if you can stack 1,000 contracts, it becomes a big trade.
This is also why I like the pound.
Tonight there is a big event, the FOMC and Powell.
If, like yesterday, the afternoon drifts in a horizontal range resembling a fishbone, it will break in either direction and widen the range.
I think opening positions in the direction of that breakout tends to lead to profits.
Before that, there will be the recently vigorous US Producer Price Index release.
Now, I wonder what will happen...
As of 10:15, USD/JPY
Because FOMC is coming, you don’t have to trade aggressively, but it is typical for USD/JPY to retrace after rising in the previous night...
USD/JPY short breakout 5-minute chart
13997
13993
13983
13968
13958
13951
Thank you again today.
Scalping by billionaire traders
↓
https://www.gogojungle.co.jp/tools/indicators/42559
Stress-free irregular hedging (well, you probably won’t lose)
Unusual hedging in FX
↓
https://www.gogojungle.co.jp/tools/ebooks/19435