"Ten-doライン" captures market bottoms and tops at the perfect timing with an FX indicator!

※ Notice of product version upgrade completed on May 21, 2023 (Ver.2)
In addition to the optimal deviation rates by currency for the 4-hour chart released in Ver.1,
we have included and added the optimal deviation rates by currency for the 15-minute and 1-hour charts in the product file, and we would like to inform you.
※ Notice of product version upgrade completed (Ver.1)
On May 2, 2023, the product manual was included and the optimal deviation rates by currency were published.
The product manual is bundled with the product file you purchase.
Also, the optimal deviation rates by currency are posted at the bottom of this page.
Thank you very much for your continued support.
Special video! Commemorative discount for interview appearance!
From today until the end of May29,800 yen→ 19,800 yen
will be announced.
Interview video (Part 1) is here ↓
Interview video (Part 2) is here ↓
※This product is for online community members only※

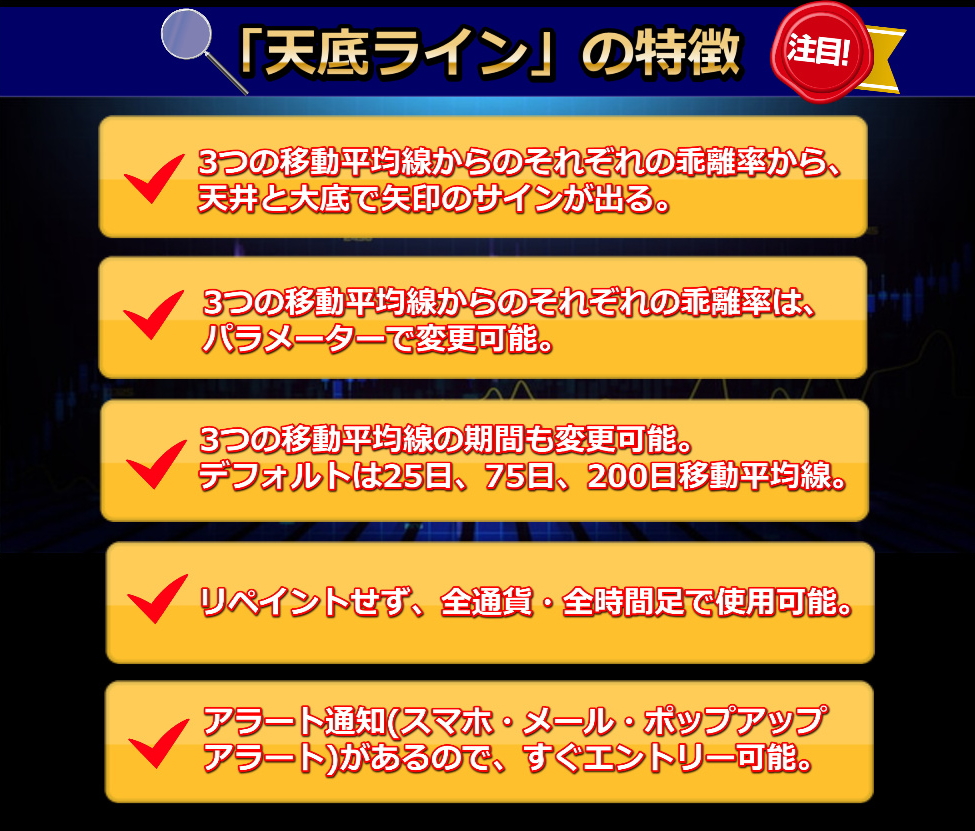
The “Tento Line” is an MT4 indicator that captures market bottoms and tops at perfect timing.
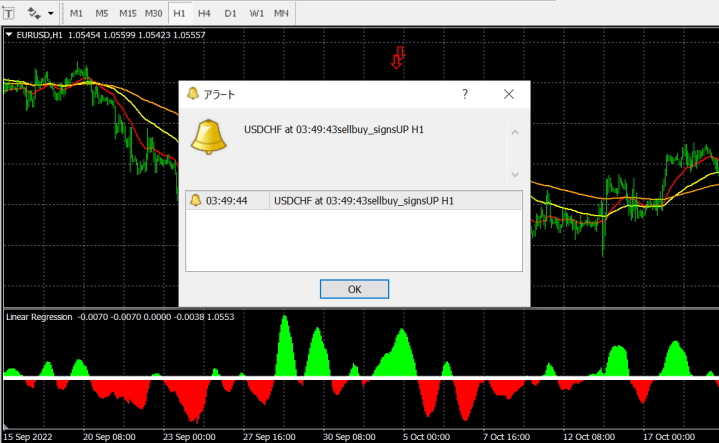
From the deviation rates of each of the three moving averages, it generates bottom and top signals. Moreover, when a signal is issued alert notifications (smartphone, email, popup alerts) will be issued, so once a signal appears, you just enter.
I have used and developed hundreds of indicators, but I believe the accuracy and win rate of this indicator are the best.By using this indicator, there are many times you can gain 100 pips or more in one day.


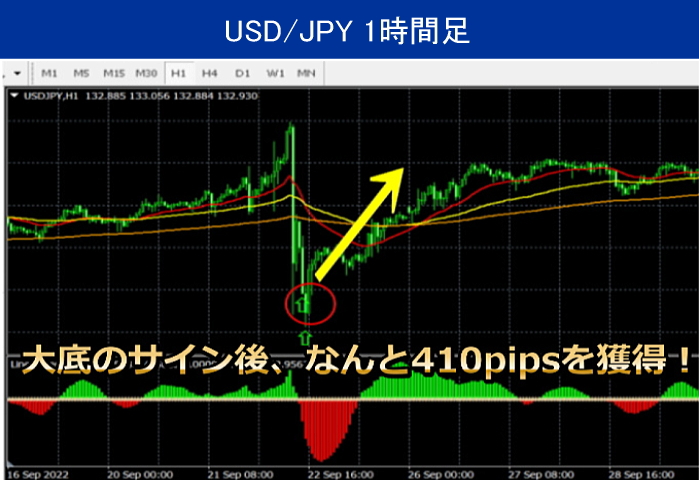
You rose sharply from the bottom signal. 410 pips were captured!
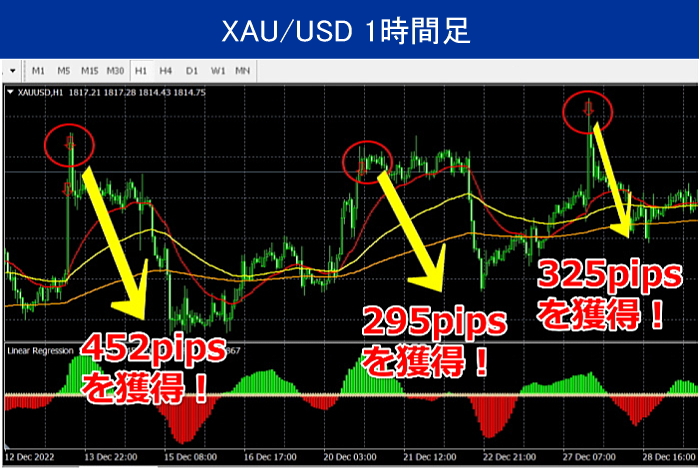
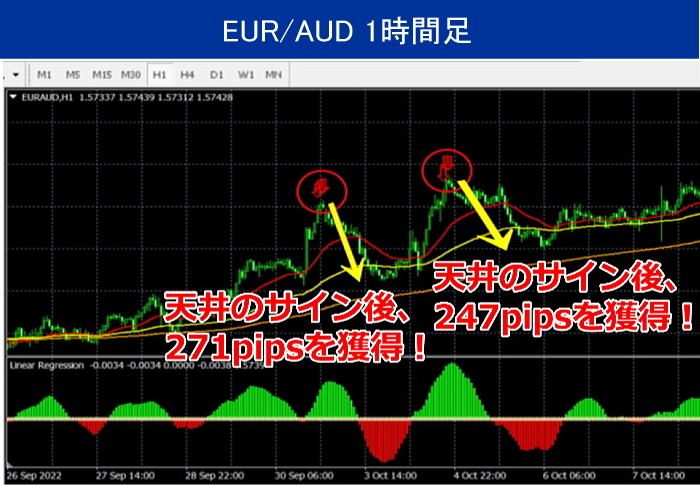
You dropped sharply from the top signal. Maximum 452 pips were captured!
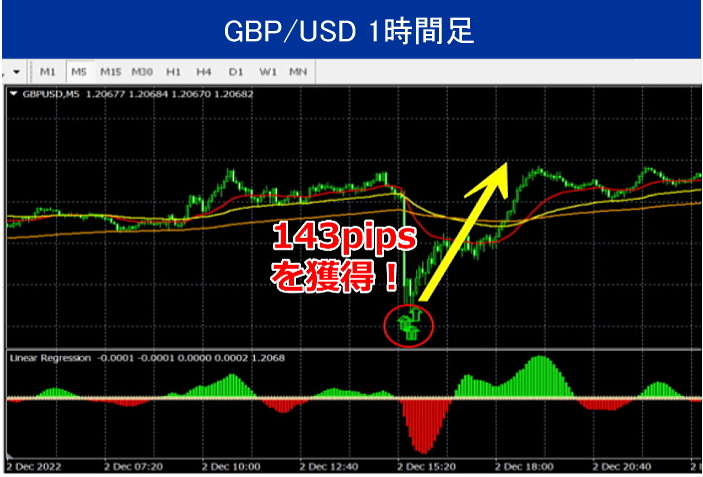
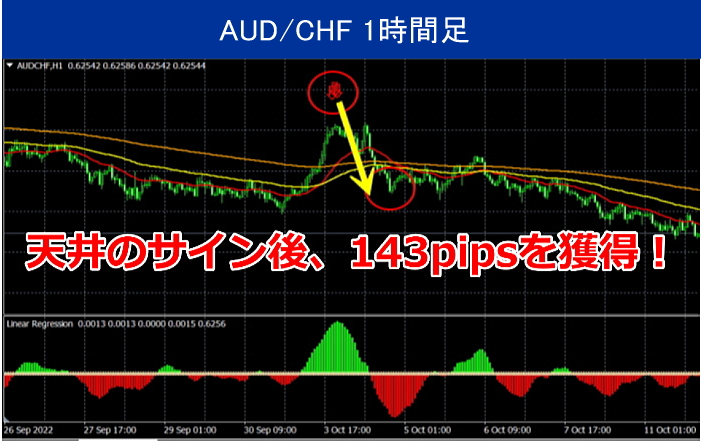
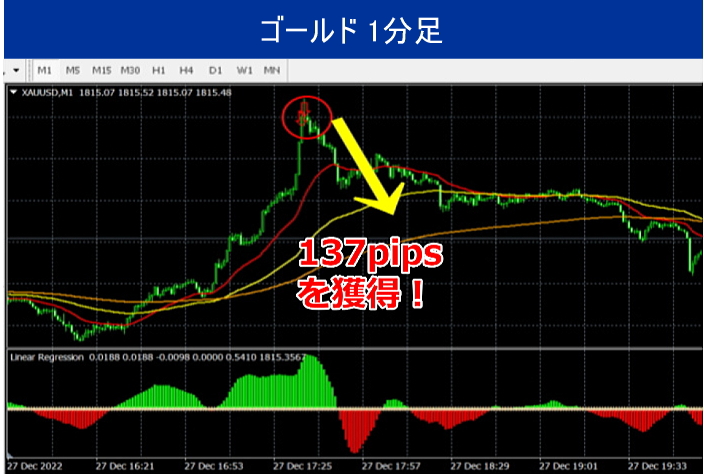
You rose sharply from the top signal. 143 pips were captured!
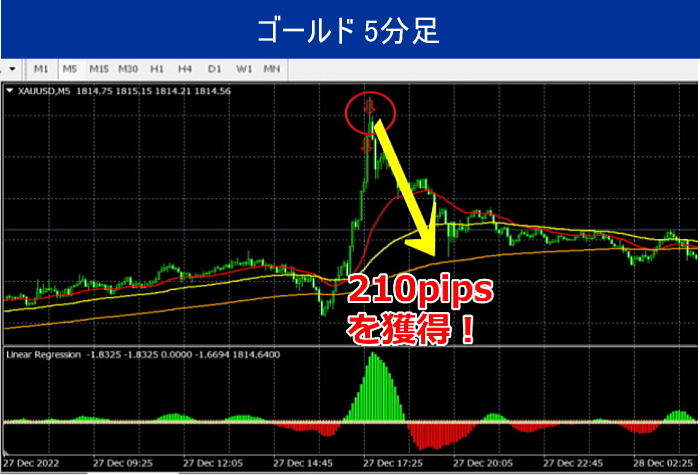
You dropped sharply from the top signal. 210 pips were captured!
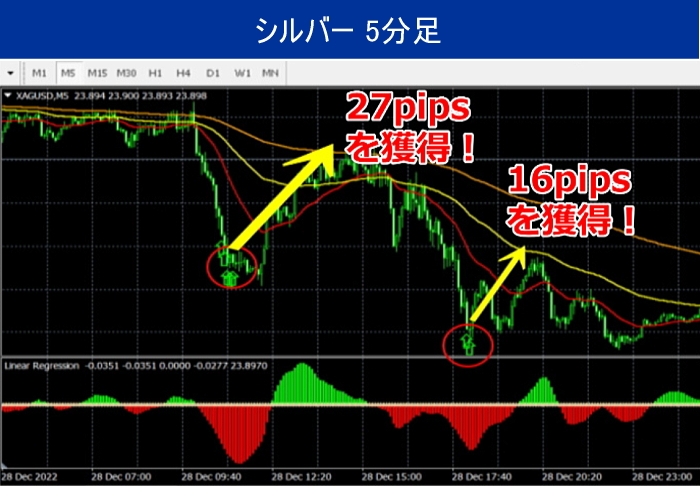
You rose sharply from the top signal. Total 43 pips were captured!

After this setup, arrows will continue to appear at similar optimal timings.

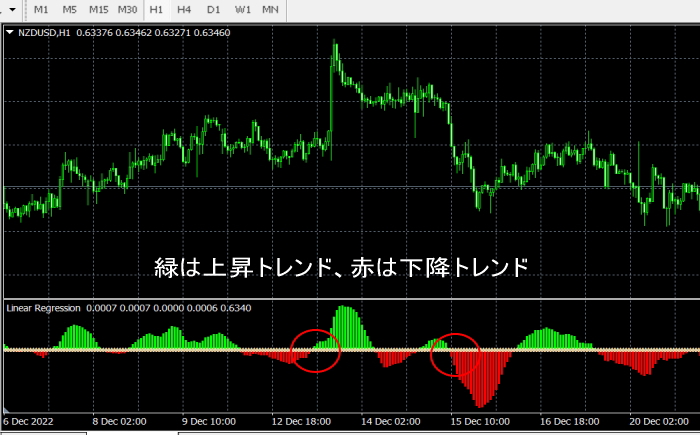
An indicator that shows the contraction of the Bollinger Bands by color is also included. Green indicates buy, red indicates sell signals.
Please configure the deviation rate for each currency pair using the settings below. You can change the red-framed areas below.
For example, USD/CHF: buy and sell EMA Deviation% -1.0, 1.0, the above 6 points, the top three -1.0, the bottom three 1.0 please set to.
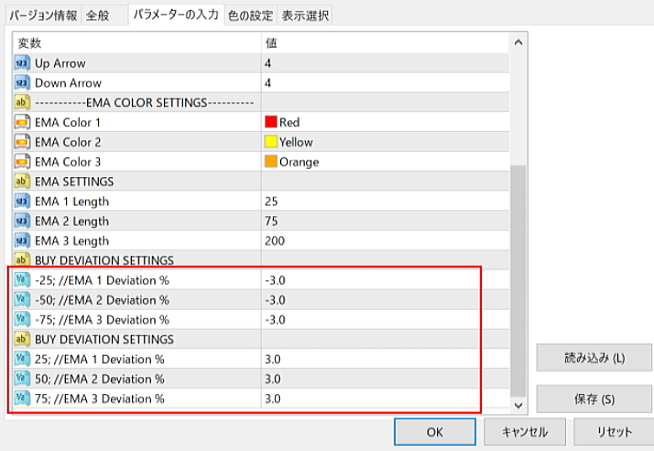
If there is no signal on the short-term chart, please adjust by setting the deviation rate to 0.05, etc.
This is a figure assuming a 4-hour chart
USD/CHF: buy and sell EMA Deviation% -1.0, 1.0
GBP/USD: buy and sell EMA Deviation% -1.0, 1.0
EUR/USD: buy and sell EMA Deviation% -1.0, 1.0
USD/JPY: buy and sell EMA Deviation% -2.0, 2.0
USD/CAD: buy and sell EMA Deviation% -1.6, 1.6
AUD/USD: buy and sell EMA Deviation% -1.9, 1.9
EUR/GBP: buy and sell EMA Deviation% -1.9, 1.9
EUR/AUD: buy and sell EMA Deviation% -1.9, 1.9
EUR/CHF: buy and sell EMA Deviation% -1.0, 1.0
EUR/JPY: buy and sell EMA Deviation% -1.8, 1.8 or -1.9, 1.9
GBP/CHF: buy and sell EMA Deviation% -2.0, 2.0
CAD/JPY: buy and sell EMA Deviation% -2.0, 2.0
GBP/JPY: buy and sell EMA Deviation% -2.3, 2.3
AUD/NZD: buy and sell EMA Deviation% -1.0, 1.0
AUD/CAD: buy and sell EMA Deviation% -1.0, 1.0
AUD/CHF: buy and sell EMA Deviation% -1.4, 1.4
AUD/JPY: buy and sell EMA Deviation% -1.9, 1.9 or -2.1, 2.1
CHF/JPY: buy and sell EMA Deviation% -2.3, 2.3
EUR/NZD: buy and sell EMA Deviation% -2.3, 2.3
EUR/CAD: buy and sell EMA Deviation% -1.6, 1.6
CAD/CHF: buy and sell EMA Deviation% -1.6, 1.6
NZD/JPY: buy and sell EMA Deviation% -1.9, 1.9 or -2.1, 2.1
NZD/USD: buy and sell EMA Deviation% -2.1, 2.1
NZD/CAD: buy and sell EMA Deviation% -1.6, 1.6
SILVER: buy and sell EMA Deviation% -6.0, 6.0
GOLD: buy and sell EMA Deviation% -3.0, 3.0
GBP/NZD: buy and sell EMA Deviation% -3.0, 3.0
GBP/CAD: buy and sell EMA Deviation% -3.0, 3.0
GBP/AUD: buy and sell EMA
Deviation% -3.0, 3.0
Dow Jones Average (US30) buy and sell EMA
Deviation% -2.0, 2.0
Nasdaq NASDAQ (USTECH) buy and sell EMA
Deviation% -3.3, 3.3
S&P 500 Index (US500) buy and sell EMA
Deviation% -2.0, 2.0
Nikkei Average (JP225) buy and sell EMA
Deviation% -2.0, 2.0
Bitcoin (BTCUSD) buy and sell EMA
Deviation% -9.0, 9.0
Dollar Index buy and sell EMA
Deviation% -2.0, 2.0
Oil (USOIL) buy and sell EMA