

[June 11, 2023] Chart analysis using the sky and earth indicators
Investment Navigator+ uses my developed「Heaven and Earth Indicators」 chart analysis.
I hope it will be of some help to everyone.I would be grateful.

Heaven and Earth Indicator is a trading method using original indicators I, Abu-san, developed, released in February 2022.
Thanks to everyone's support,「GogoJungle Award 2022 winner」
※This article is a chart analysis using only the Heaven and Earth Indicator series. To ensure fairness for beginners to advanced users, I explain without reference to common FX theories (Dow theory, Fibonacci, Elliott Wave, cycle theory, price action, Granville's rules, etc.). Please understand.
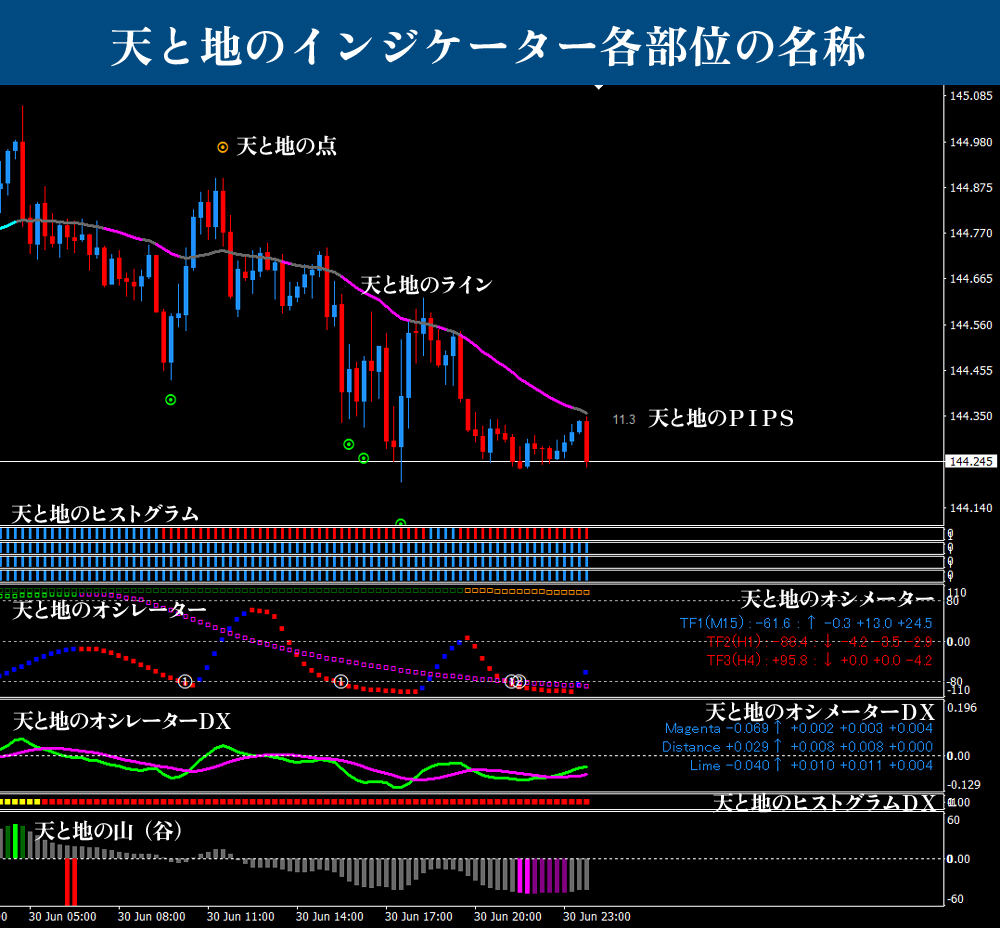
■ Heaven and Earth Indicators
https://www.gogojungle.co.jp/tools/indicators/35780
■ Heaven and Earth Mountain
https://www.gogojungle.co.jp/tools/indicators/37744
■ Heaven and Earth EA ~ Semi-Discretionary Auto-Trading System ~
https://www.gogojungle.co.jp/tools/indicators/43213
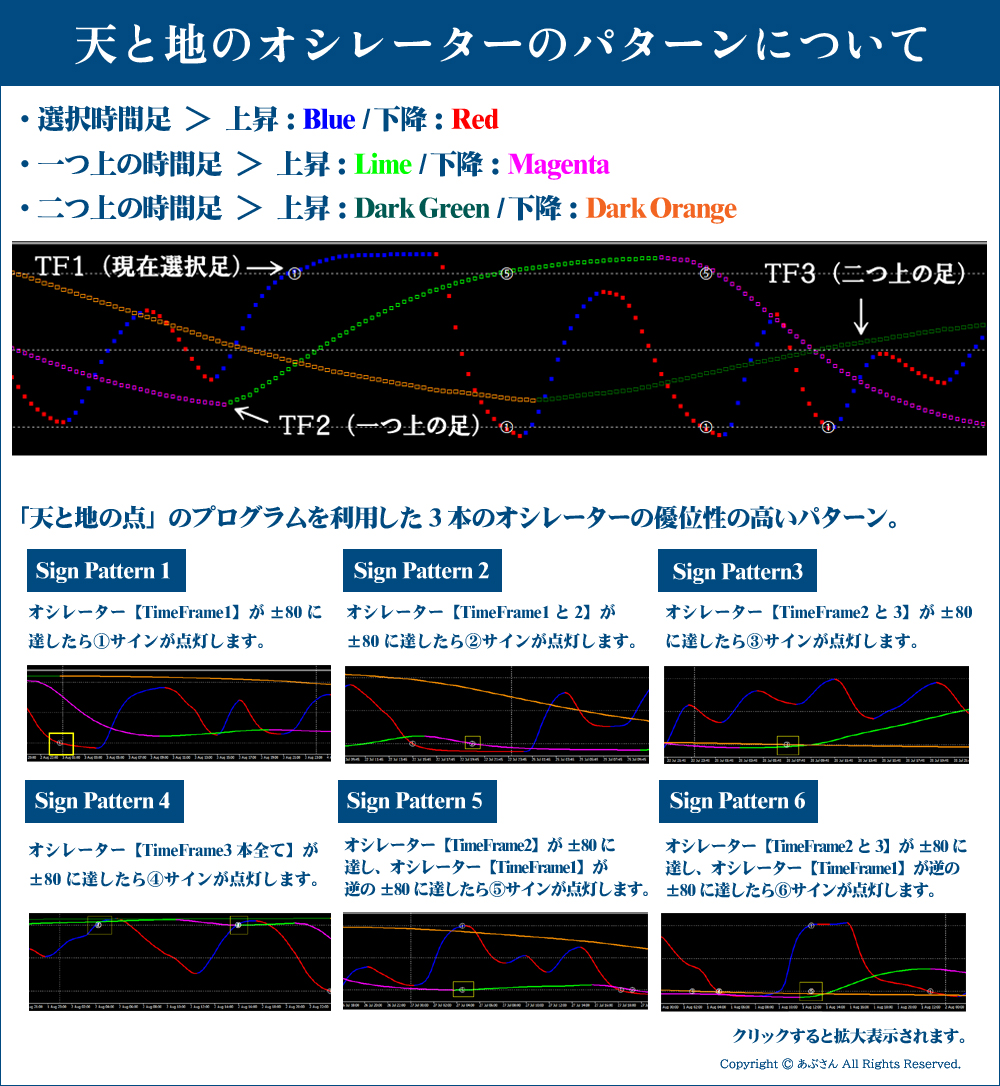
※For terms used on this blog, please refer to the following “Names of the parts of Heaven and Earth Indicators” and “Oscillator patterns of Heaven and Earth”. If you have any other questions, please refer to the Heaven and Earth Indicator sales page. If you are already a user, reading the manual should be sufficient.
From this time, there will be slight changes to the indicator settings.(We will send a revised manual with the next update.)
By adopting this setting, you can avoid traps with a high probability. It also increases the accuracy of the oscillator peak prediction. The settings are as follows. Please wait for the upcoming update for trading rules.
① Set Oscillator DX to CURRENT
② Histogram DX remains on the previous higher time frame
③ Set the parameter “TenchiDistance” of Histogram DX to 0.01
That is all.
Setting Oscillator DX to CURRENT makes movements finer and harder to judge, but soon-to-be-released“Heaven and Earth Oscillator DX”will make it easier to decide.
Now, I would like to move on to the analysis.
Thank you for your cooperation!

EUR/USD 15-minute + 4-hour Analysis
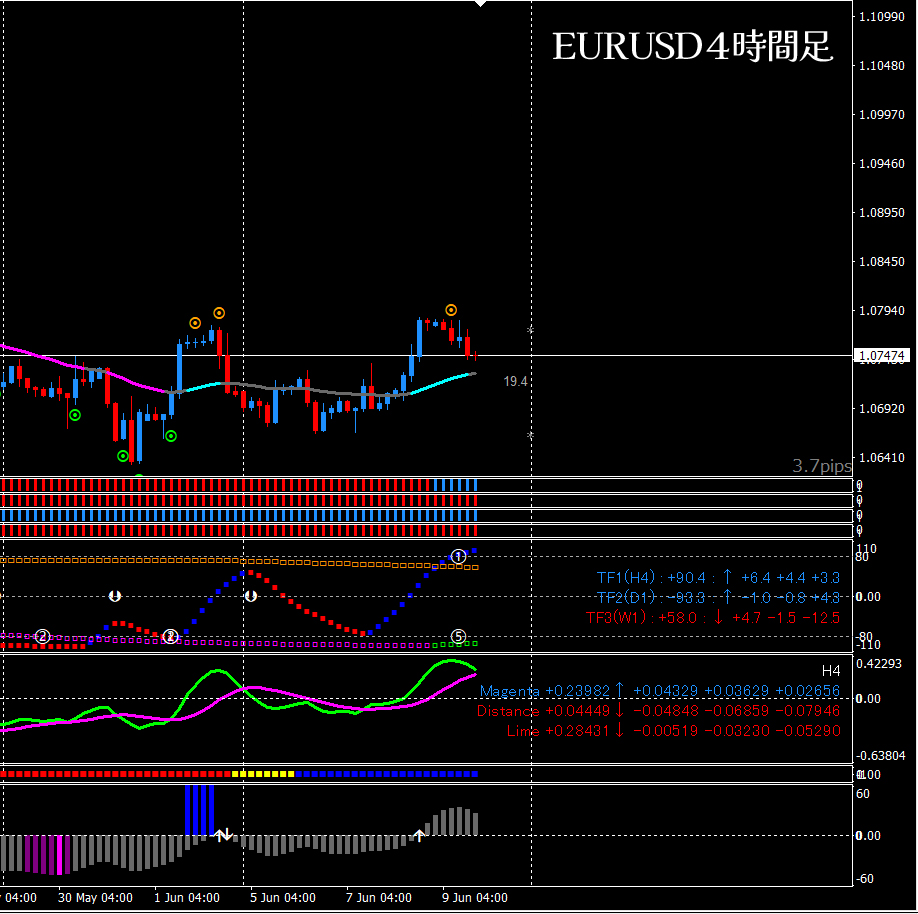
■ 4-hour (Context)
Recently, a short-entry signal appeared and price is moving down, oscillator signal⑤ is lit, but TF2 is starting to move up, so caution is needed. While the view is bearish, in such uncertain cases we wait for Oscillator DX to cross. If it crosses, the view becomes definitively bearish.
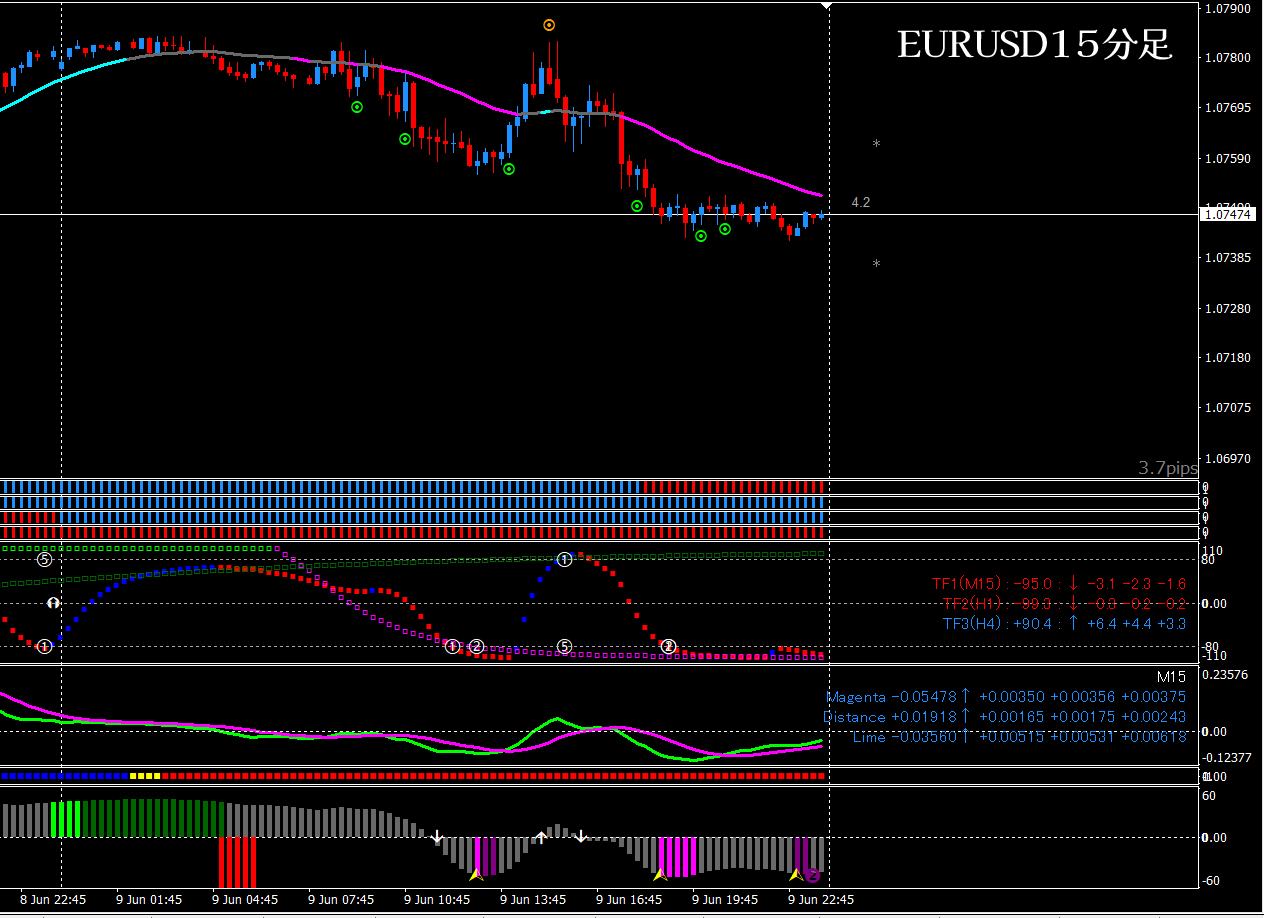
■ 15-minute (Entry Trigger)
Bearish according to the 4-hour analysis.
However, until the 4-hour Oscillator DX crosses, a long position may also be acceptable. (This decision will be greatly aided by the forthcoming Oscimeter DX. It uses the contraction ratio from the previous bar as a unique indicator.)
Assuming the 4-hour Oscillator DX crosses, the bearish view is the default, so only a short. The scenario is to drag the Oscillator TF1 toward around +80 and wait for a short-entry signal; the new rule Oscillator DX (CURRENT) cross helps avoid traps.
■ If using Heaven and Earth EA (on 15-minute chart)
Since aiming for shorts, with Oscillator TF2 pinned, use EA Pattern ② and the Oscillator TF1 pullback selling setting. Parameters can be shallow, such as +40, -40.

EUR/JPY 15-minute + 4-hour Analysis
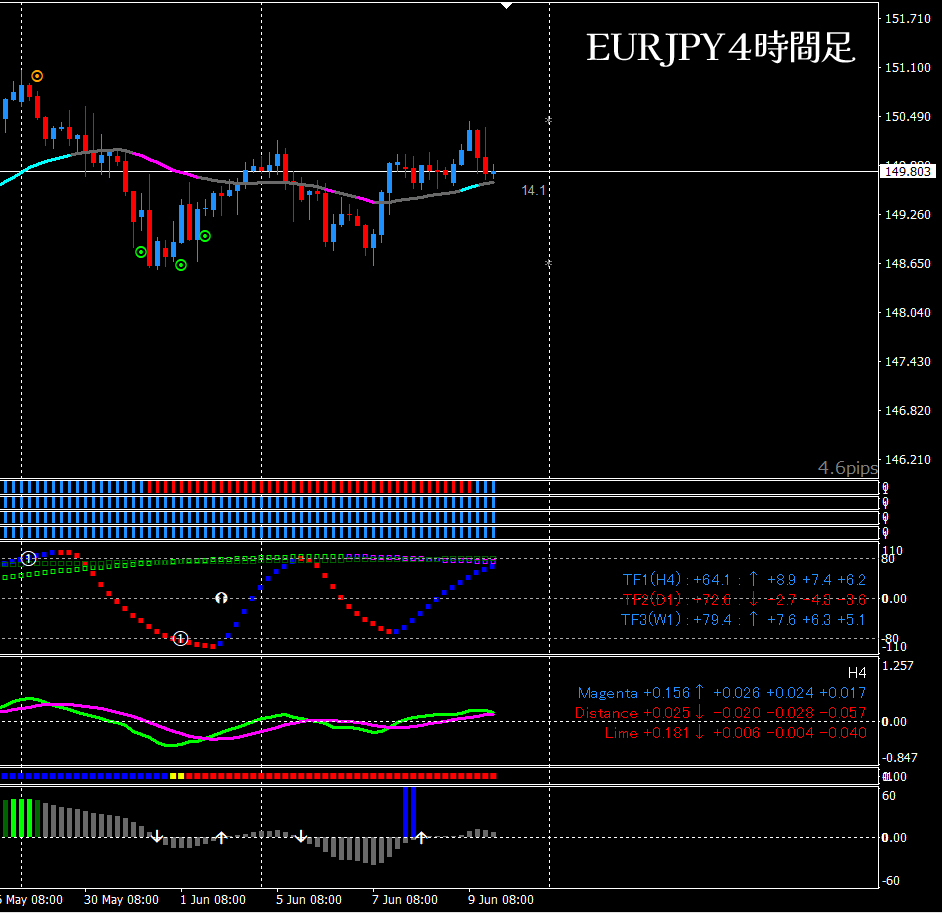
■ 4-hour (Context)
Oscillators TF1 and TF2 are both near +80. Oscillator shows that upside momentum is weakening.
Oscillator DX seems poised to cross. As with EURUSD, once cross is confirmed, bias becomes bearish.
By the way, if after this the Oscillator DX does not cross and the divergence widens again, and the Histogram DX (one higher time frame) turns yellow, you must switch to bullish.
■ 15-minute (Entry Trigger)
Bearish according to the 4-hour analysis (after cross).
Future scenarios: wait for Oscillator DX cross, enter on Pattern ②, or wait for short-entry signal. Short-entry signal is still below the current price, so the former is more likely.
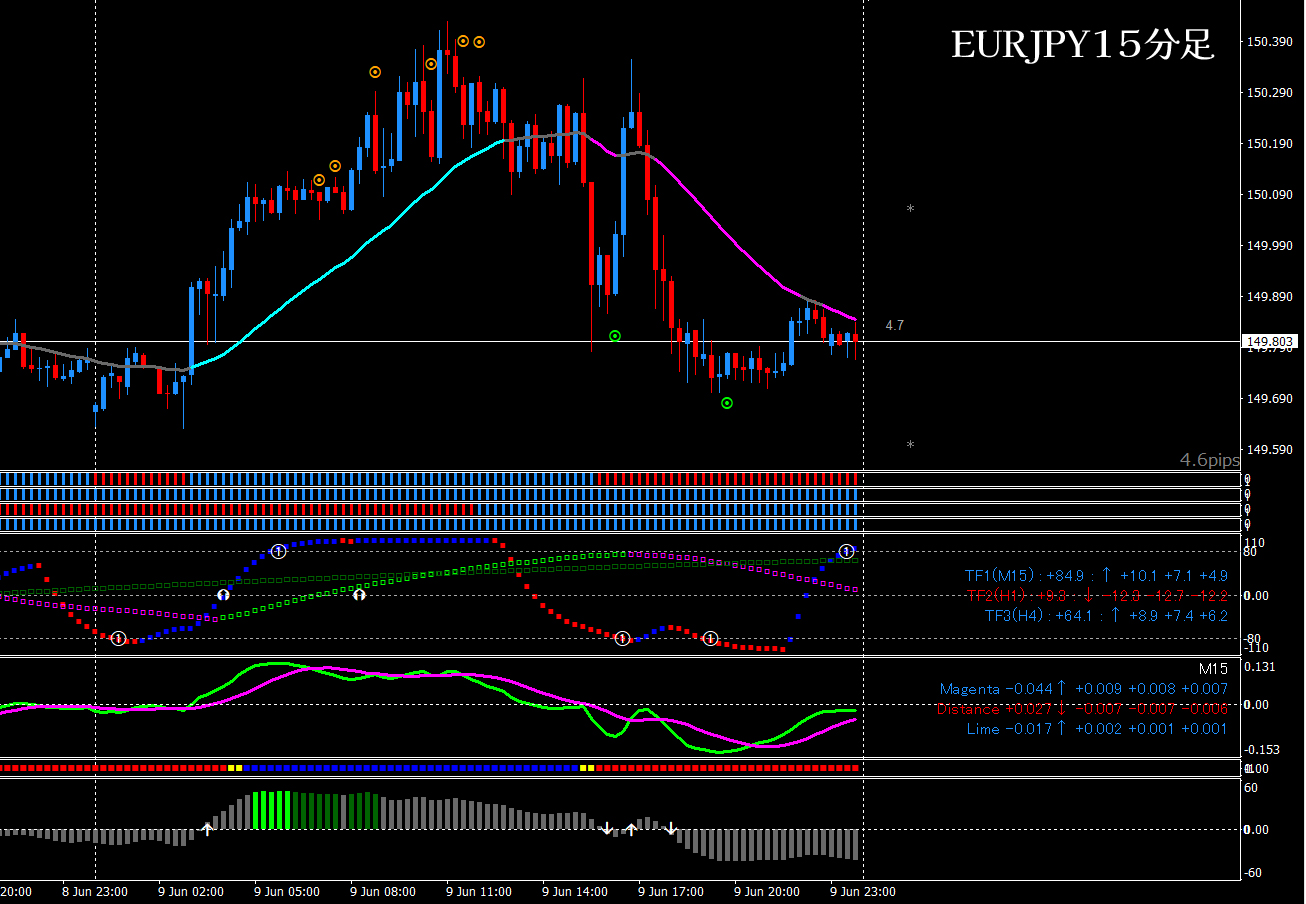
■ If using Heaven and Earth EA (on 15-minute chart)
Currently in a good shape, so use EA Pattern ②. Waiting for Oscillator DX cross reduces traps.

AUD/JPY 15-minute + 4-hour Analysis
■ 4-hour (Context)
Recently a short-entry signal appeared and price is moving down, Oscillator TF2 is moving down, TF1 looks set to reach +80. Oscillator DX is near cross, so bearish bias is fine.
■ 15-minute (Entry Trigger)■ 15-minute (Entry Trigger)
Bearish according to the 4-hour analysis.Bearish according to the 4-hour analysis.
Oscillator TF2 reaches -80, TF1 is at a delicate level and declining. DX crossing is not unlikely. The scenario is to wait for Oscillator DX to cross and trigger on TF1 for a short entry. If TF1 rises further, the edge increases.Oscillator TF2 reaches -80, TF1 is at a delicate position and descending. DX is likely to cross. Scenario: wait for Oscillator DX cross to trigger on TF1 for a short entry. If TF1 rises further, the edge increases.
■ If using Heaven and Earth EA (on 15-minute chart)■ If using Heaven and Earth EA (on 15-minute chart)
EA Pattern ① would be good. Set parameters to +100, -100.EA Pattern ① is likely best. Set parameters to +100, -100.

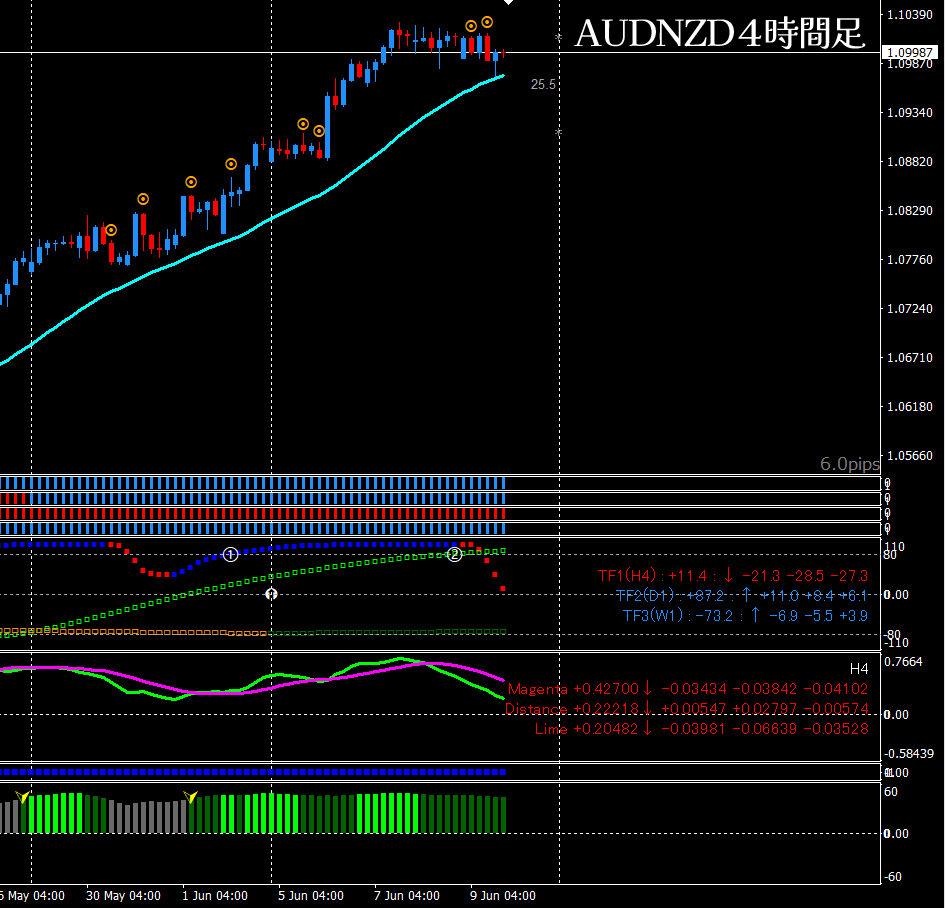
Australian News 15-minute + 4-hour AnalysisAustralian News 15-minute + 4-hour Analysis
■ 4-hour (Context)■ 4-hour (Context)
Recently a short-entry signal appeared and price is moving down, Oscillator TF2 is falling, TF1 is approaching +80. Oscillator DX is near cross, so bearish bias is reasonable.Oscillator TF2 is rising and has reached +80, TF1 is falling; a common pattern is a dip-buying setup. Once Oscillator DX cross is confirmed, bullish bias is fine. TF1 turn will also be favorable.
■ 15-minute (Entry Trigger)
Bearish according to the 4-hour analysis.
Not a particularly favorable setup. It may take time for an entry point. Scenario: Oscillator TF2 starts rising, drag TF1 toward around -80, then wait for a long entry signal. In that case, Oscillator DX remaining lime-colored is important.
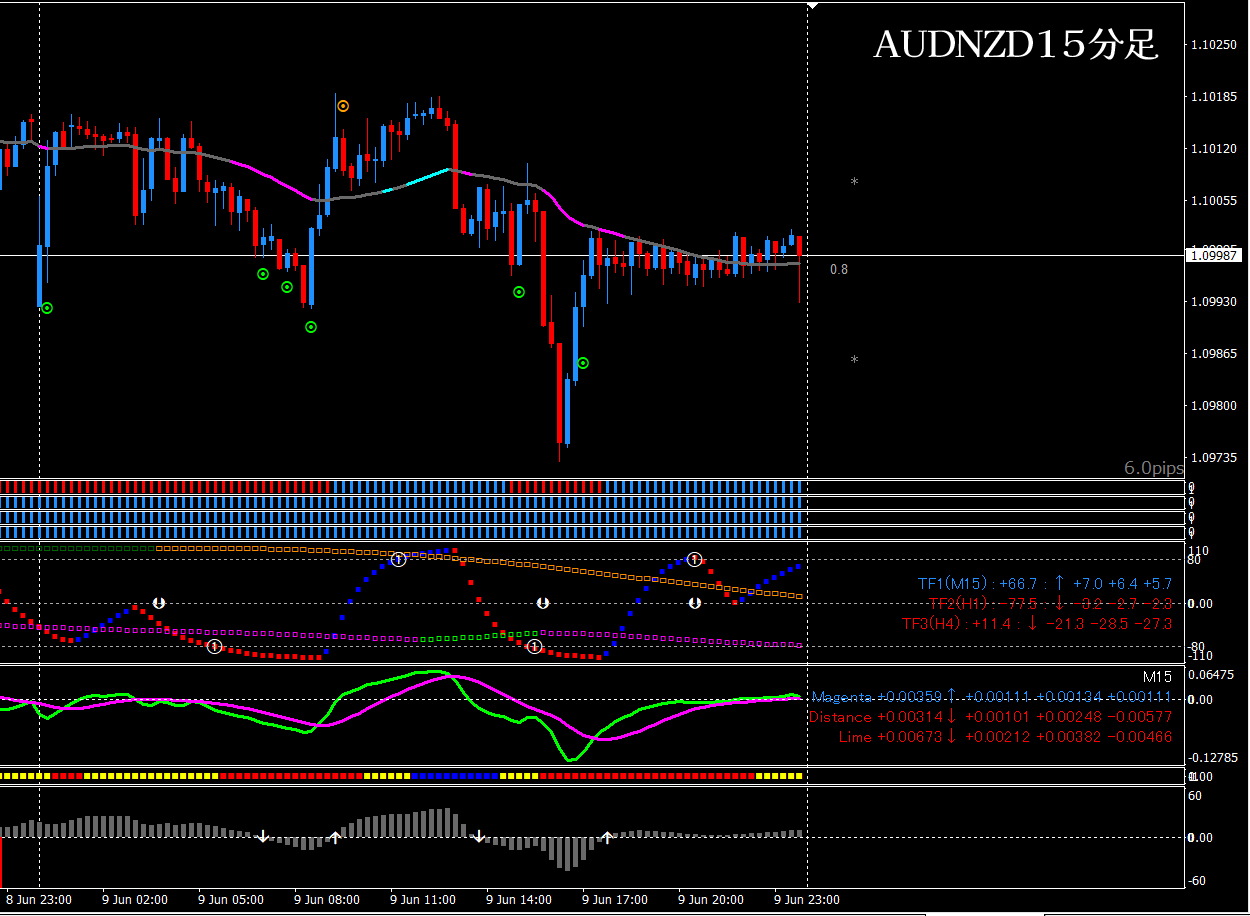
■ If using Heaven and Earth EA (on 15-minute chart)
If TF2 turns upward (lime color) EA Pattern ① would be good. Set parameters to +100, -100.

