

Utilization of "Visualization Indicators" (Part 98)
Utilization of the "Visualization Indicator" (its98)
1. Further evolve the "28 Currency Pair List Indicator" into an indicator
"8CPVisualization Indicator"to drawGBPAUD.
The "8CPVisualization Indicator" includesOceania version,\p London version,New York version,AnyCP version. This time, theOceania version was used.
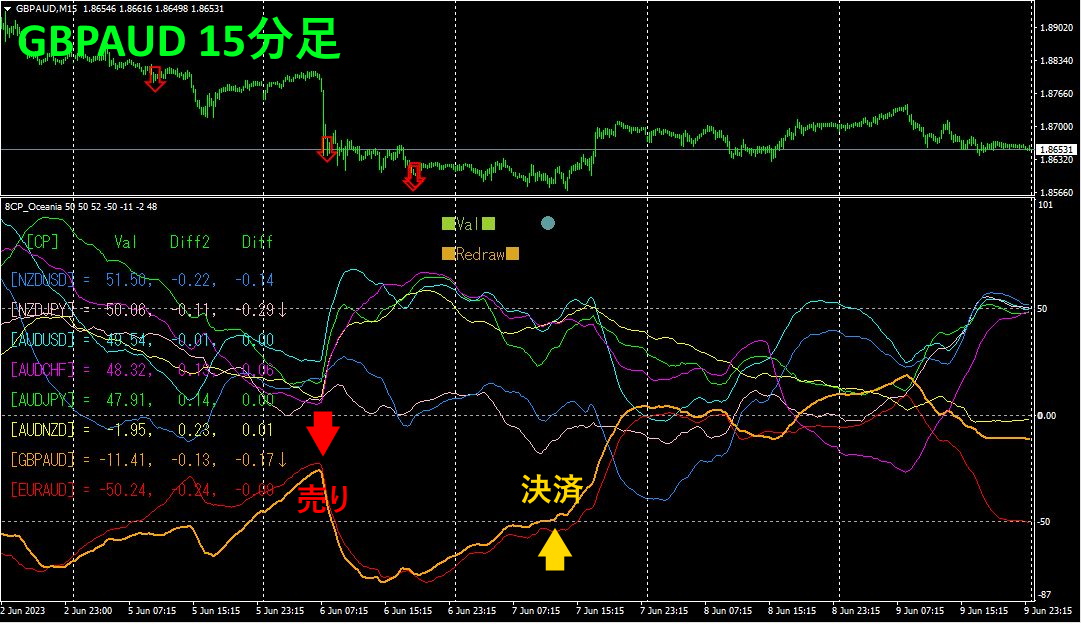
The upper half is the 15-minute chart ofGBPAUD. The arrows in the upper half indicate the alert positions from the "28 Currency Pair List Indicator." The lower half shows results from the "8 CP Visualization Indicator." The orange thick line graph corresponds to.
On Tuesday, GBPAUD broke down, so I entered a sell, and on Wednesday it broke above the lower horizontal line, so I closed the position.Profit was about60 pips..
2. Best SelectTry the Indicator
The figure below is a screenshot taken onJune 14:42, 2023 (JST).
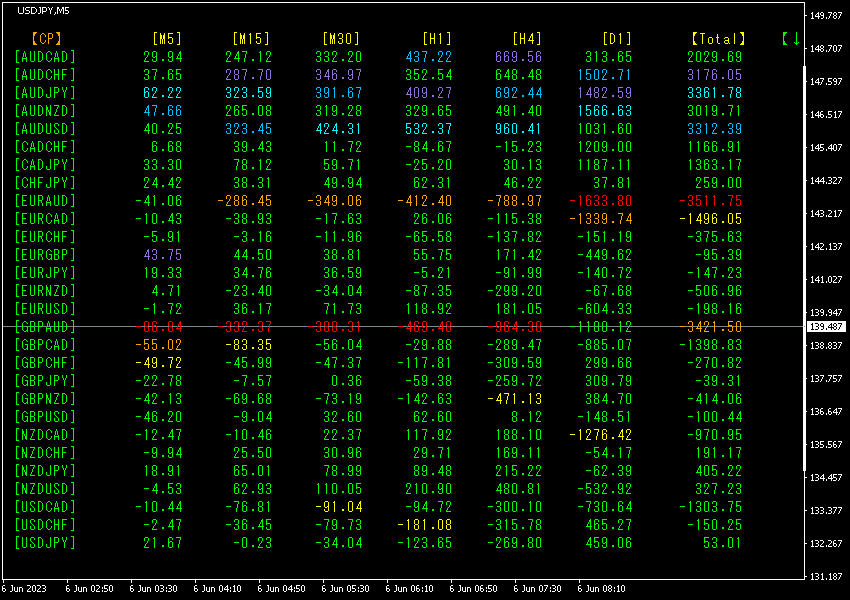
The currency pairs are listed in name order. In the middle, GBPAUDis,excluding [D1], all show in red tones.Total value is-3421.50, indicating a strong downtrend.
Now, let's look at the GBOAUD chart.
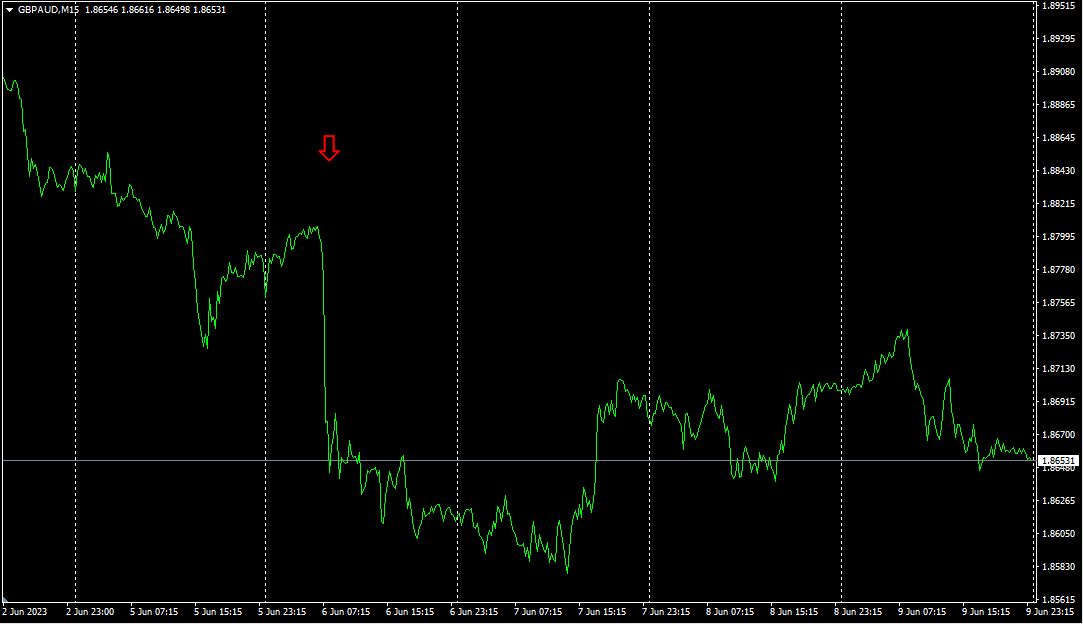
The red arrows indicate where the screenshot was taken, capturing the steep drop in the middle of a downtrend. The drop is thought to be due to an announcement. Reviewing the calendar later, there was a policy rate announcement from the RBA (Reserve Bank of Australia) with a 0.25% rate hike.
The "28 Currency Pairs Best Select Indicator" helps identify among the 28 currency pairs which one is currently exhibiting the strongest trend. It also indicates with numbers and colors whether to trade now or not. It provides an at-a-glance view of all currency pairs’ movements.
The "28 Currency Pairs Best Select Indicator".

https://www.gogojungle.co.jp/tools/indicators/35128
3. Since May of the year before last5, what happened to EURJPY’s movement?
From 2021 year, May EURJPY
To view the overall trend, a 30-minute chart covering the most recent about weeks is drawn.
Previously I wrote the following.
EUR and are both moving downward. In terms of angle, has a steeper angle than. Therefore, the expectation is that EURJPY will continue to rise for a while.
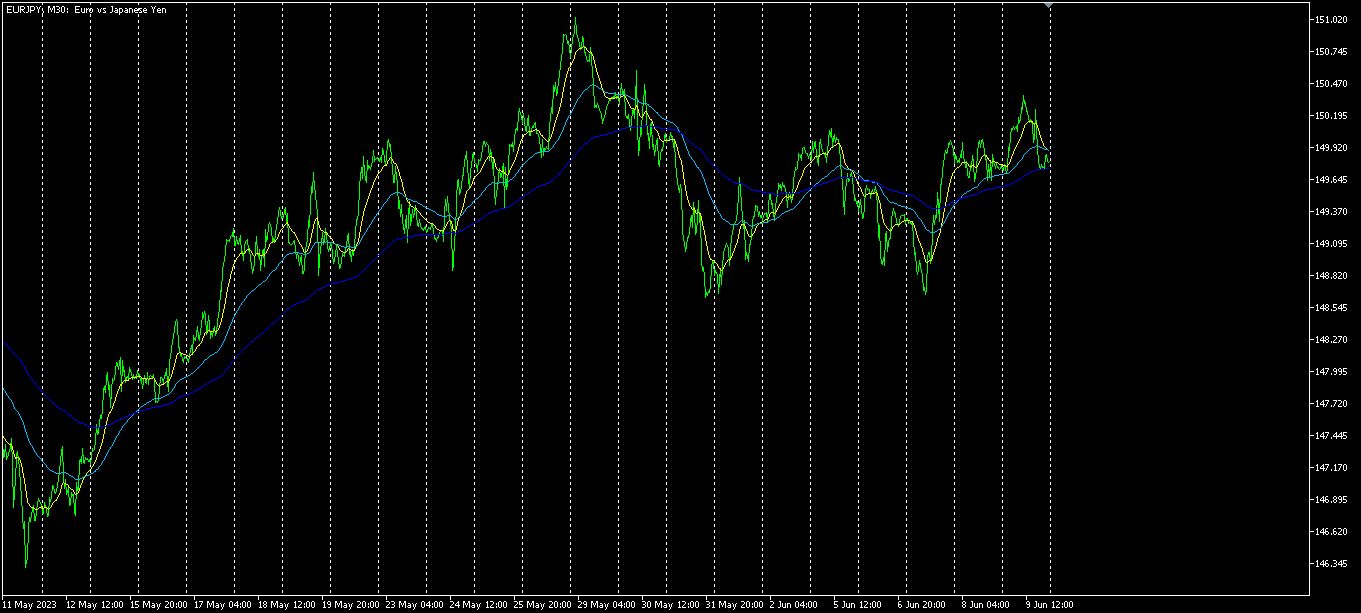
It declined temporarily, but then rose again.
A 4-hour currency strength chart.
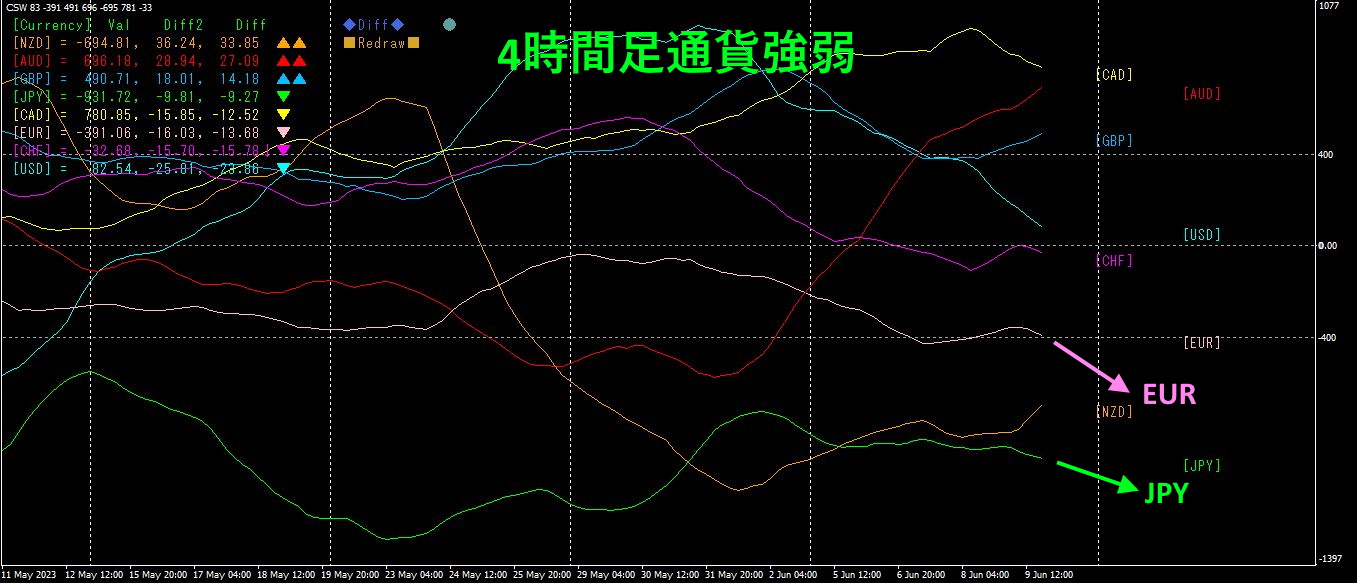
Pink isEUR, green isJPY. Both EUR and JPY are moving downward. The slopes are roughly the same. For the time being, EURJPY is expected to move within a range.
4. Searching all currency pairs for peaks and troughs and formulating a trend strategy (continued)
We are developing a trading strategy to “buy AUDJPY at a major bottom.”
Last time,
the profit margin appears to be narrowing. With new highs stalling, it may be time to conclude this trade. Considering unrealized gains as well, total profit is about, so the strategy of “buy AUDJPY at a major bottom” has yielded ample results.
That is what I wrote.
4I will show the time-frame charts.
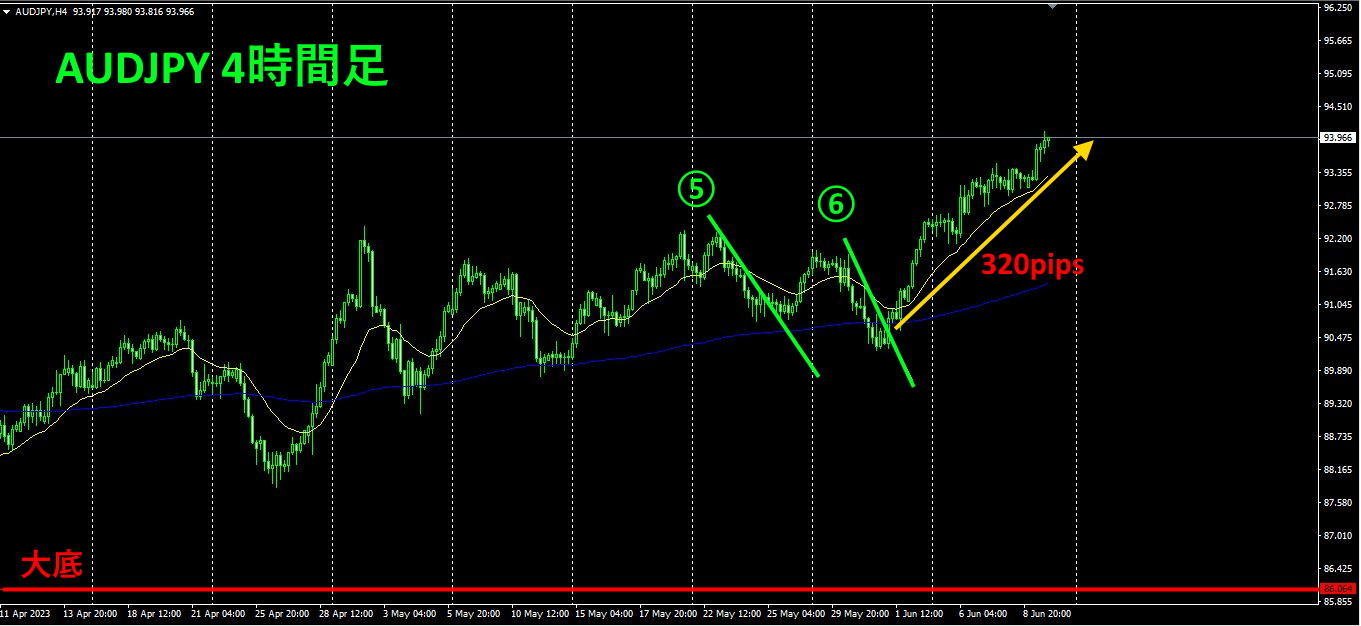
I thought headwinds would soon cap the move, but it extended higher.
By simply repeating a straightforward trade of “buy when the diagonal descending line is broken upward,” I secured a total of in closed profit from steps ① to ⑤, and since I bought after breaking line ⑥, unrealized profits have reached.
It has not fallen below the moving averageEMA20 and continues to rise. It is expected to rise further, so keep holding.
If you ownTrend Line EX, you can set automatic take-profits on a break of the trend line or automatic take-profits when EMA20 is broken, so you can just smile and wait for success.
※“

https://www.gogojungle.co.jp/tools/indicators/42257
“8CCurrency Strength Visualization Indicator” interested readers, please refer to the pages below.
MT4 version https://www.gogojungle.co.jp/tools/indicators/39150
MT5 version https://www.gogojungle.co.jp/tools/indicators/39159
【My current listings】


