

[June 4, 2023] Chart analysis using the sky and earth indicators
Nice to meet you! I am Abusan.
This is my first post on Investment Navigation Plus.
Here, I would like to share chart analyses using my developed indicator, “Heaven and Earth Indicator.”
I hope this be of some help to everyone.

Heaven and Earth Indicator is a trading method using an original indicator I developed, released in February 2022.
Thanks to everyone's support, “Gogojungle Award 2022 Winner
※This article analyzes charts using only the Heaven and Earth Indicator series. To keep beginners to advanced users on an even footing, I have explained without relying on the so-called FX theories (Dow Theory, Fibonacci, Elliott Wave, cycle theory, price action, Granville's rules, etc.). Please understand.
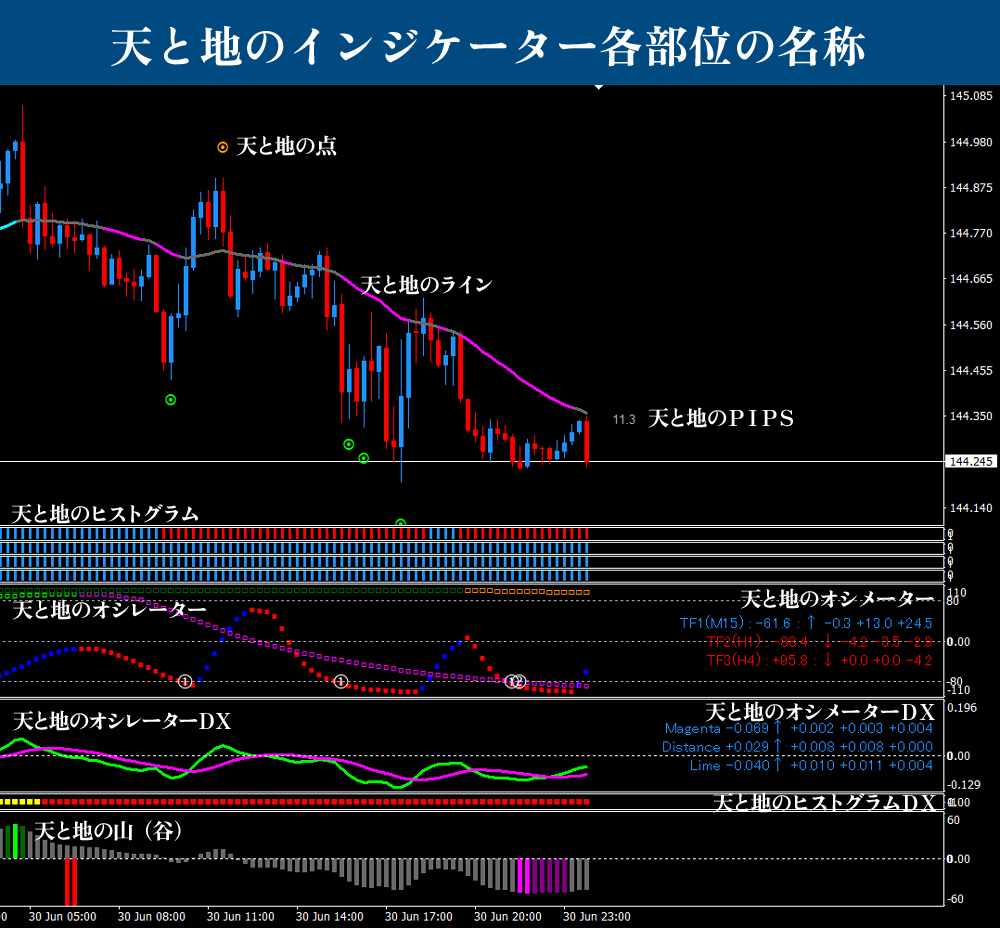
■ Heaven and Earth Indicator
https://www.gogojungle.co.jp/tools/indicators/35780
■ Heaven and Earth Mountains
https://www.gogojungle.co.jp/tools/indicators/37744
■ Heaven and Earth EA ~ Semi-automatic trading system ~
https://www.gogojungle.co.jp/tools/indicators/43213
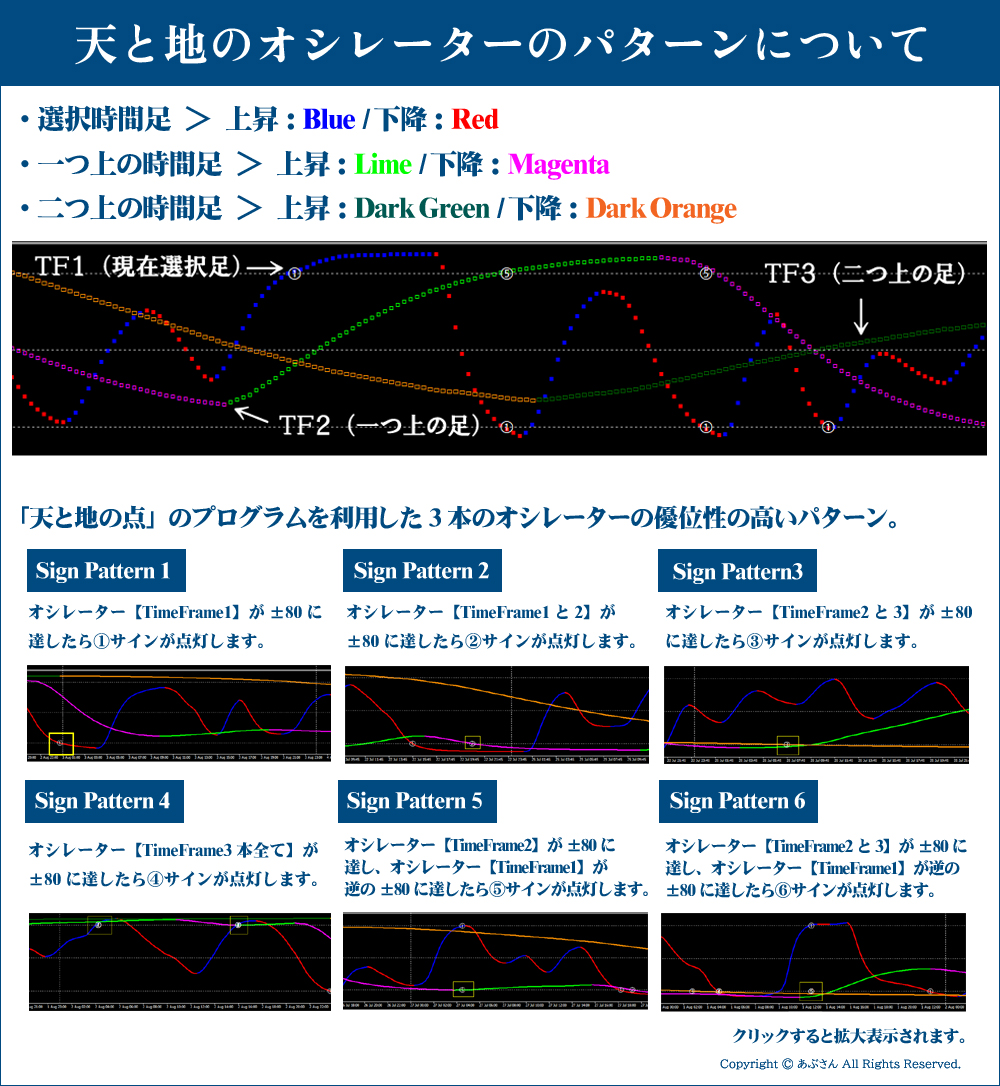
※ For specialized terms used on this blog, please refer to below “Names of each part of Heaven and Earth Indicator” and “Patterns of Heaven and Earth Oscillators.” If you have any other questions, you can generally understand by referring to the Heaven and Earth Indicator sales page.
Thank you in advance!

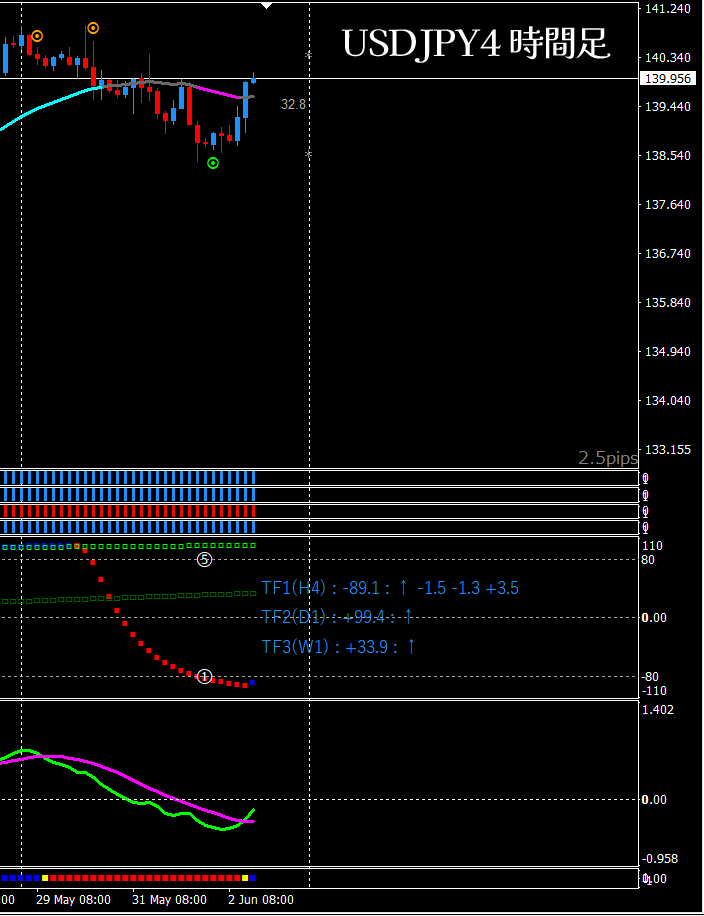
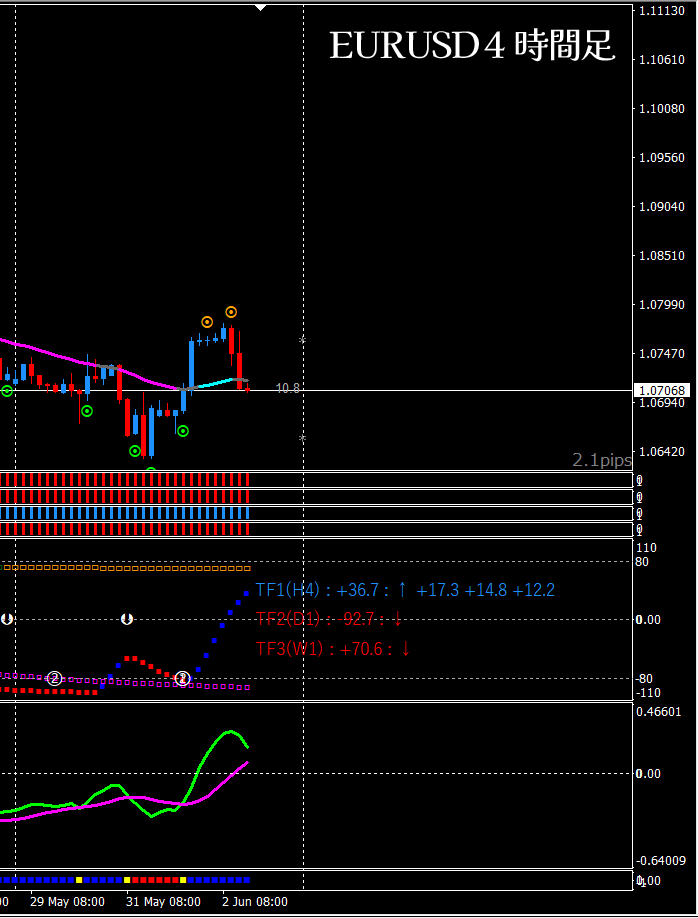
USD/JPY 15-minute + 4-hour analysis
■ 4-hour (environmental recognition)
Although the long signal appeared just before and the price has risen for quite a while, from Oscillator Signal ⑤ the TF1 color has changed, DX has crossed and is confirmed, good reasons exist for a bullish outlook.
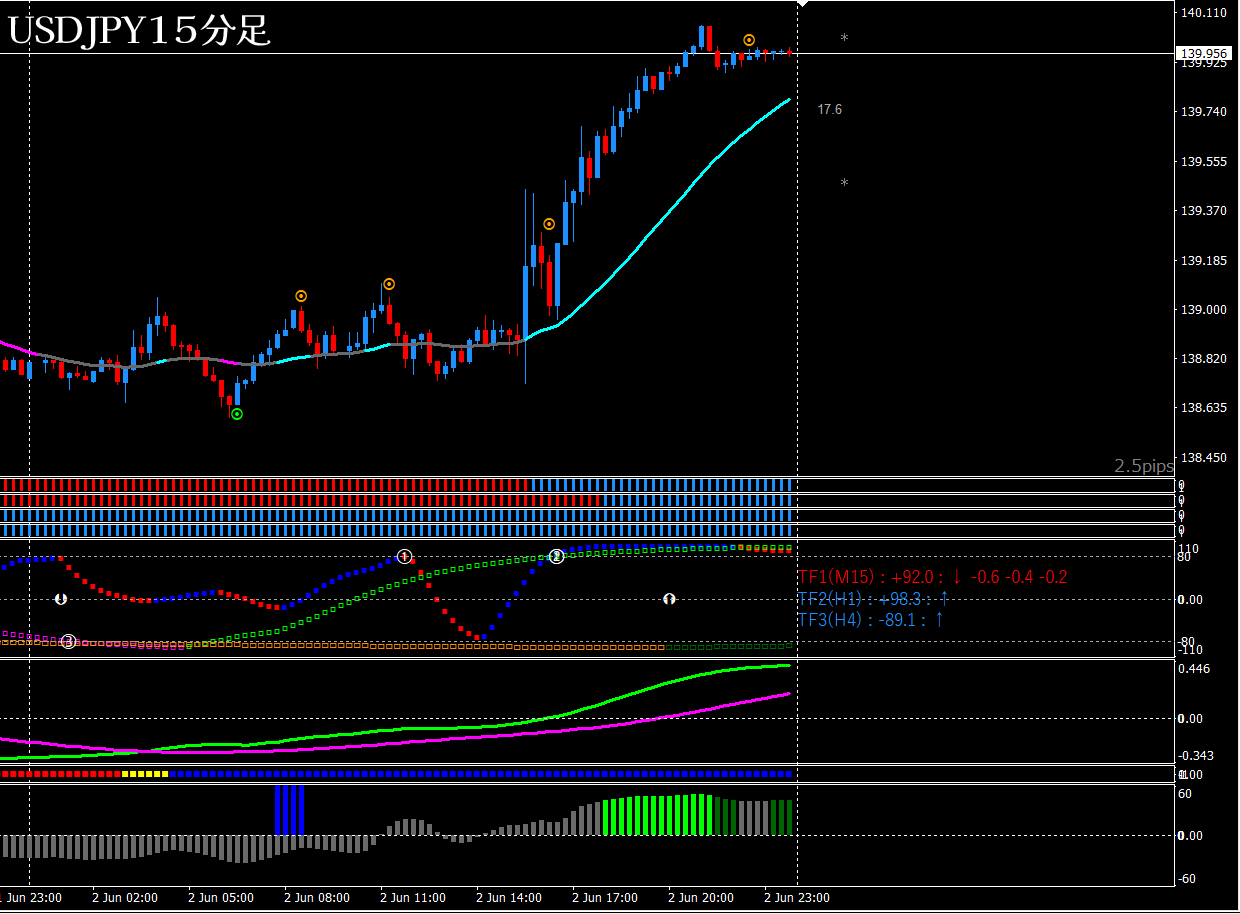
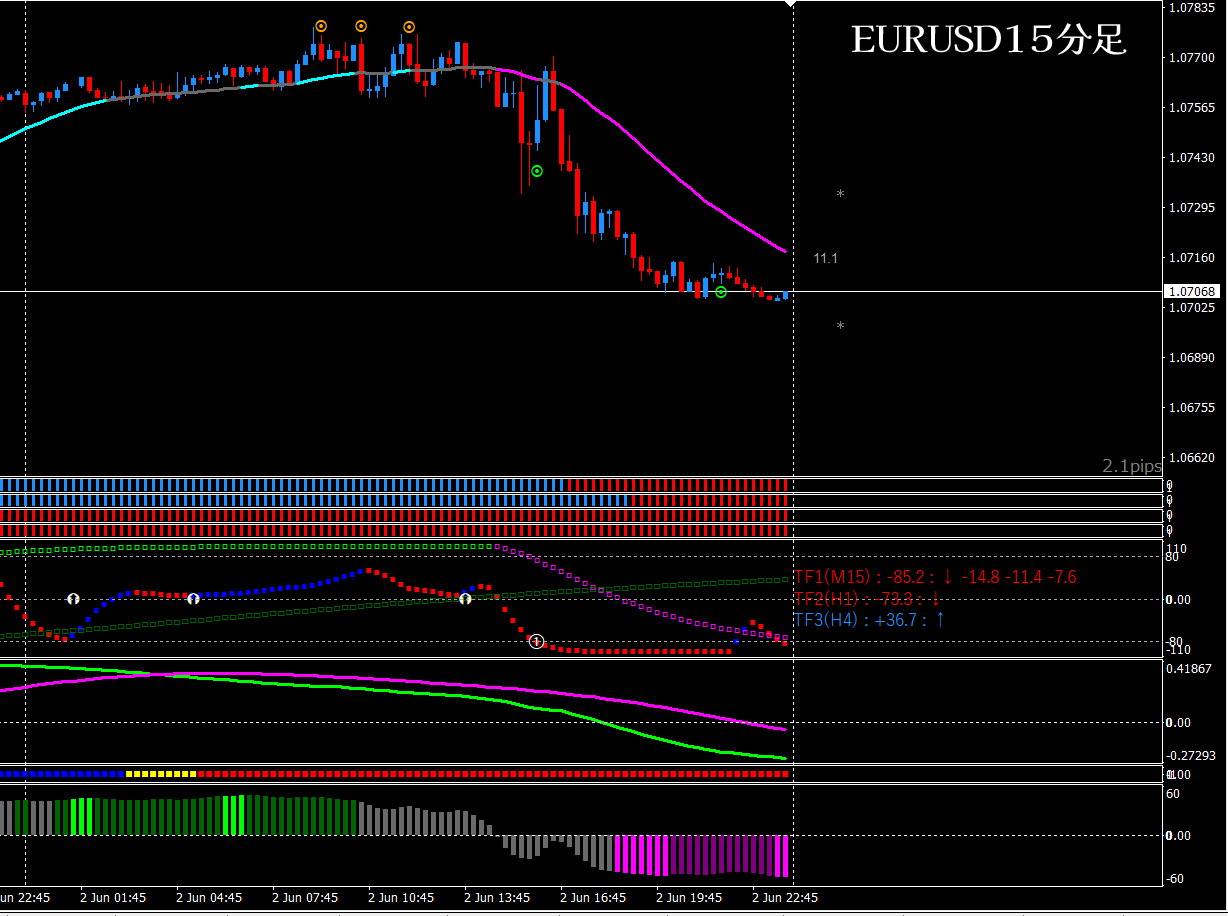
■ 15-minute (entry trigger)
Since I determined the trend as bullish on the 4-hour, I will mainly aim for longs.
It already seems to have risen quite a lot, but in such a case, I think it’s good to set up scenarios like the following.
Oscillator TF2 holds tight, pull TF1 as low as possible, and trigger a color change. Long valley signal is OK too. (If the entry point is above the line, I expect long entry signals to not appear for a while.)
If DX crosses or TF2 starts declining, we need to redo the scenario.
■ If using Heaven and Earth EA
Use on the 15-minute chart.
In this case, it’s good to use EA Pattern ②. Settings: “+80, -80”. Alternatively, the secret pattern is fine too.

GBP/USD 15-minute + 4-hour analysis
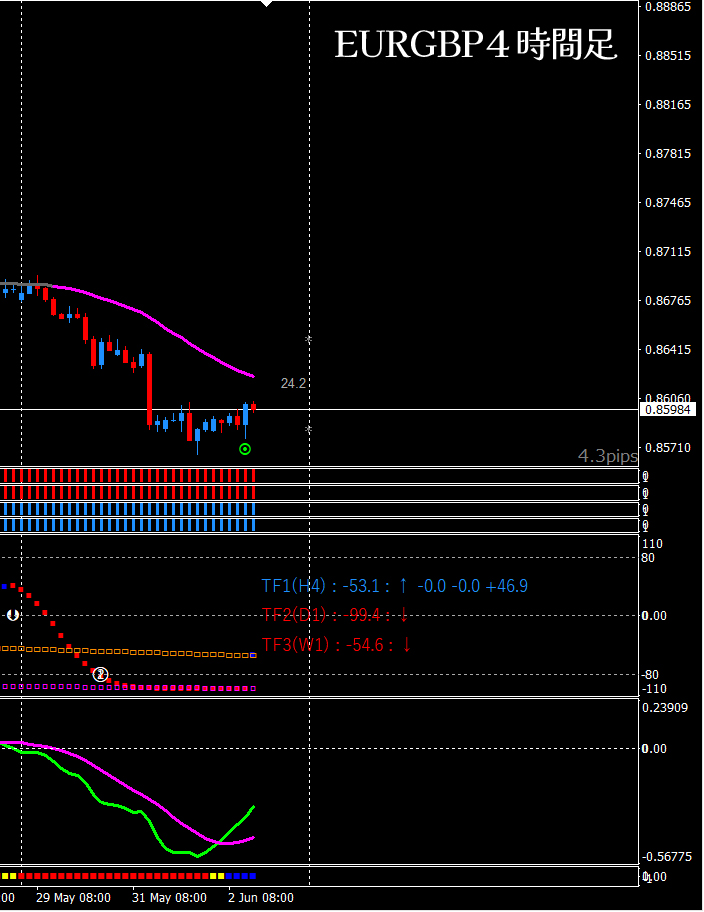
■ 4-hour (environmental recognition)
Prices are falling from the long signal appearance, Oscillator TF2 is almost flat. It is bearish, but since I want more evidence, I will confirm DX crossover or Oscillator TF1 color change to determine bearish stance. However, since the descent already has enough basis, if a good short point appears on the 15-minute chart, you may take a early entry.
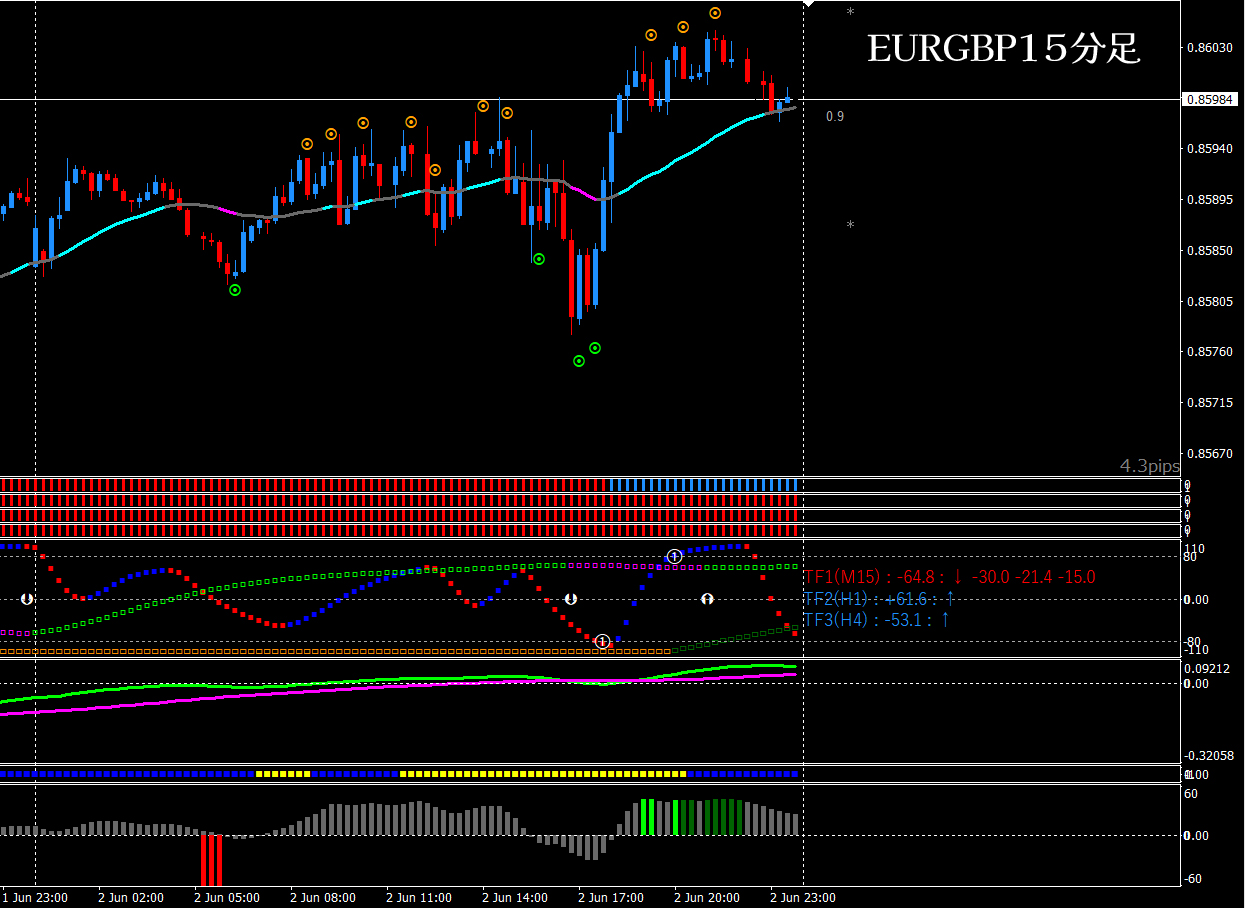
■ 15-minute (entry trigger)
From the 4-hour perspective, bearish. The target is a pullback selling.
If I set up a scenario, pull Oscillator TF1 to around +80 (TF2 also moving downward is a condition) and enter short when color changes. If the 4-hour bearish stance is confirmed, TF1 can reach +80 and you may enter without waiting for color change.
■ If using Heaven and Earth EA
Use on the 15-minute chart.
In this case, EA Pattern ② is good. Settings: “+80, -80”. Alternatively, the secret pattern is fine too. If the current price is above the line, long entry signals may appear, so Pattern I could also be fine.

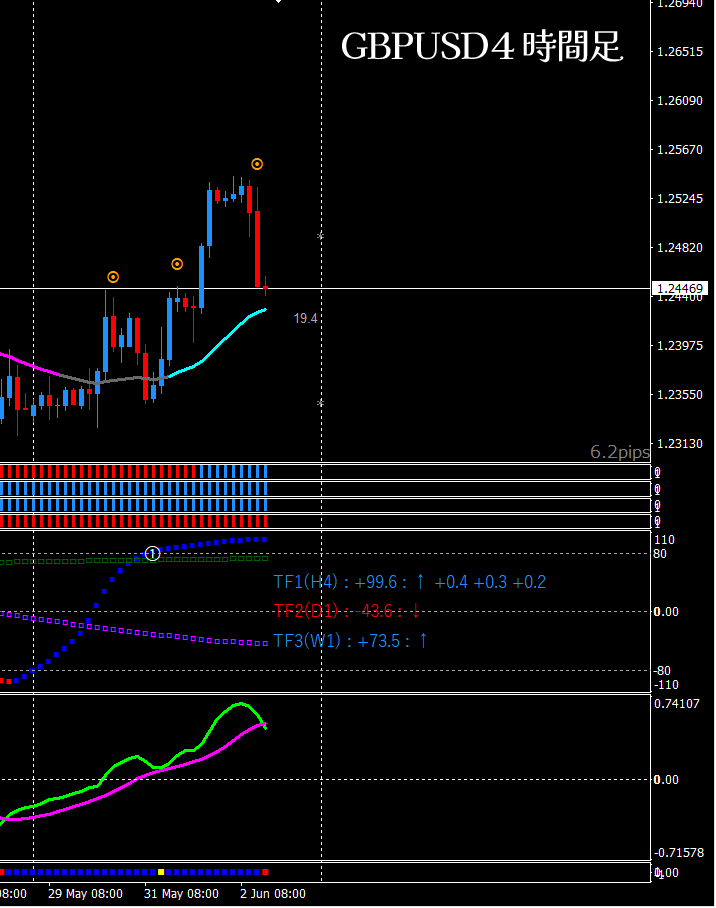
GBP/USD 15-minute + 4-hour analysis
■ 4-hour (environmental recognition)
Short entry signal appears + Oscillator TF2 downward + TF1 +80 reached + DX cross
Very favorable setup. Bearish stance is determined.
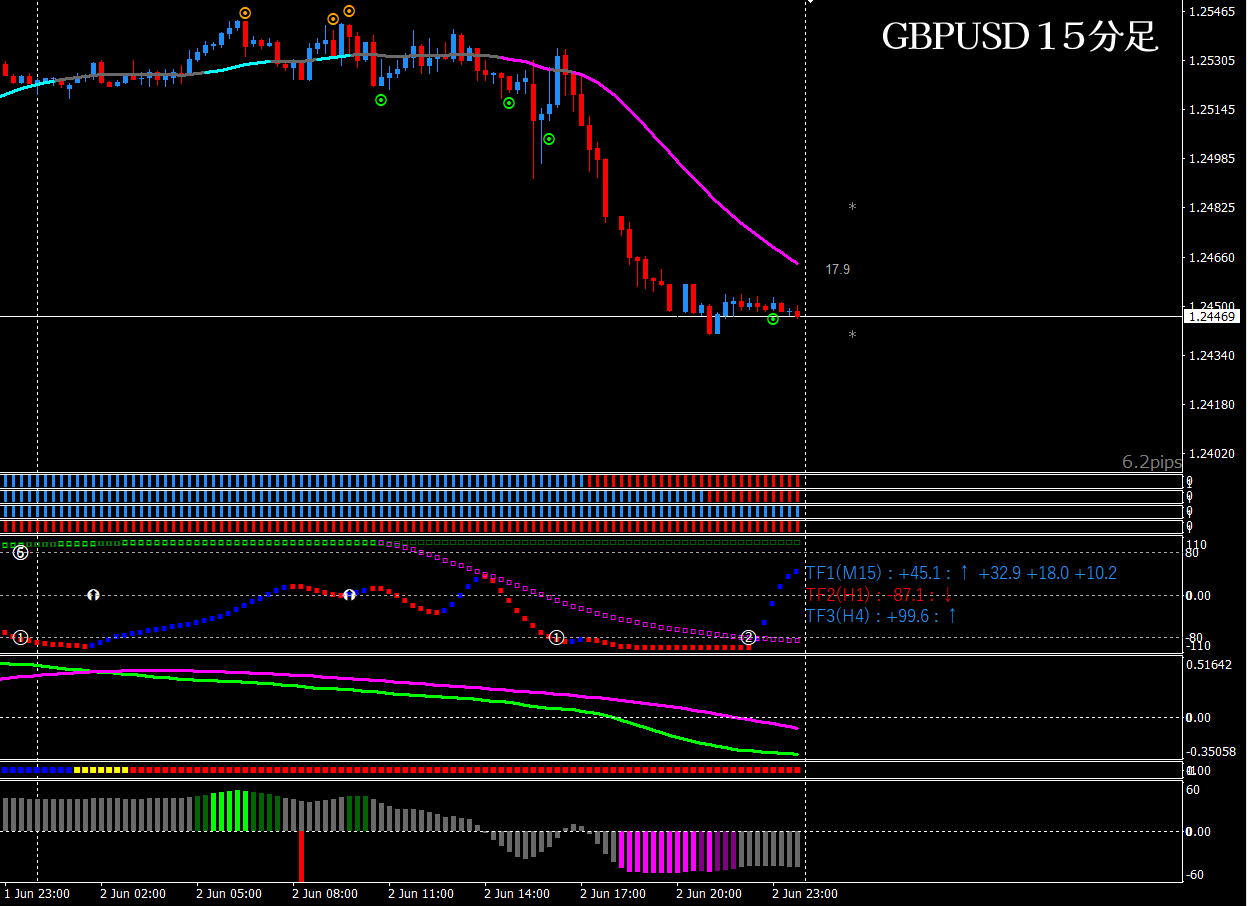
■ 15-minute (entry trigger)
From the 4-hour analysis, bearish.
If I were to set a scenario, Oscillator TF2 is descending, pull TF1 to around +80 (Since the 4-hour state is good, TF1 reaching +80 to wait for color change can be skipped and entered early).
■ If using Heaven and Earth EA
Use on the 15-minute chart.
In this case, EA Pattern ② is good. Settings: “+80, -80”. Alternatively, the secret pattern is fine too. If the current value is above the line, long entry signals may appear, so Pattern I could also be fine.

EUR/JPY 15-minute + 4-hour analysis
■ 4-hour (environmental recognition)
Right after a long entry signal appears + Oscillator Signal ② + DX cross, price rises
Oscillator TF1 is also rising, and DX has crossed, so bullish outlook is appropriate.
If TF2 starts rising, the justification increases further.
■ 15-minute (entry trigger)
From the 4-hour analysis, bullish. Long only.
The scenario is to continue this way with Oscillator TF2 rising and TF1 hitting -80 for entry. If TF2 remains flat, waiting for +80 to rise and cling is another option.
■ If using Heaven and Earth EA
Use on the 15-minute chart.
In this case, EA Pattern ② is good. Settings: “+80, -80”. Alternatively, the secret pattern is fine too.

That concludes analyses for four currency pairs.
I hope this helps.
