
Past Chart Analysis & Real Trade Analysis
Hello, this is Aridanshaku
Until the previous time,
I have been telling you how I succeeded in FX, but
this time I would like to use an actual XAUUSD chart to explain
2023/5/31 XAUUSD
4-hour chart
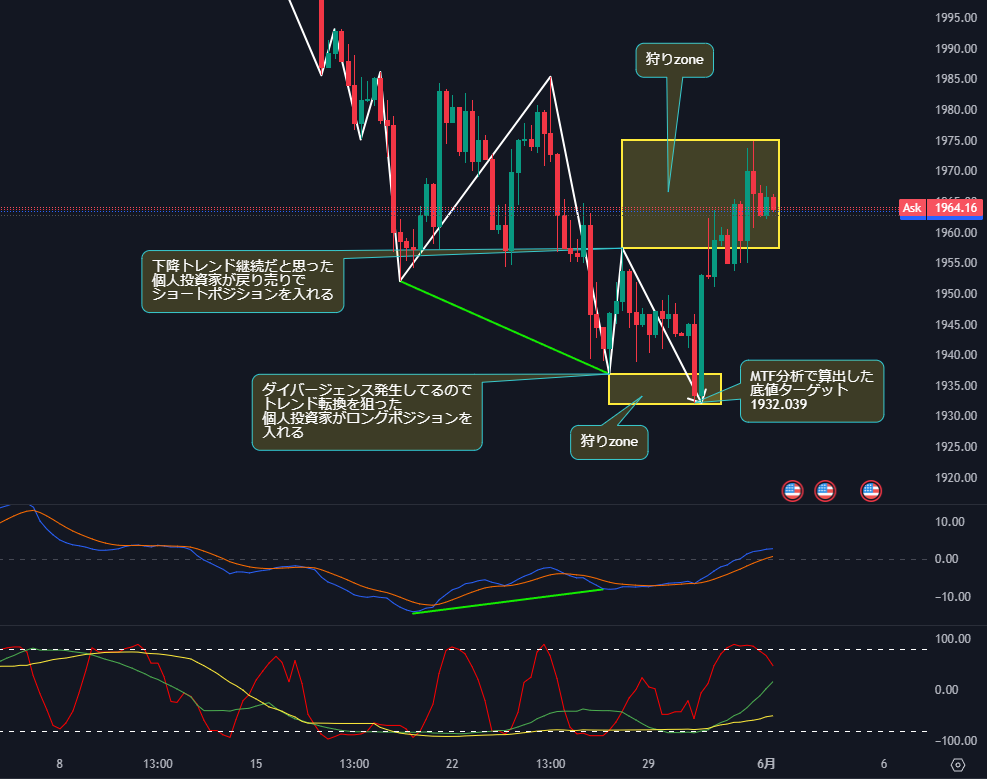
Yesterday's XAUUSD 4-hour chart
There is a divergence occurring, so individual investors are long, aiming for trend reversal
Since a downtrend is occurring, individual investors are short, aiming for a pullback
In this struggle, it is analyzed as a triangle consolidation
What happened to the subsequent price movement
You can understand from this chart
Rebounded neatly within the upper and lower hunting zones
In other words, both long and short positions of individual investors are being stopped out
This is the perspective of the big funds
If you just read this, you might not get it, so
I'll switch timeframes and introduce another example
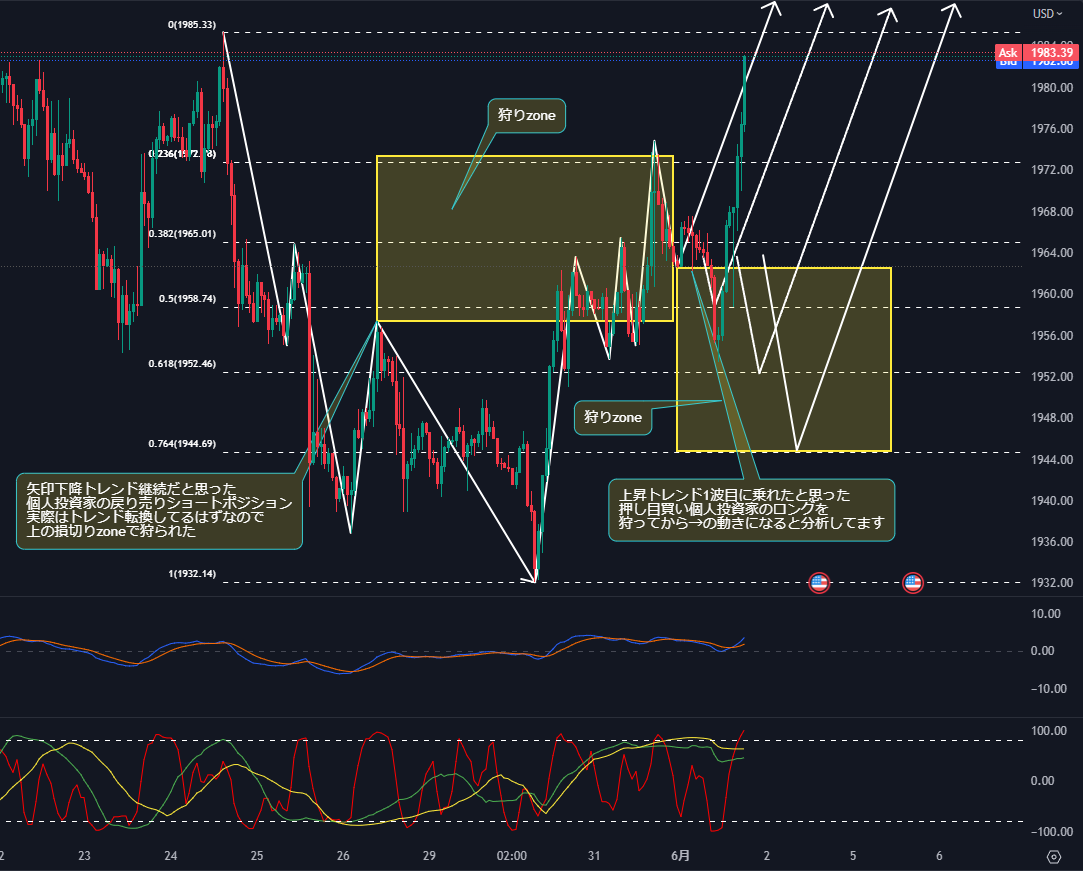
6/1 XAUUSD 1-hour chart
This screenshot is in progress now
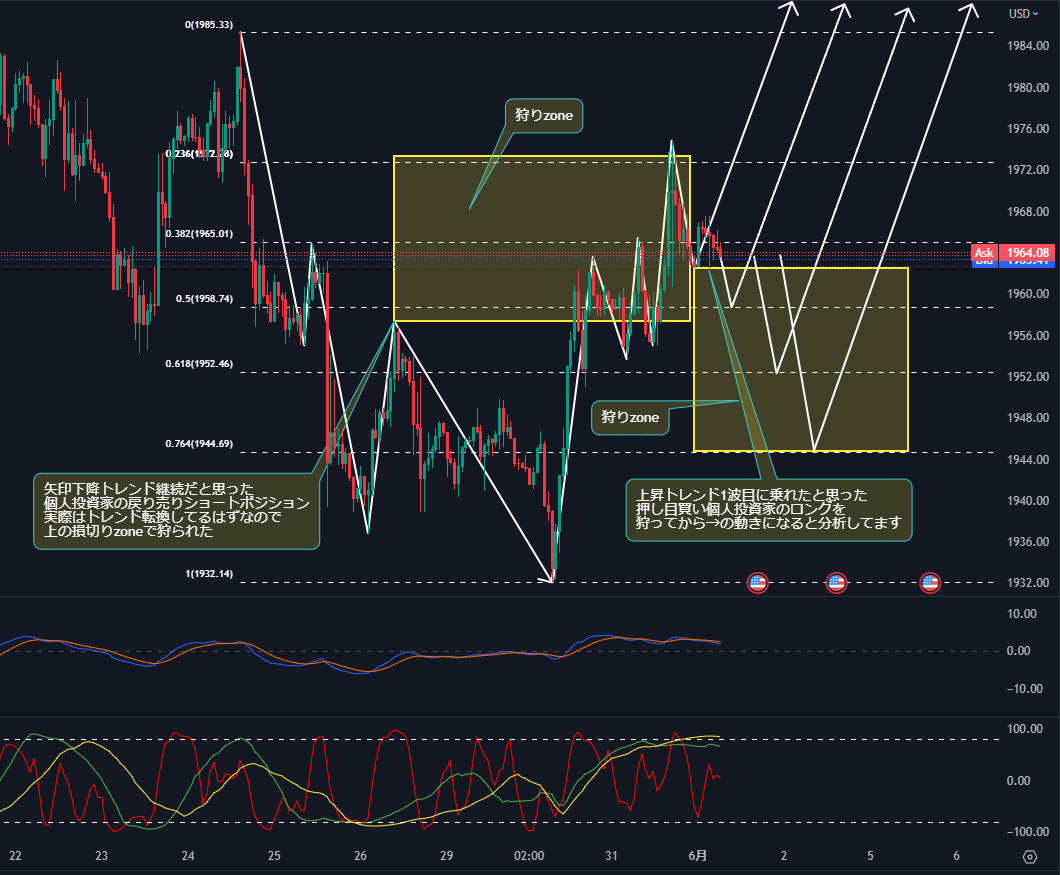
I thought the downtrend would continue
But large traders entered short positions near a pullback
↑ the zone is where accumulation of stops is happening
In reality, the trend reversal was anticipated in advance
by large funds
It was neatly hunted up to the 76.4% level
I analyze that the first wave from the lowest price reaches up to 76.4
Yet I thought the first wave would continue
Individual investors’ pull-back buying longs
In the screenshot, I expect the position in the lower hunting zone to be hunted
What happened afterward is shown in this screenshot
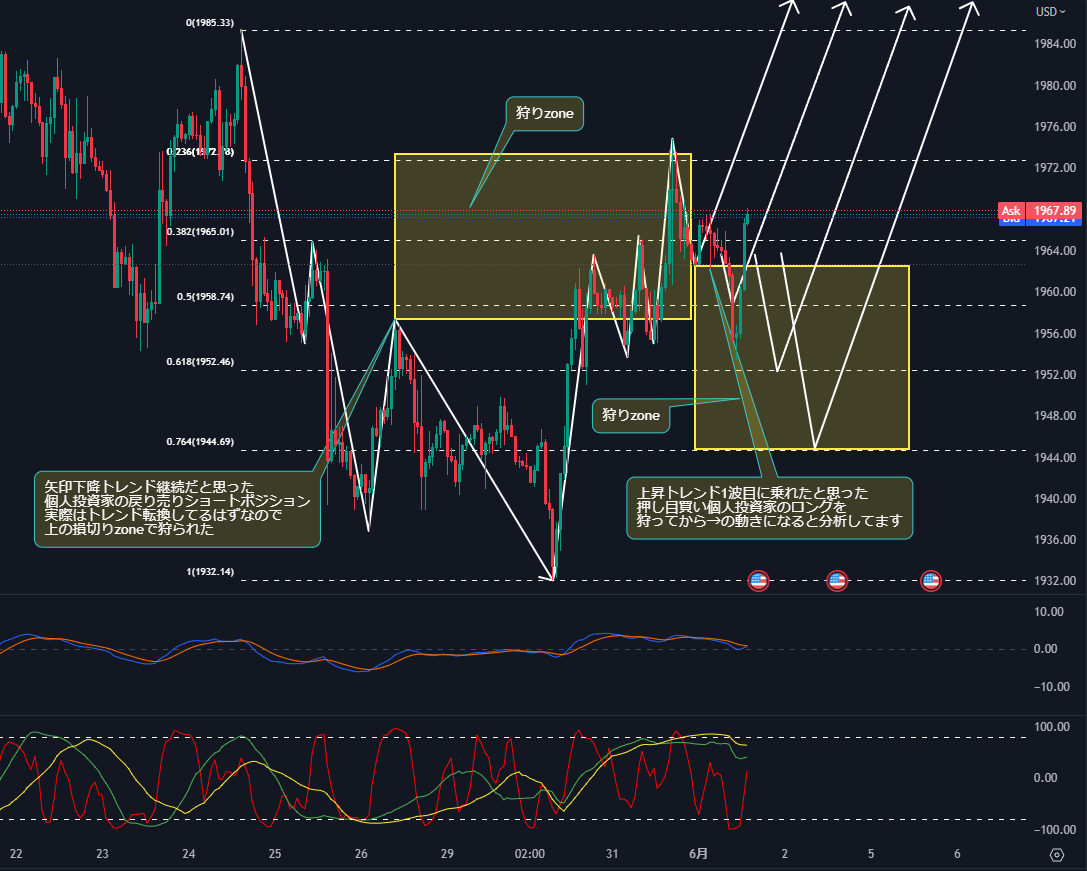
It seems to have cleanly hunted the lower zone and break upward
It's still a mid-stage, so it feels like three waves appeared
From the big fund's perspective, if you trade
You could at least gain around 200 pips in both directions
this is a point
This is how I trade from the perspective of big players
P.S. The subsequent chart
It unfolded as the scenario described
I hope to write another article next time that will be helpful
If you found this helpful, please consider following
It will be encouraging, thank you
This is a free serialized article