

Utilization of the "Visualization Indicator" (Part 96)
“Visualization Indicator” usage (that96)”
1. Advance and develop the “28 Currency Pairs List Indicator” into an indicator
“8CP Visualization Indicator”to plotNZDUSD.
The “8CP Visualization Indicator” includesOceania version,London version,NewYork version,AnyCP version. This time, we used theOceania version.
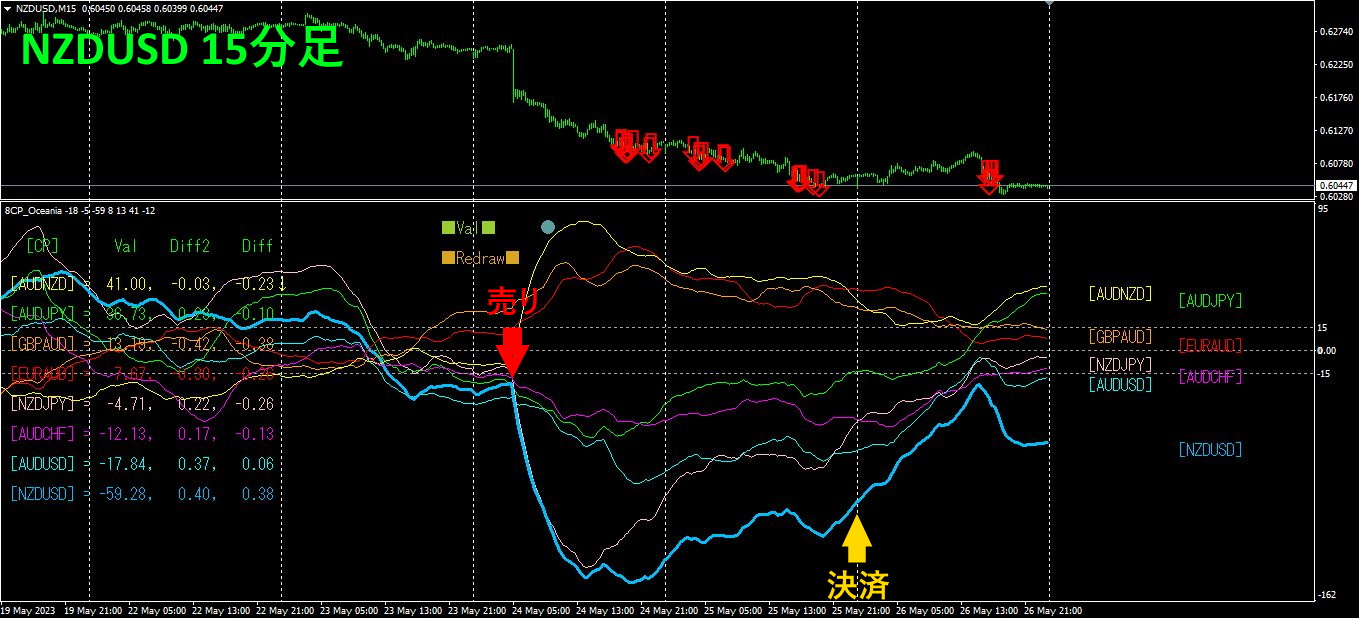
The upper half is a 15-minute chart ofNZDUSD. The arrows on the upper half indicate the alert positions of the “28 Currency Pairs List Indicator.” The lower half is from the “CP Visualization Indicator.” The blue-thick line graph corresponds toNZDUSD.
On Wednesday, NZDUSD fell below other graphs, so I entered a sell position and closed it on Thursday night.Profit of approximately120 pips was achieved.
5月24日(Wednesday)10:30 saw a sharp drop due to the Reserve Bank of New Zealand(RBNZ: Reserve Bank of New Zealand) policy rate announcement.
2. Best Select Try the indicator
The figure below is a screenshot taken onMay 2023 at 24 12:50 (JST).
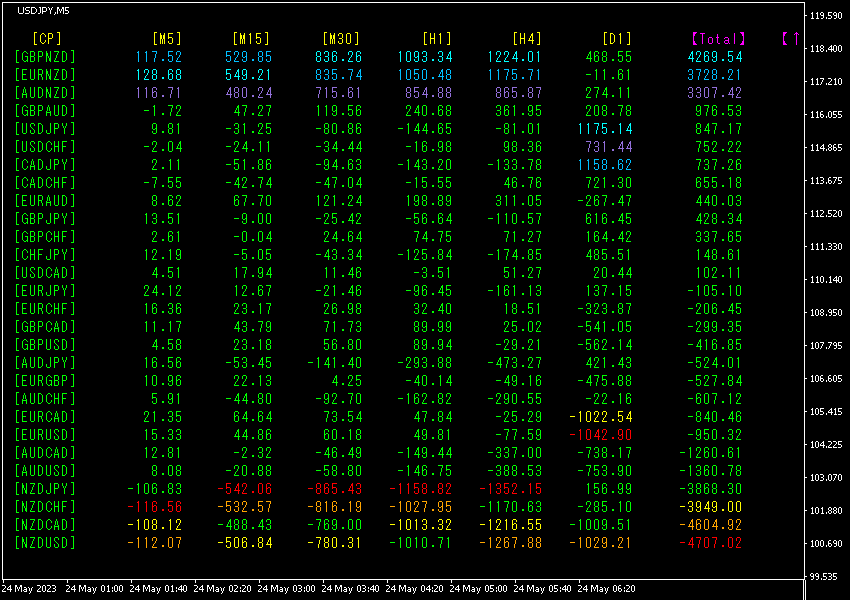
Total ordering numbers in descending order. The top row’sGBPNZD shows blue numbers on all timeframes except D1.Total value is4269.54, a large positive figure. The top three rows are NZD and the bottom four rows are NZD-based pairs. Since NZD weakened, NZD-based pairs rose, while non-NZD pairs fell. Among them, GBPNZD was the most influential.
Now, let’s look at the GBPNZD chart.GBPNZD chart shows a generally uptrending pattern, with a sharp rise on Wednesday caused by the RBNZ policy announcement. If you held a long position in GBPNZD, you could have gained about
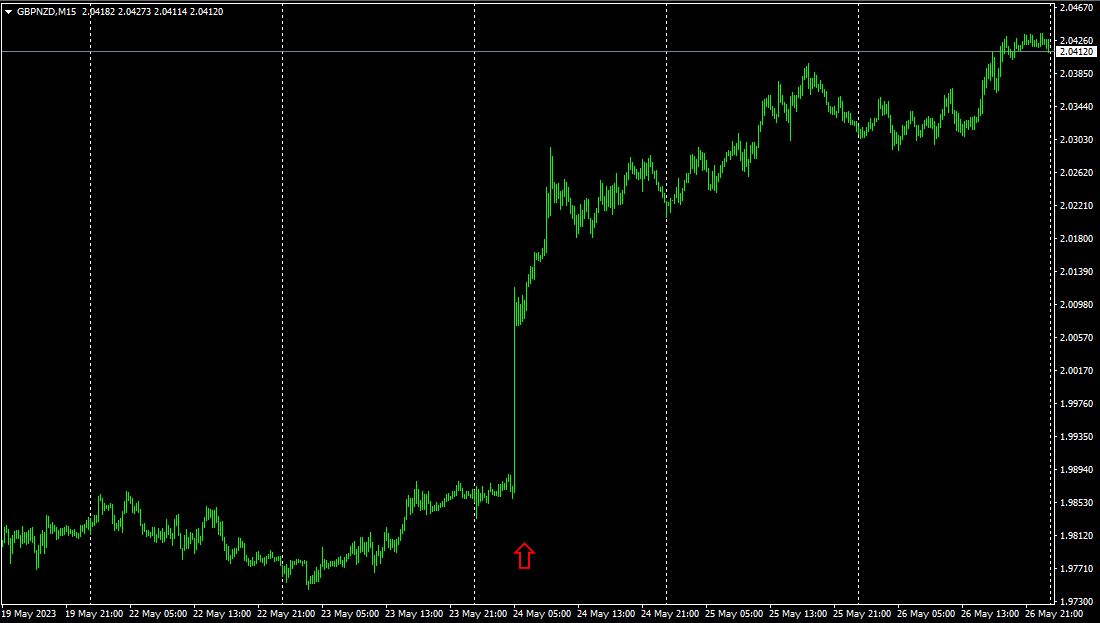
550 pips in profit. Even after the spike, the price continued to trade higher, and breaking above the spike high would still yield about of profit.
“28 Currency Pairs Best Select Indicator” not only identifies which currency is in the strongest trend among the 28 currencies, but also allows quick assessment of all currency pairs at a glance.
“28 Currency Pairs Best Select Indicator”

https://www.gogojungle.co.jp/tools/indicators/35128
3. What happened to EURJPY since May of the year before last?
Since May 2021, May, we have been tracking EURJPY.
To view the overall trend, I am drawing about the last three weeks on a 30-minute chart.
Previously, I wrote the following.
EUR and both show roughly horizontal movement. In terms of currency strength,EUR is stronger, is weaker, but if rises in the future, EURJPY may trend down slightly.
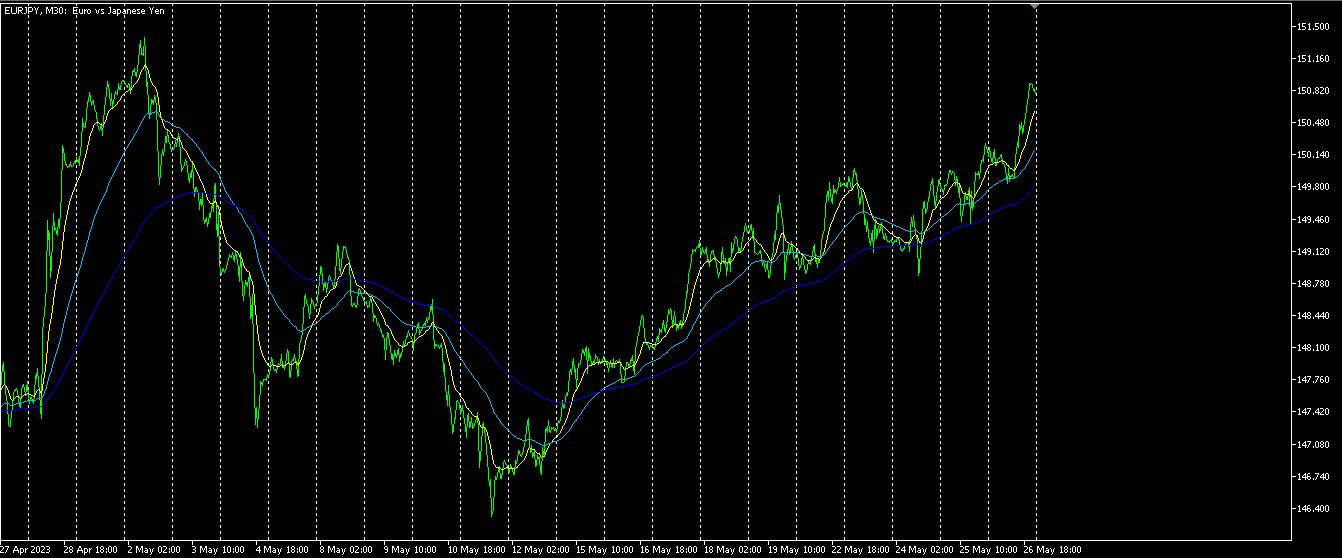
is strong, is weak, so it rose.
4 Time-frame currency strength chart.
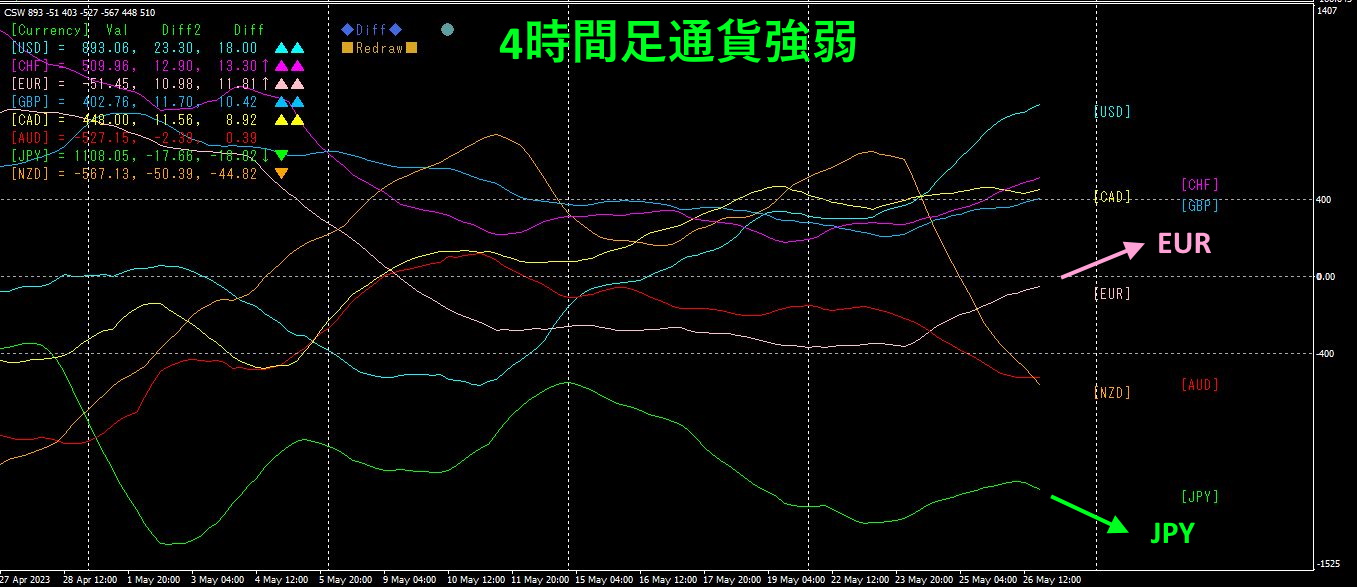
Pink isEUR, green isJPY. EUR is rising, EUR and EURJPY
4. Find tops and bottoms from all currency pairs and develop a trend strategy (continued)
I am planning a trading strategy to buy at a bottom.
Previously,
since the bottom, the stock has entered the ascent stage, so by repeatedly breaking the diagonal line to the upside, you can steadily profit from the market. you can consistently profit from the market.
That is what I wrote.
4 Time-series chart.
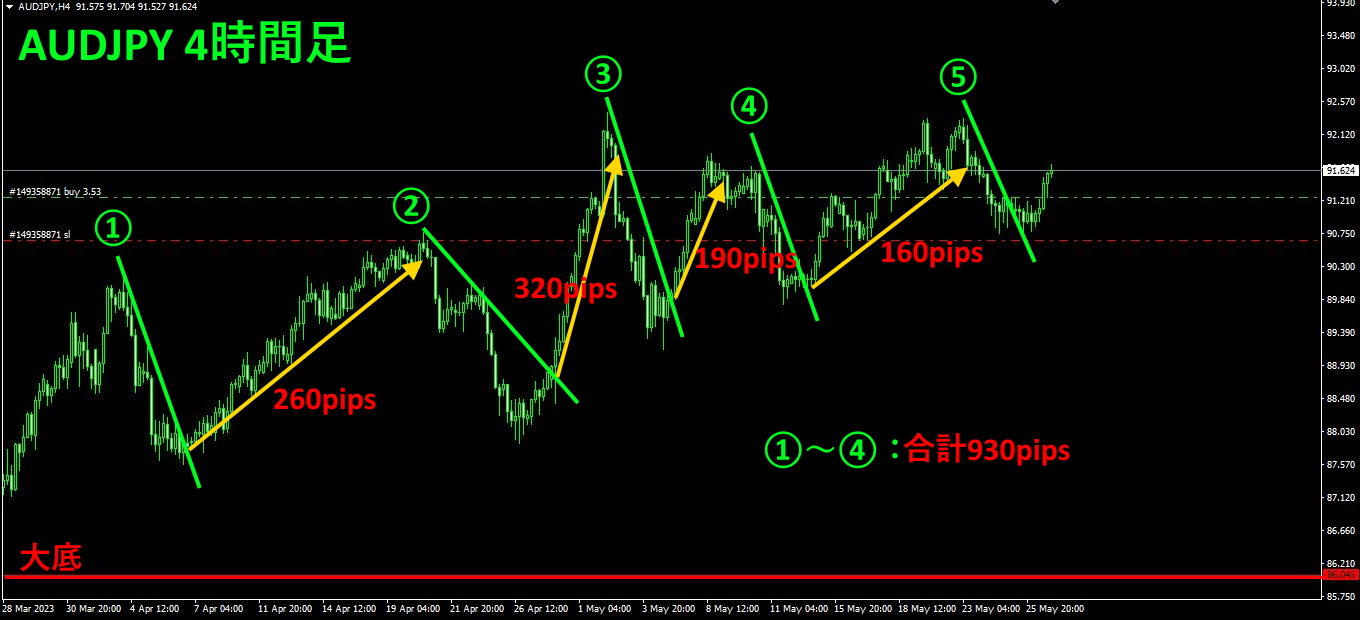
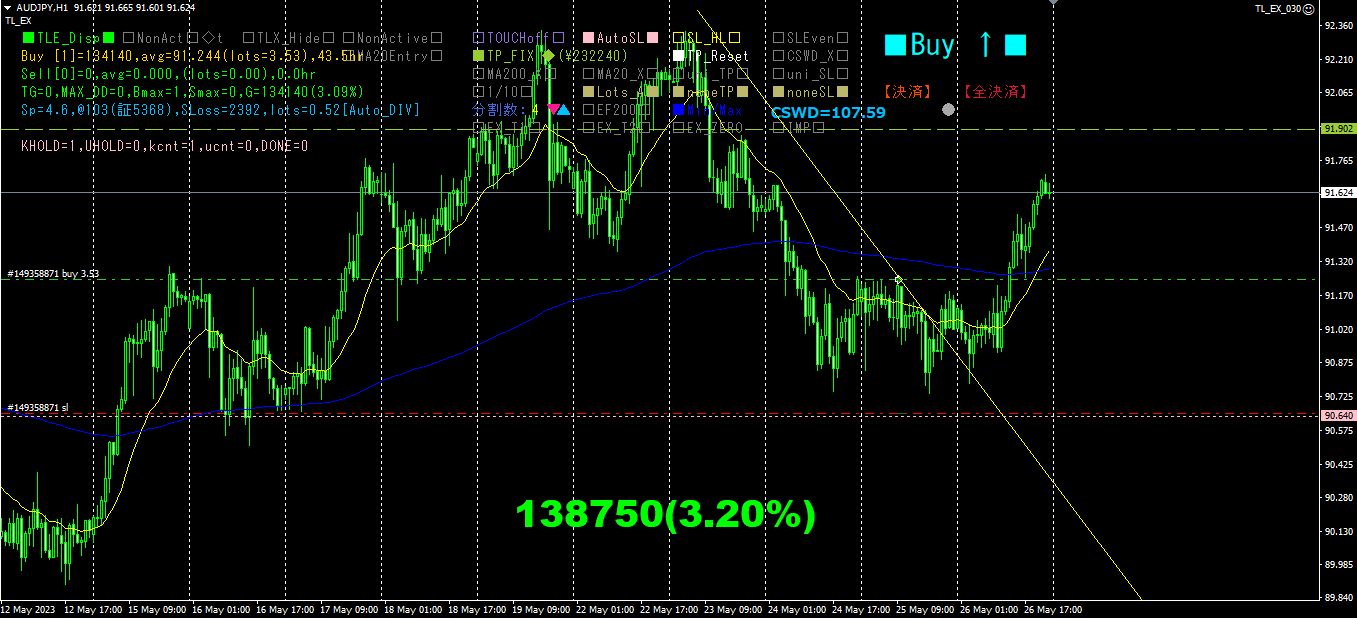
By simply repeatedly trading with the rule “buy when the diagonal breaking line is broken upward,” total profit from steps ① to ④ was about930 pips. Currently, I have drawn line ⑤ and am holding a long position, with an unrealized gain of approximately.
on the1EA “Trend Line EX” is used as shown below.
“Trend Line EX”

https://www.gogojungle.co.jp/tools/indicators/42257
For those interested in the “8C currency strength visualization indicator,” please refer to the following page.
MT4 version https://www.gogojungle.co.jp/tools/indicators/39150
version https://www.gogojungle.co.jp/tools/indicators/39159
【My listed products】


