

Bitcoin rises sharply! And then plunges! Continued buy stance for the long term, but will the presidential election have an impact?
Hello everyone, Bitcoin! I love the chilly air from autumn to winter@xi10jun1and I am.
Time flies; we’re already on the second installment. Between blogging and editing this column, time passes quickly, doesn’t it?
With that said, from this installment I will write about Bitcoin market analysis.
About my trading style
First, I’ll clearly state the trading style, which I didn’t describe much last time.
Basically it is discretionary and swing trading, with margin trading. With margin trading, you can aim for profits whether you go long or short.
And for the chart, I use Heikin-Ashi candles and moving averages (5, 25, 75 daily lines). Heikin-Ashi makes trend reversals easier to spot, so I use it often. Details are also clearly stated on my blog for reference →The basics, methods, interpretations, profitability, thinking, and strategies of FX Heikin-Ashi summarized | Yutori-sedai investor Jun
Also, Bitcoin has a high volatility aspect, so if you catch the trend well you can greatly increase profits, but if you don’t strictly cut losses, losses can spread widely. Essentially I place orders with IFDOCO (If-Dall-OCO) so that stops are automatic.
As of November 4, assets
I started trading with 50,000 yen, and now this is how it looks.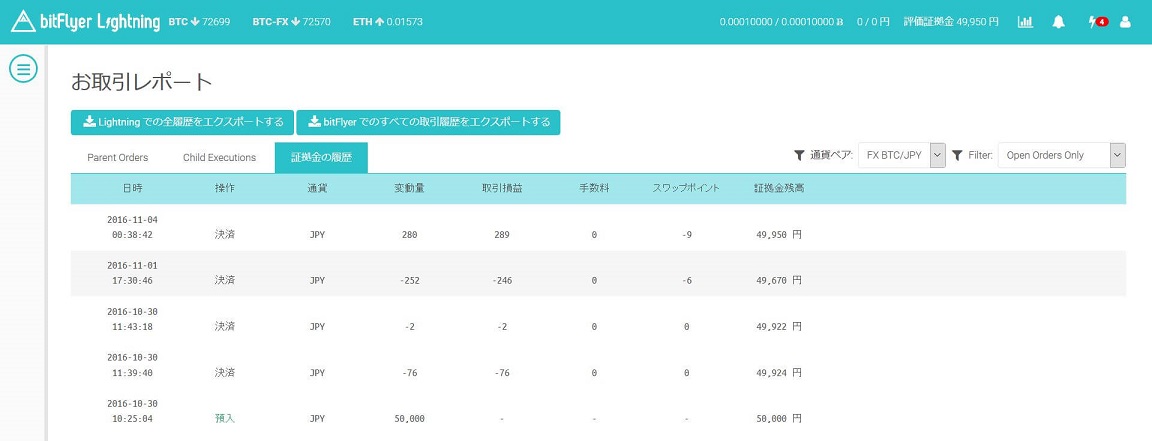
And that’s that!
October 30
I began trading from this day.
First, I’ll look at the daily chart.
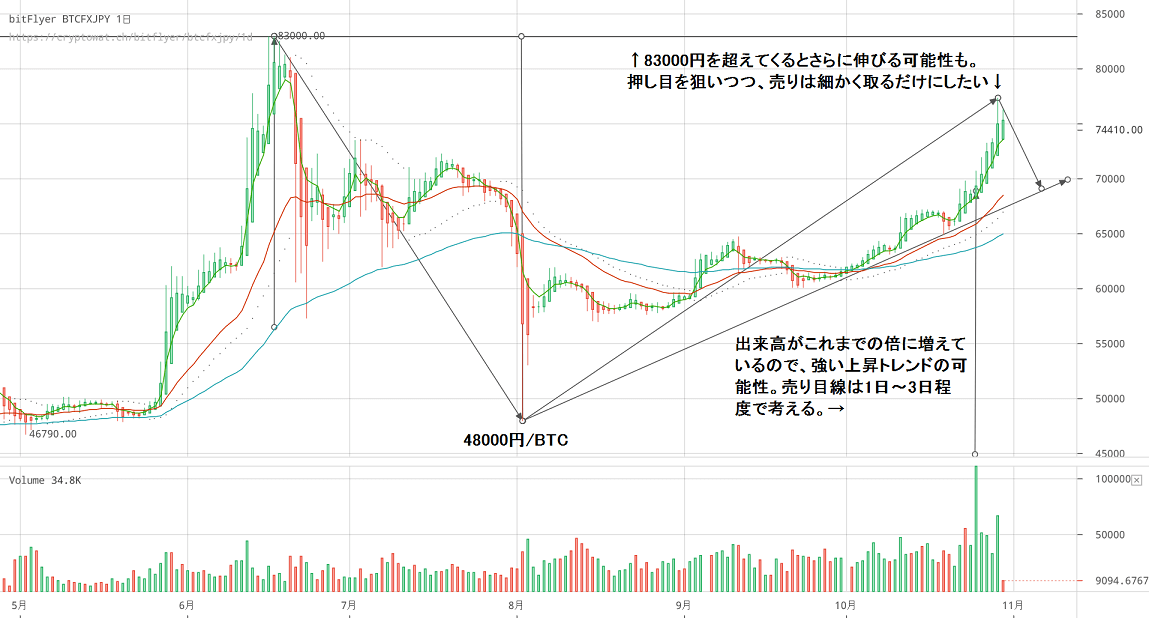
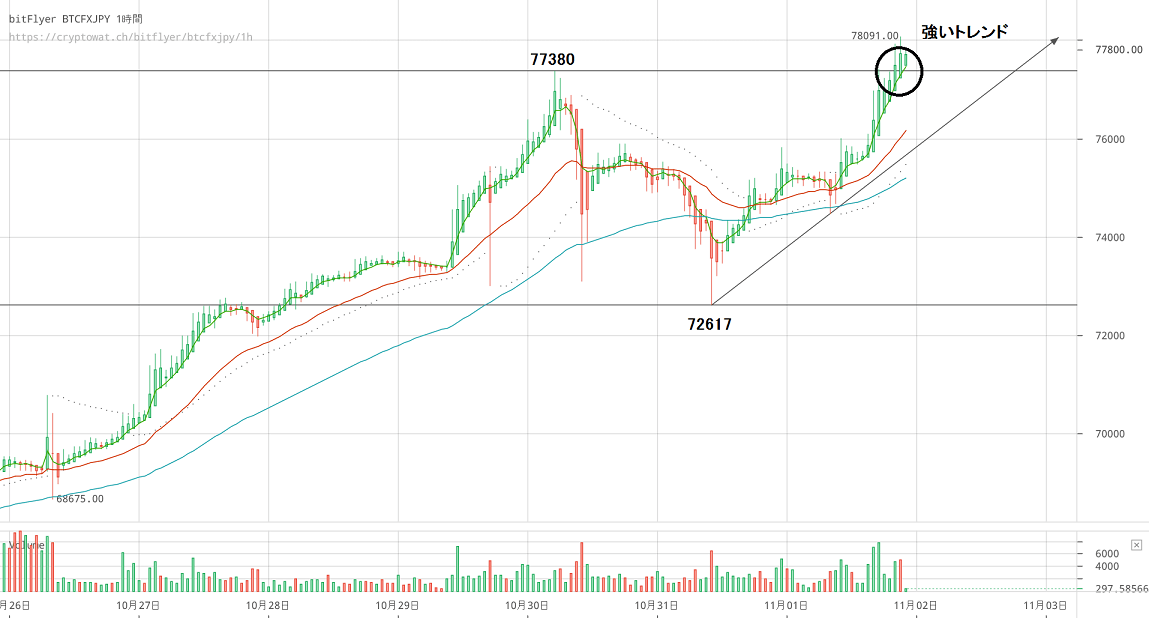
Heikin-Ashi shows that the trend weakens when the next candle is shorter than the previous one. As of October 31, the uptrend was continuing. If subsequent November candles show bearish signs, that would indicate a trend reversal, i.e., the start of a downtrend.
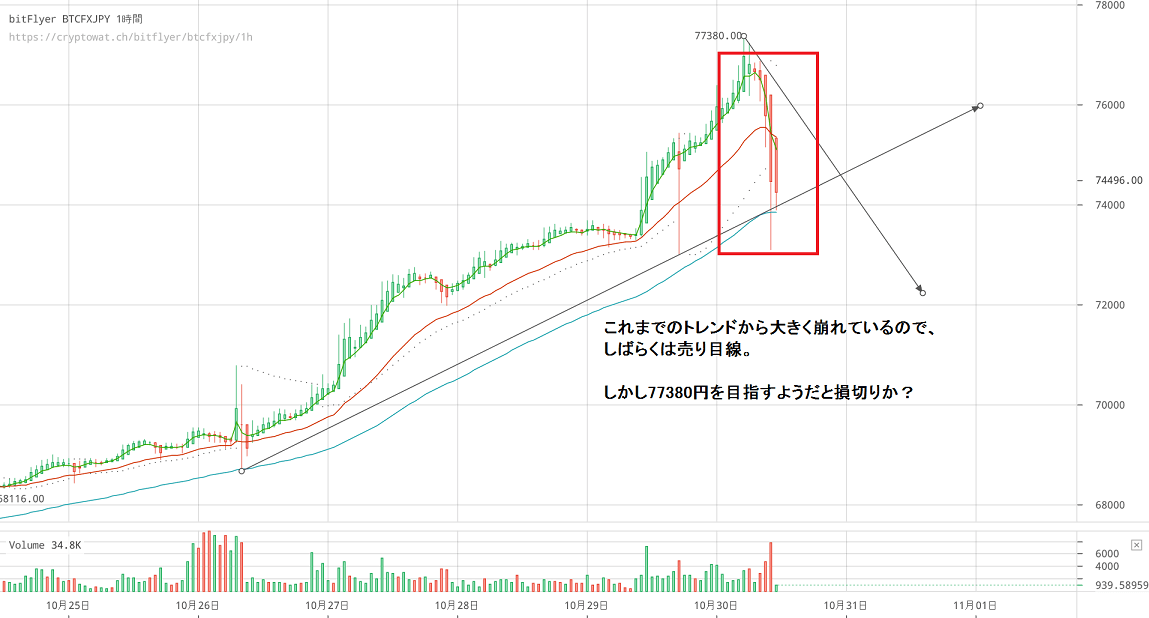
That said, since the uptrend is continuing, there may be a pullback phase. On the same day’s 1-hour chart, as shown in the red box, there was a large sell-off.
October 31
This is also an hourly chart. A downtrend occurred with a two-step drop. However, compared to the prior gains, the drop felt a little milder.
If there were a rapid drop of -5% to -10% (from 77,380 yen to around 73,500–69,600 yen) occurring within a short time, selling would have continued...
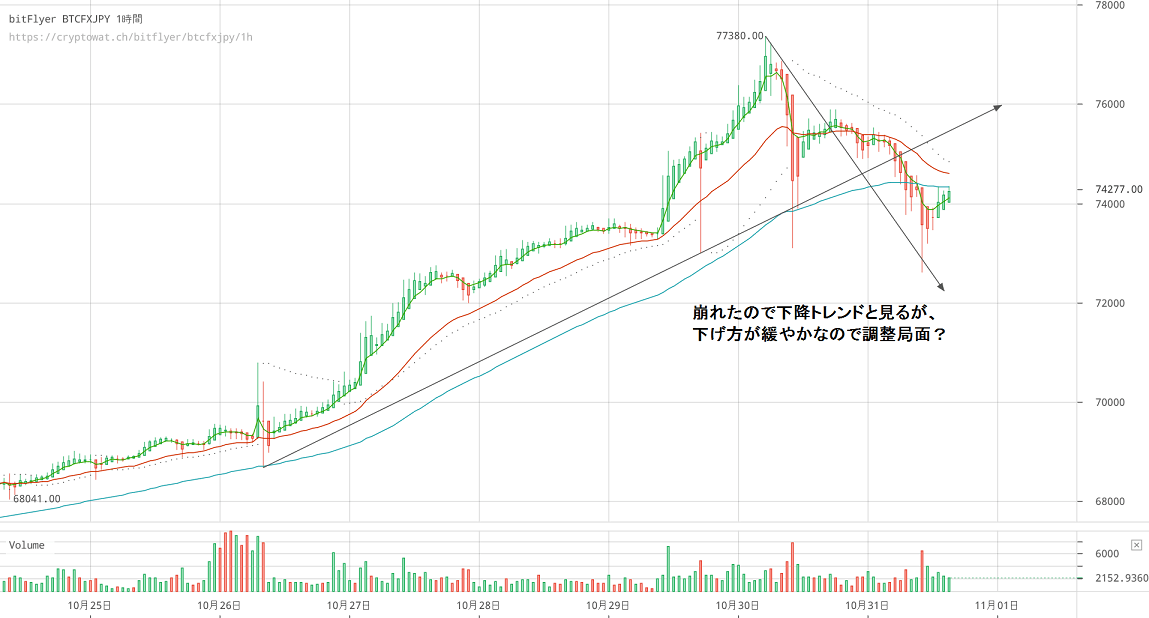
November 1
Ultimately the downtrend did not continue, so it was a pullback. I maintained a short bias, and here I cut losses. Since we surpassed the near-term upside target of 77,380 yen, the uptrend still continues.
At this point I felt like selling, so I tentatively sold at 77,887 yen.
November 2
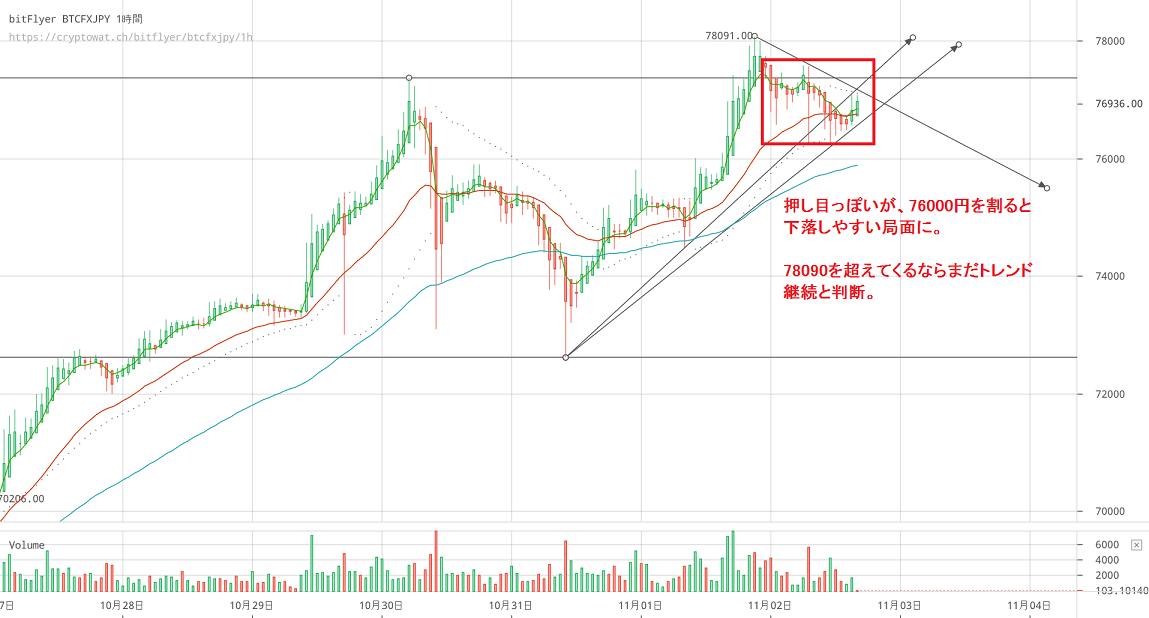
With price breaching 78,000 yen, I thought it might still be a buying bias, but it seems to be another pullback. It feels like the upside is getting a bit heavy. If it breaks below 76,000 yen, or decisively breaks below the 75-period moving average, it could enter a downtrend.
The 77,887 yen position remains open.
November 3
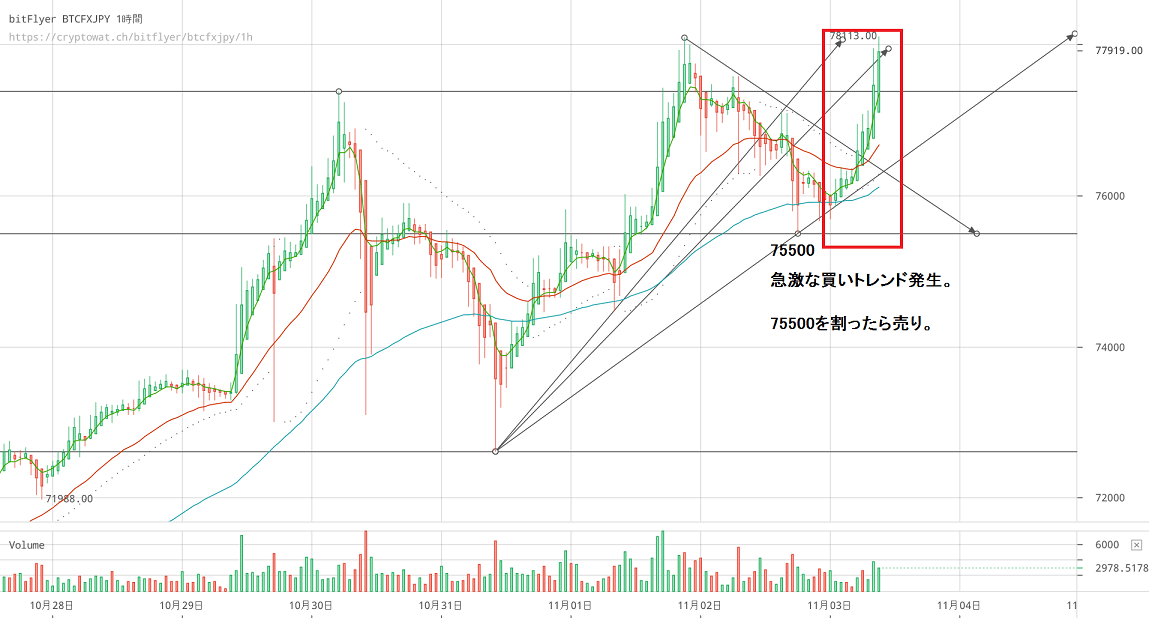
When the 3rd came, a sharp buying trend occurred and not only did it surpass 77,380 yen, but it even exceeded 78,100 yen. On the 2nd, the yen appreciated against the dollar, so Bitcoin was expected to be sold and yen bought, but it was completely different.
The 77,887 yen position was already ordered, so I waited and watched. On the 4th, Bitcoin suddenly dropped, turning 77,887 yen into a 75,000 yen claim and I made a profit.
Free column summary: Watch out for volatility!
Volatility is so high that price movements happen in the blink of an eye. As Bitcoin attracts more participants, a long bias might be better in general. Profiting on the short side seems difficult...
The column will continue in this format, so I appreciate your continued readership!
※ Free content ends here. Going forward, there will be detailed analysis and future outlooks, which will be paid content. If you’re interested, please subscribe!