
As of 2023/05/18 16:30 Japan time, USD/JPY from thesupport/resistance break indicator
2023/05/18As of 16:30 USD/JPY
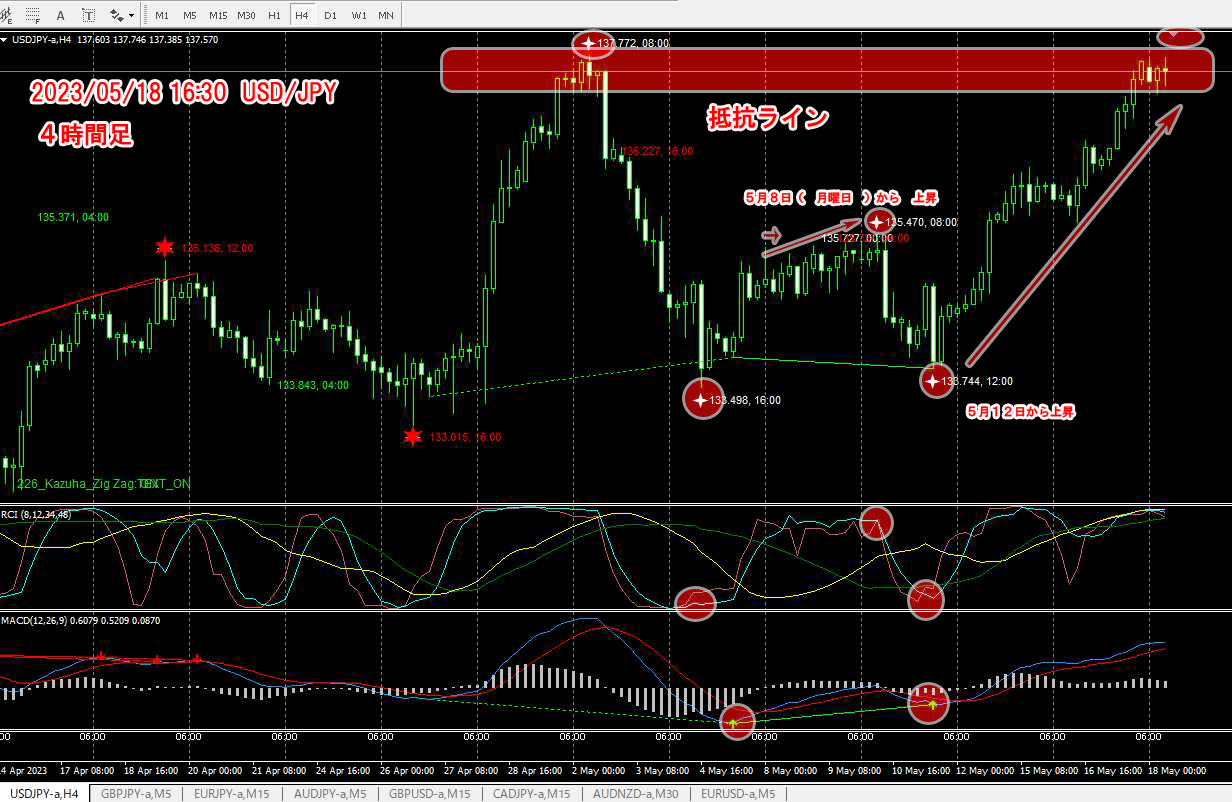
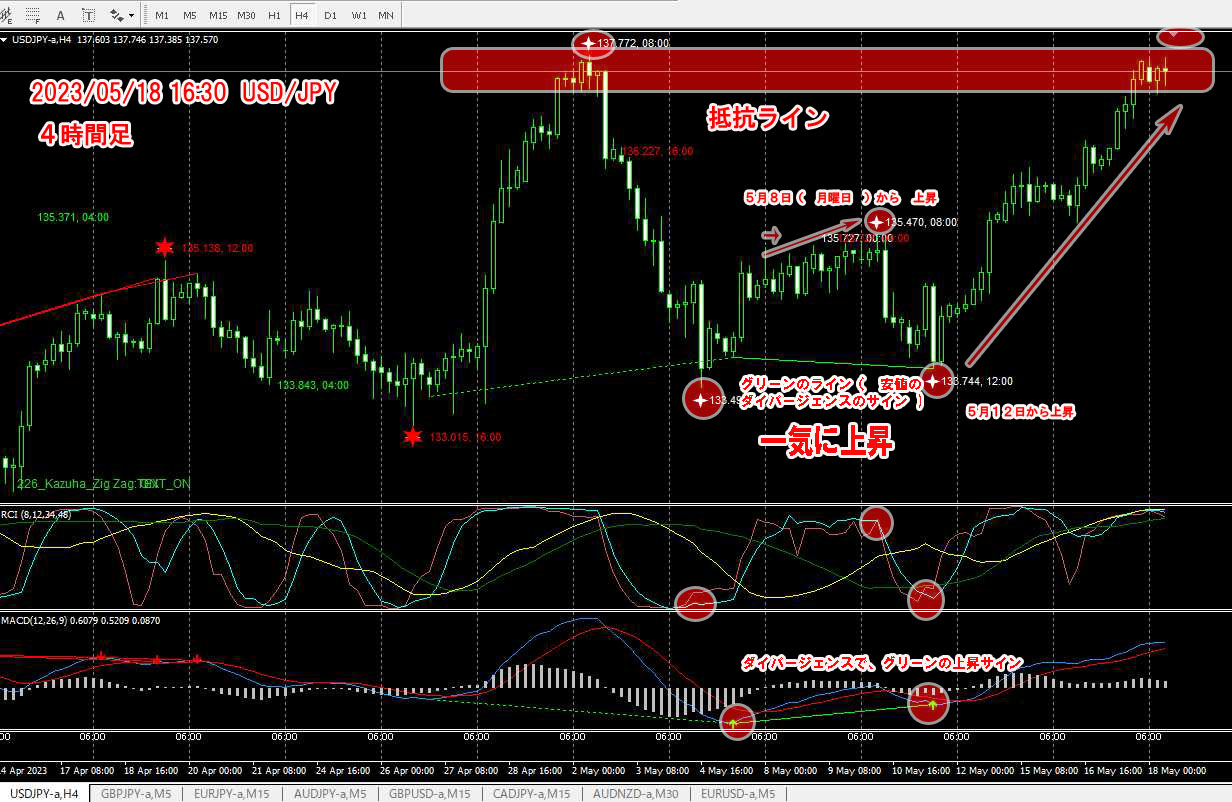
The figure below isthe 4-hour chartin its current state.
In the previous article, USD/JPY was predicted to rise, and it has risen gradually as predicted.
Subsequently it dipped briefly and began rising again from May 12.( Divergence occurred and a green rising signal appeared on the sub-chart )
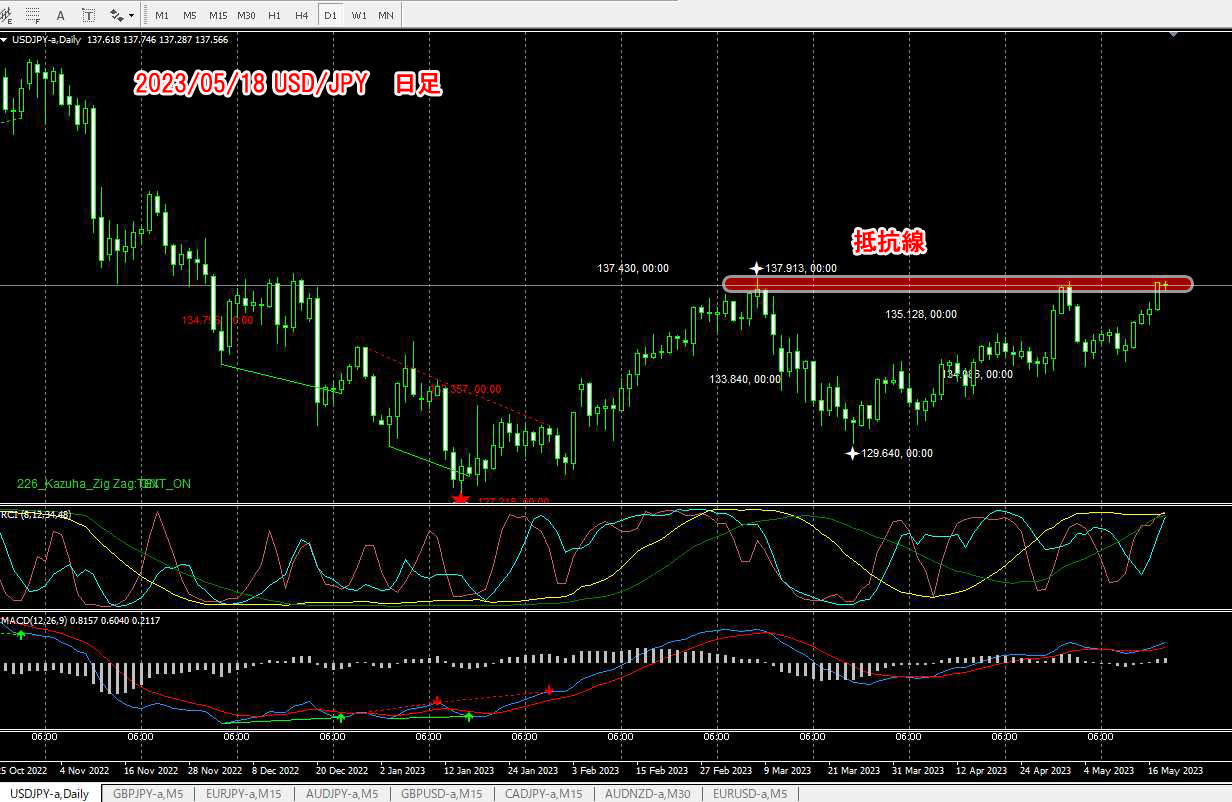
Daily chart image
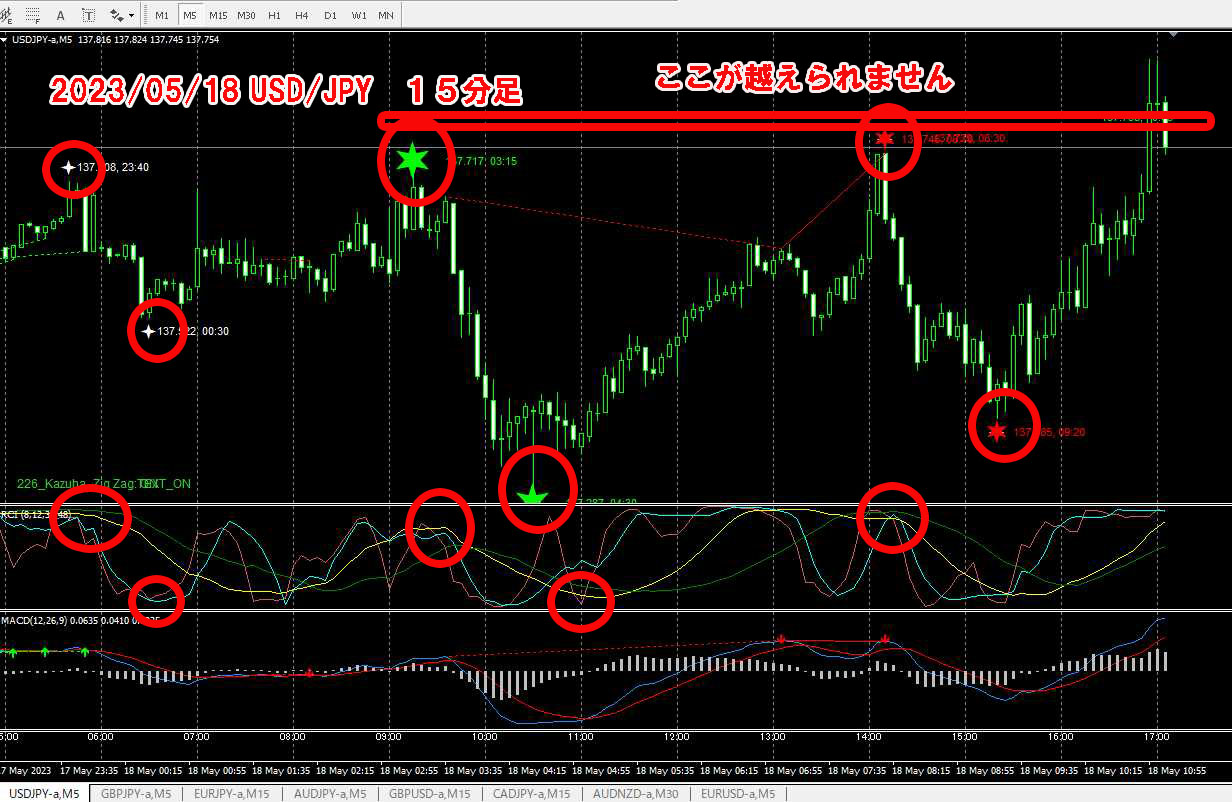
15-minute chart
Even looking at the 4-hour chart or the daily chart,the resistance line is clearly visible and has not been broken.
With shorter timeframes you can trade, but as can be seen on the 4-hour chart, you cannot trade by breaking the resistance line.
As a result,I have no choice but to opt for day trading and scalping rather than swing trading.
Well, trades can still be made with those methods, and that’s fine...
If you want to take bigger profits, timing of entry becomes difficult.
Entry timing often occurs after midnight or around 6 a.m.
So what, you might ask...Just trade in the middle, right...For me and for part-timers, entering during this golden time is a difficult situation.People say, just keep the position and swing it, but...I attempted that, but it didn’t go smoothly.Looking back at the chart later, you think, “If I had entered here and kept the position, it would have been fine,” but...We can’t know such future things...With a 15-minute chart, you can trade sufficiently and there are many opportunities, but did you watch the chart at that timing?However, even today, since you held a position since around 22:00 yesterday, the move was too slow to capture much.Moreover, you still cannot break the resistance line on the 15-minute chart!!!〇 ConclusionThis instrument pays attention to resistance and support lines and signals appear.On the sub-chart indicators, divergence is automatically drawn when it occurs.It is a classic method, and it works whether it’s gold or anything else, and you can think about how to formulate your strategy.In such cases, to be honest, I don’t want to trade.I am not Shohei Ohtani, so I cannot effortlessly hit a home run with one hand, a ball speed of 180 km/h, or a home run of 139 meters.I cannotThis signal is not a top-to-bottom pinpoint stop either.There may be some deviation to a certain extent (I consider it tolerable), and this may cause a slight repaint (a shift later).In that regard,it comes down to human judgment and discretionary trading experience.However, I traded reluctantly and did not capture much.The good timing was when I wasn’t watching the chart...Well, if you win with these orthodox methods (another method, the 4-line RCI, is also explained in the manual...),your discretionary trading skills will improve, and once you understand the general idea, you can install MT4 on your smartphone and trade with price action as well.I am trading in this style...Check the product here!
Just trade in the middle, right...
For me and for part-timers, entering during this golden time is a difficult situation.
People say, just keep the position and swing it, but...
I attempted that, but it didn’t go smoothly.
Looking back at the chart later, you think, “If I had entered here and kept the position, it would have been fine,” but...
We can’t know such future things...
With a 15-minute chart, you can trade sufficiently and there are many opportunities, but did you watch the chart at that timing?
However, even today, since you held a position since around 22:00 yesterday, the move was too slow to capture much.
Moreover, you still cannot break the resistance line on the 15-minute chart!!!
〇 Conclusion
This instrument pays attention to resistance and support lines and signals appear.
On the sub-chart indicators, divergence is automatically drawn when it occurs.
It is a classic method, and it works whether it’s gold or anything else, and you can think about how to formulate your strategy.
In such cases, to be honest, I don’t want to trade.
I am not Shohei Ohtani, so I cannot effortlessly hit a home run with one hand, a ball speed of 180 km/h, or a home run of 139 meters.
I cannot
This signal is not a top-to-bottom pinpoint stop either.
There may be some deviation to a certain extent (I consider it tolerable), and this may cause a slight repaint (a shift later).
In that regard,it comes down to human judgment and discretionary trading experience.
However, I traded reluctantly and did not capture much.
The good timing was when I wasn’t watching the chart...
Well, if you win with these orthodox methods (another method, the 4-line RCI, is also explained in the manual...),
your discretionary trading skills will improve, and once you understand the general idea, you can install MT4 on your smartphone and trade with price action as well.
I am trading in this style...