

Usage of "Visualization Indicator" (Part 94)
“Visualization Indicator” usage (part94)”
1. Further evolve the “28 Currency Pairs List Indicator” into an indicator
“8CP Visualization Indicator”to draw NZDCHFNZDCHF.
There are Oceania, London, New York, and AnyCP versions of the “8 CP Visualization Indicator.” This time, I used the AnyCP version.
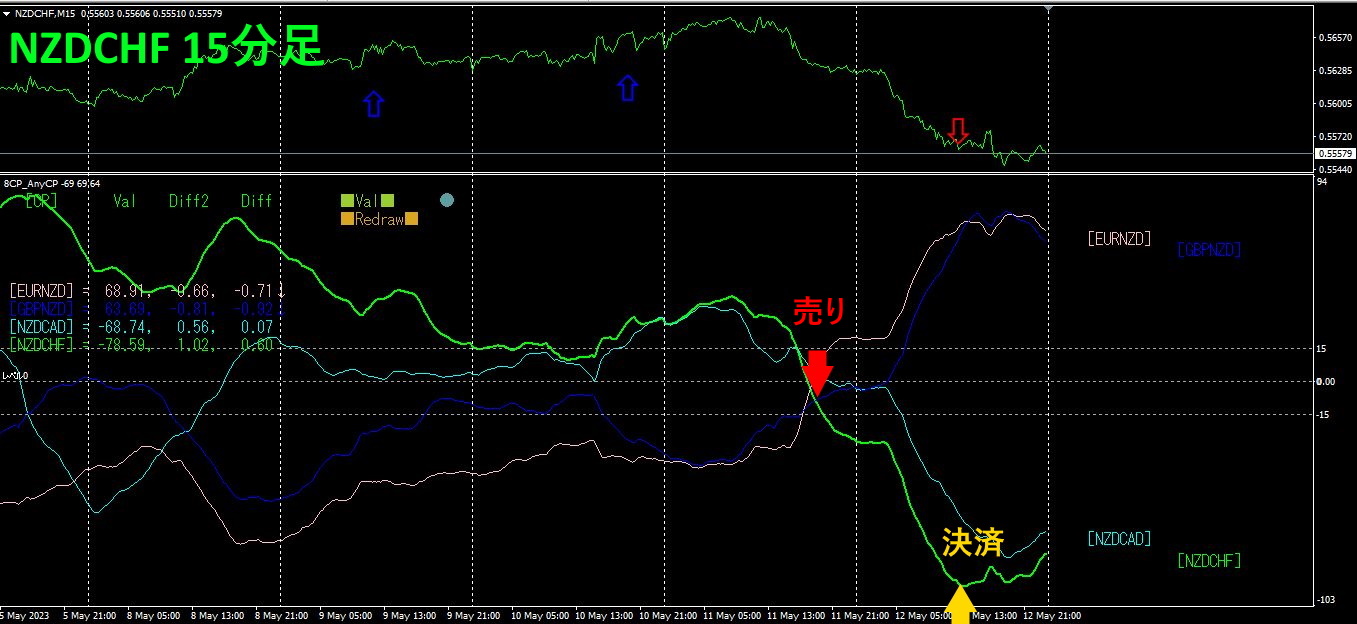
The upper half is the NZDCHF 15-minute chart. The arrows in the upper half indicate the alert positions of the “28 Currency Pairs List Indicator.” The lower half is from the “8 CP Visualization Indicator.” The green thick line chart corresponds to NZDCHF.
On Thursday, NZDCHF fell below other chart groups, so I entered a sell position and closed it on Friday.Approximately70 pips profit..
2. Best Select Try the Indicator
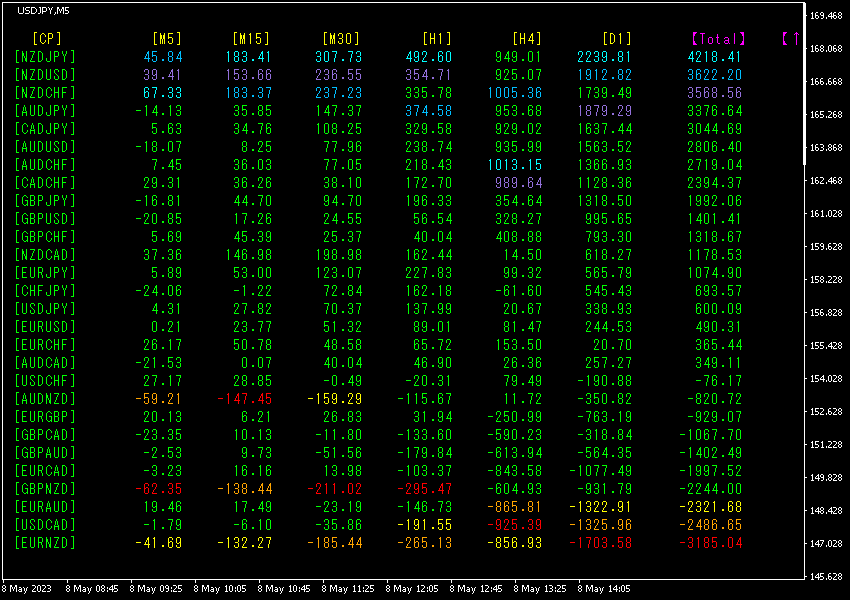
Total numbers are sorted in descending order. The top line’sNZDJPY shows blue numbers on all timeframes except for [H4].Total value is4218.41, indicating a large positive figure. indicates a strong uptrend.
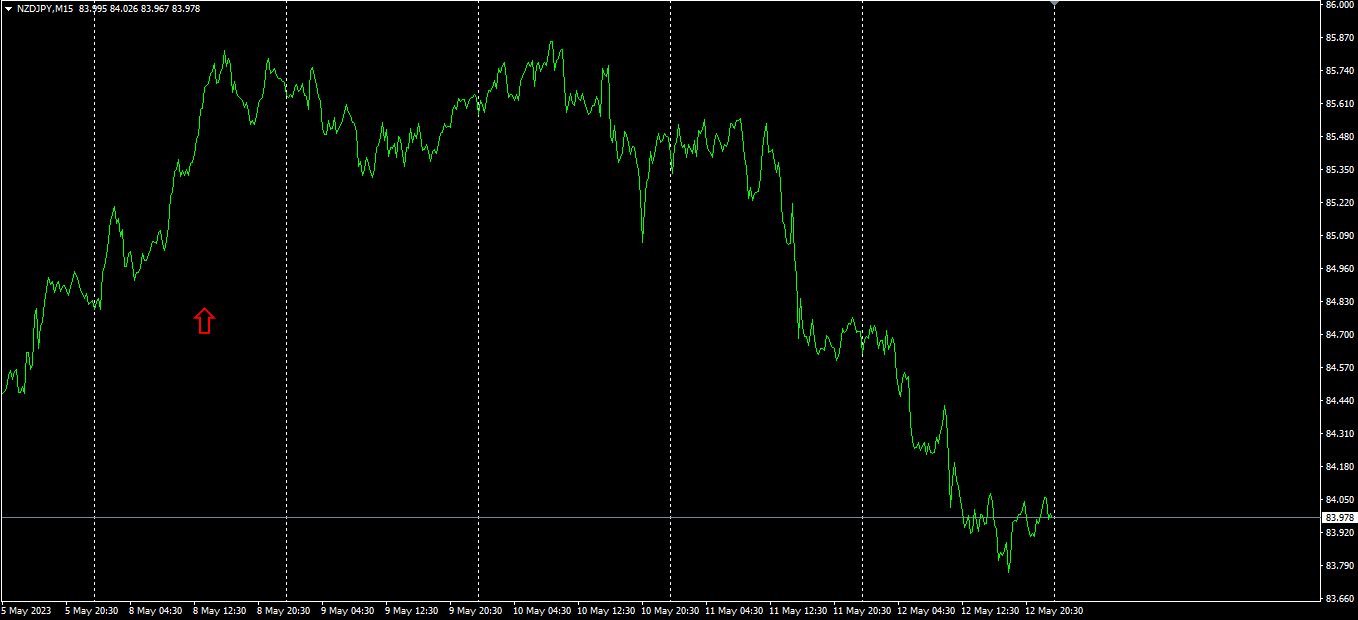
The red arrows mark the point where the screenshot was taken. It accurately captures the uptrend section. The “28 currency pair Best Select indicator shows which of all 28 pairs has produced the strongest trend among all currency pairs. If you buy with a trend-following approach, you will profit.
“28 currency pairs Best Select indicator”
https://www.gogojungle.co.jp/tools/indicators/35128
3. Since May of the year before lastMay, we have been trackingEURJPY movement. What happened?
year May began EURJPY
To view the overall trend, I have drawn about the most recent30 minutes of the last3 weeks on a 30-minute chart.
Previously, I wrote as follows.
Both EUR andJPY are moving downward, butJPY falls at a steeper angle thanEUR; if this trend continues,EURJPY is likely to move slightly downward.
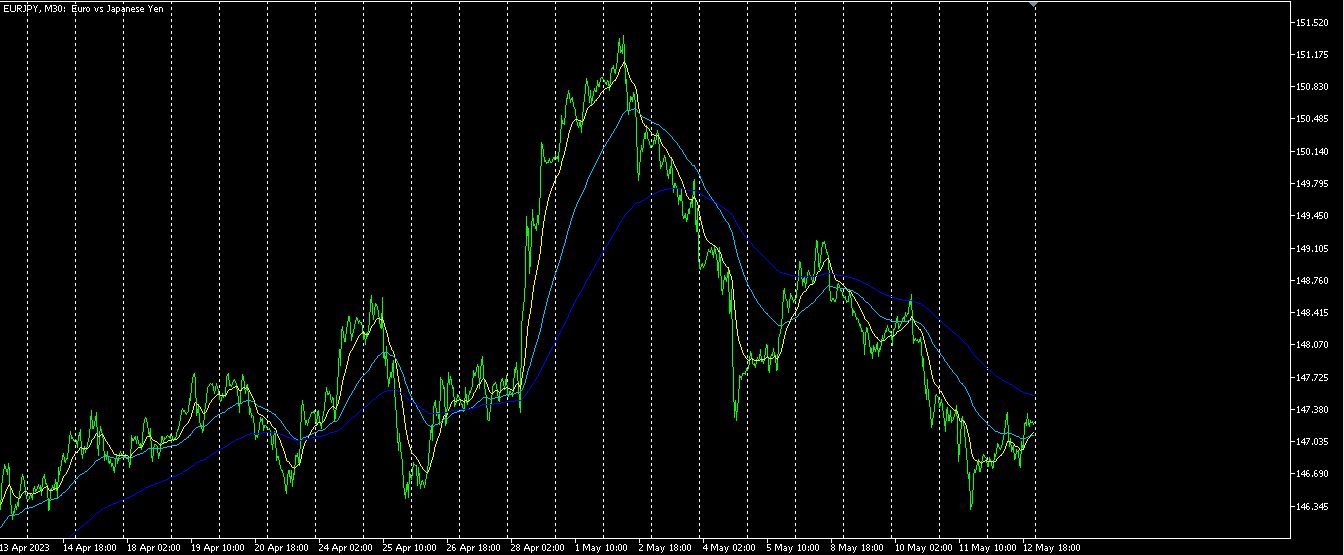
As predicted previously, it has declined.
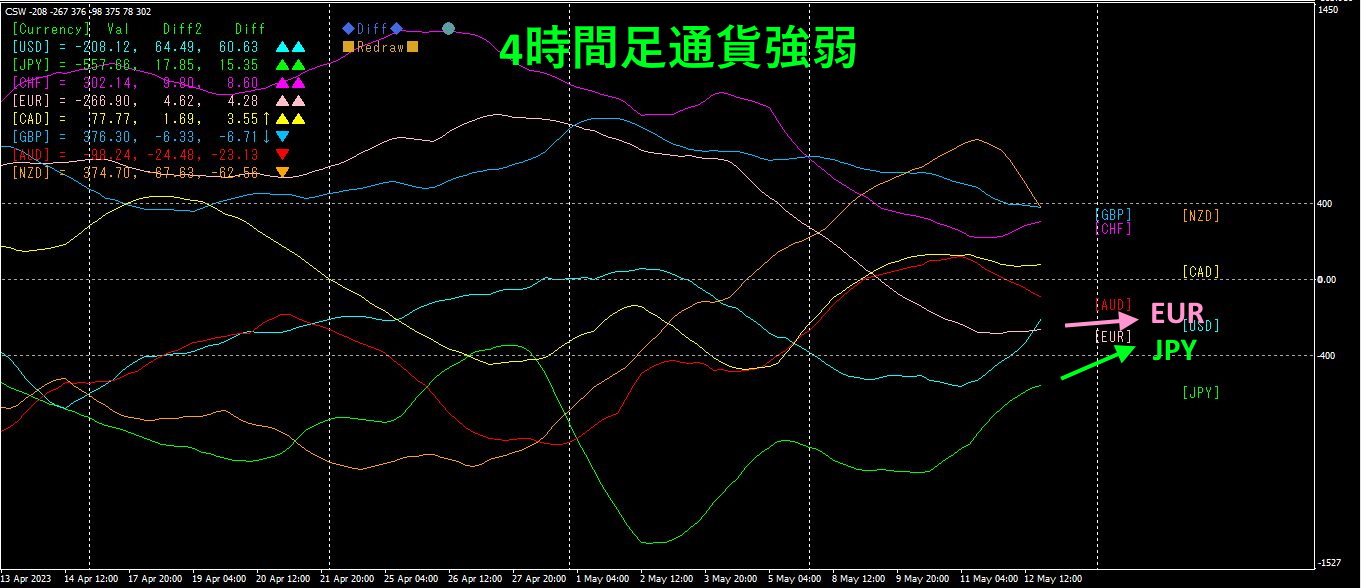
Pink indicatesEUR, green indicatesJPY.EURJPY are both rising, butJPY has a steeper angle thanEUR, so EURJPY tending slightly downward is likely. However, since the lower support line is near, the decline should be limited.
4.
We are forming a trading strategy to buy AUDJPY at the bottom.
Last time,
On the 24th of March, the bottom was reached and the price has since moved into an upward trend with higher highs and higher lows. In such a market, as shown by lines green ① to ③, drawing a diagonal downward-sloping line and buying when the price breaks above the line would allow steady profits from the market.
That is what I wrote.
4
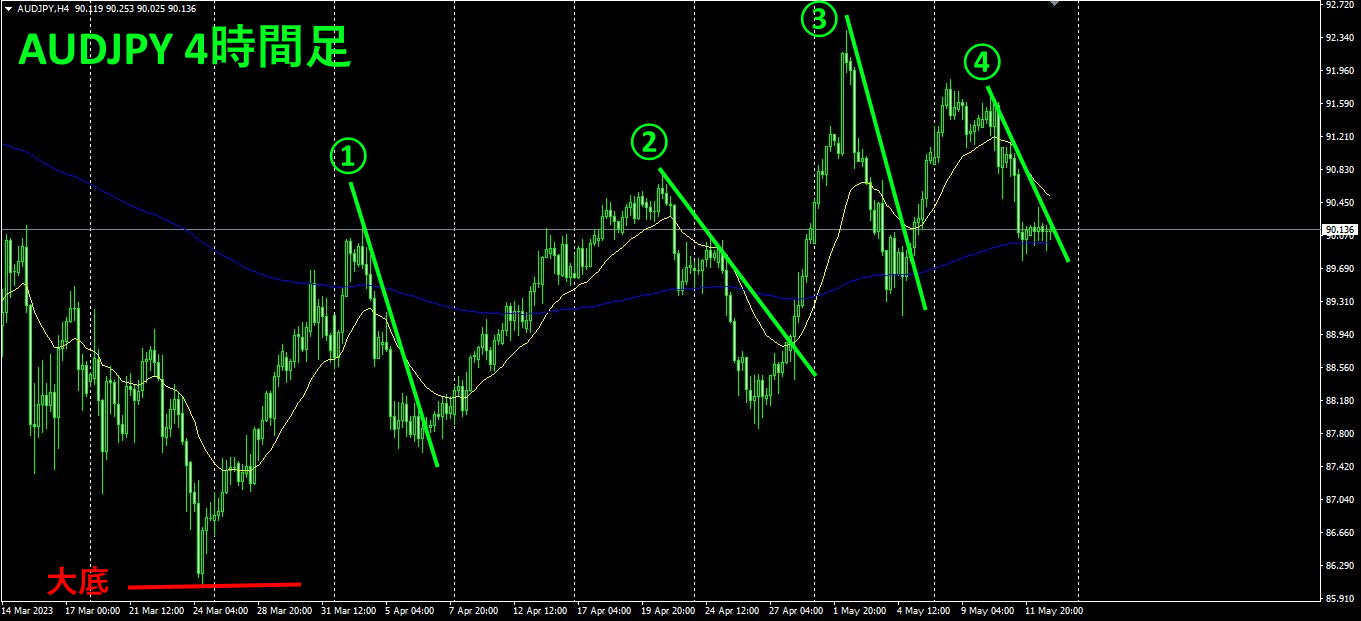
As a trading strategy, as before, draw diagonal down-sloping lines indicated by green lines ① to ④, and buy when the price breaks above the line.
Since the price is entering the rising stage from the bottom, with a strategy of buying when the diagonal line is broken upward, you can reliably profit from the market. A semi-automaticEA such as will handle entries and take-profits automatically.
※“”

https://www.gogojungle.co.jp/tools/indicators/42257
If you are interested in the “8C Currency Strength Visualization Indicator,” please refer to the following page.
MT4 version https://www.gogojungle.co.jp/tools/indicators/39150
MT5 version https://www.gogojungle.co.jp/tools/indicators/39159
【My items for sale】


