

Today's (4/30) top entry point! (ETHUSD)
FX, Binary Options, and Nikkei 225—all in one!
MetaTrader (MT4) Indicator
Today (4/30)’s solid entry point!
(ETHUSD)
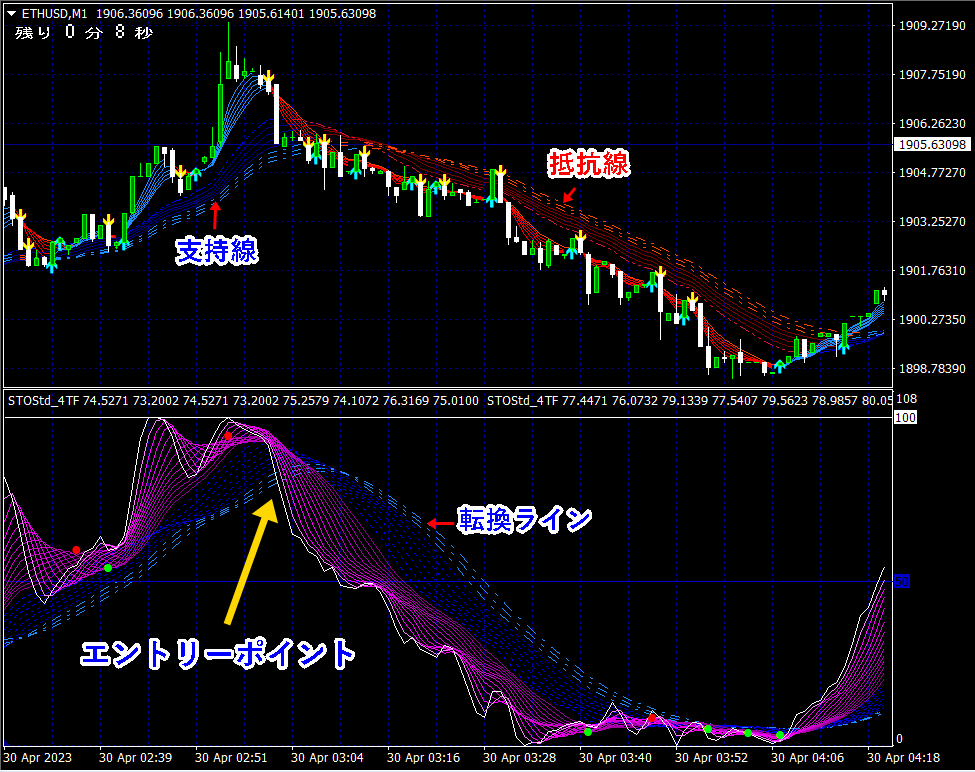
★Break above/below the turning line to enter! (Click image to enlarge) entryAmong the many moving averages, in an uptrend,there is a certain-width line that serves effectively assupportin pullbacks.A certain-width lineexists.Similarly, in a downtrend,there exists a certain-width line that functions asresistancefor retracements.This linehas.In other words, if in an uptrend the price breaks below the support line, a downtrend begins, andin a downtrend, if it breaks above the resistance line without being repelled, an uptrend begins.Thus, the turning line is the same as the support/resistance line.In short, support and resistance become turning lines.This idea also applies to indicators.In the Tenkan/Kijun Chart (Reiwa edition), not only moving averagesbut also the curves of indicatorsdisplay lines that clearly show support and resistance = turning linesas functional lines.【Tenkan/Kijun Chart (Reiwa edition)】Sales page is here【Even with just moving averages, this is amazing!!】Sales page is here
Among the many moving averages, in an uptrend,
there is a certain-width line that serves effectively assupportin pullbacks.A certain-width lineexists.
Similarly, in a downtrend,
there exists a certain-width line that functions asresistancefor retracements.This line
In other words, if in an uptrend the price breaks below the support line, a downtrend begins, and
in a downtrend, if it breaks above the resistance line without being repelled, an uptrend begins.Thus,
In short,
This idea also applies to indicators.
In the Tenkan/Kijun Chart (Reiwa edition), not only moving averagesbut also the curves of indicators
【Tenkan/Kijun Chart (Reiwa edition)】

【Even with just moving averages, this is amazing!!】


