

Utilization of "visualization indicators" (Part 92)
“Visualization Indicator” usage (part92)
1. “28 Currency Pairs List Indicator” further evolved into other indicators
“8CPVisualization Indicator”to drawUSDJPY chart
There are versions of the “8CPVisualization Indicator”Oceania version,London version,NewYork version,AnyCP version. This time, we used theLondon version.
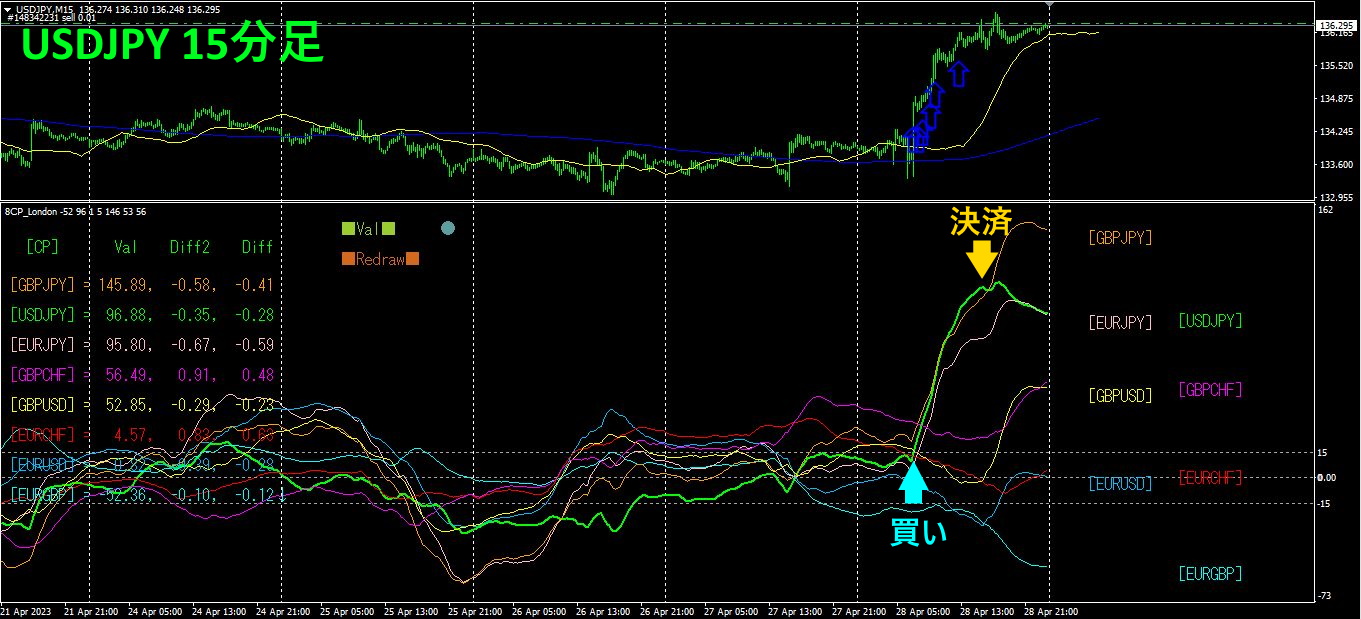
Upper half is the USDJPY 15-minute chart. The arrows on the upper half indicate the alert position of the “28 Currency Pairs
4Month28 day (Friday) and the Bank of Japan policy meeting results caused the USDJPY to move sharply toward weaker yen. With the visualization indicator,USDJPY chart rose above others and a buy entry was made. If profit is taken on Friday night,approximately230 pips profit result.
2. Best Select Try the indicator
The figure below is a screenshot taken onApril 26, 2023 at 18:36 JST.
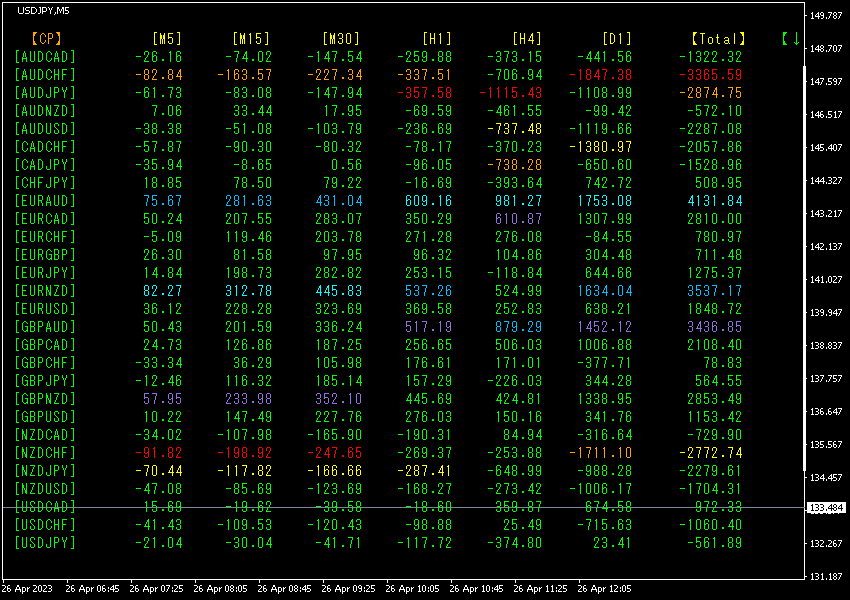
The currency pairs are sorted in ascending order by name. The 9th from the top is9 Euraud, with all timeframes showing blue numbers. value is4131.84, a large positive figure.EURAUD shows a strong upward trend.
Now, let’s look at theEURAUD chart.
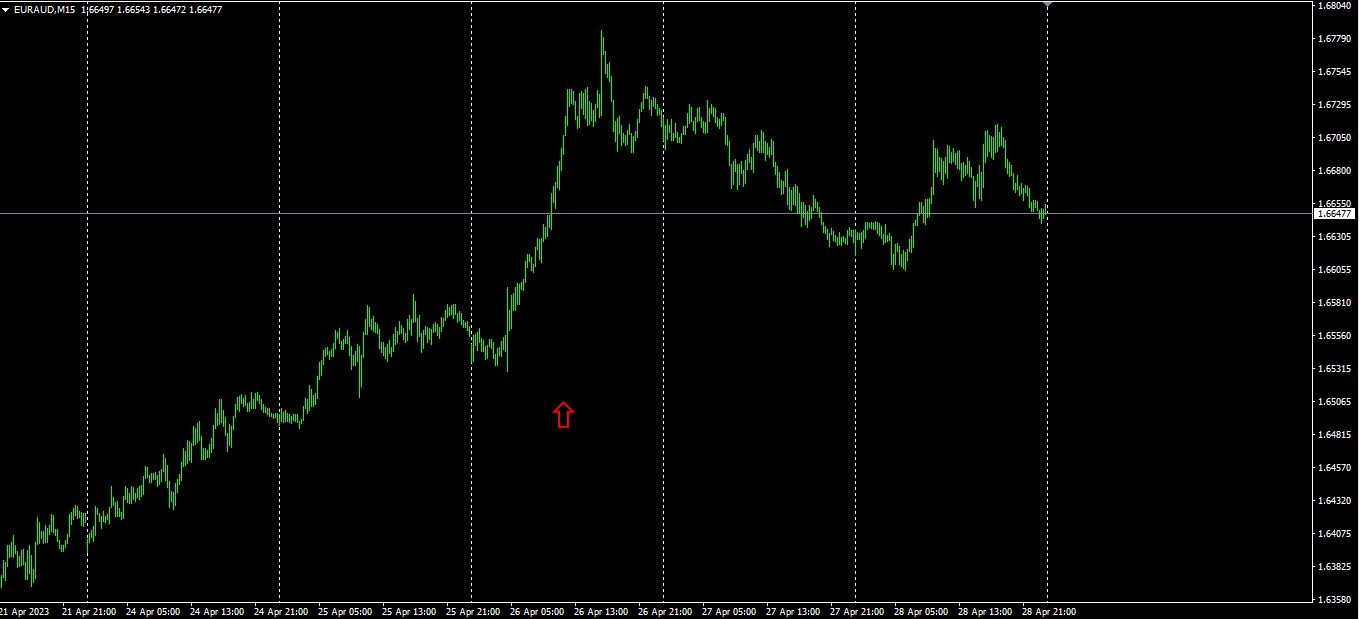
The red arrows indicate the points where the screenshot was taken. The upward trend portion is captured accurately. The “28 Currency PairsBest SelectBest Select indicator indicator” tells you which currency among all 28 has the strongest trend. If you go long with a trend-following approach, you will gain.
“28 Currency PairsBest Select indicator”

https://www.gogojungle.co.jp/tools/indicators/35128
3. What happened since May of the year before last 5? to EURJPY movement
year 5 month onwards EURJPY
To see the overall trend, a30 minute chart showing roughly the last3 weeks is drawn.
Last time, I wrote the following.
EUR and are both rising. Compared withJPY, the angle of EUR is steeper, so if this trend continues,EURJPY is expected to head downward.
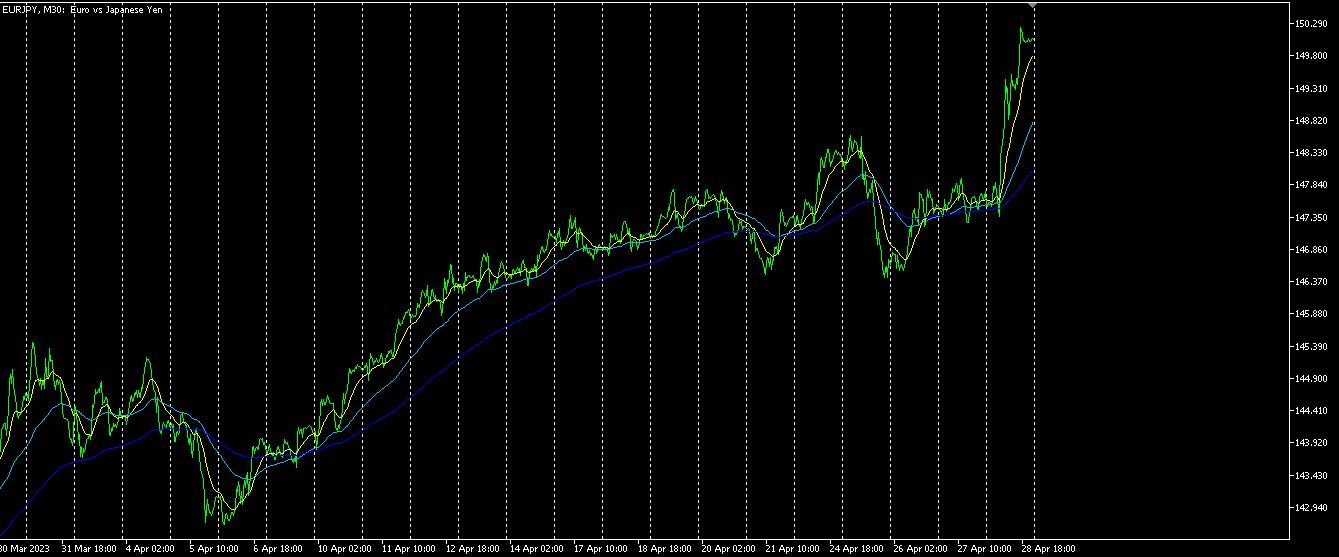
It dropped on Tuesday but then rose.
4Hour timeframe currency strength chart.
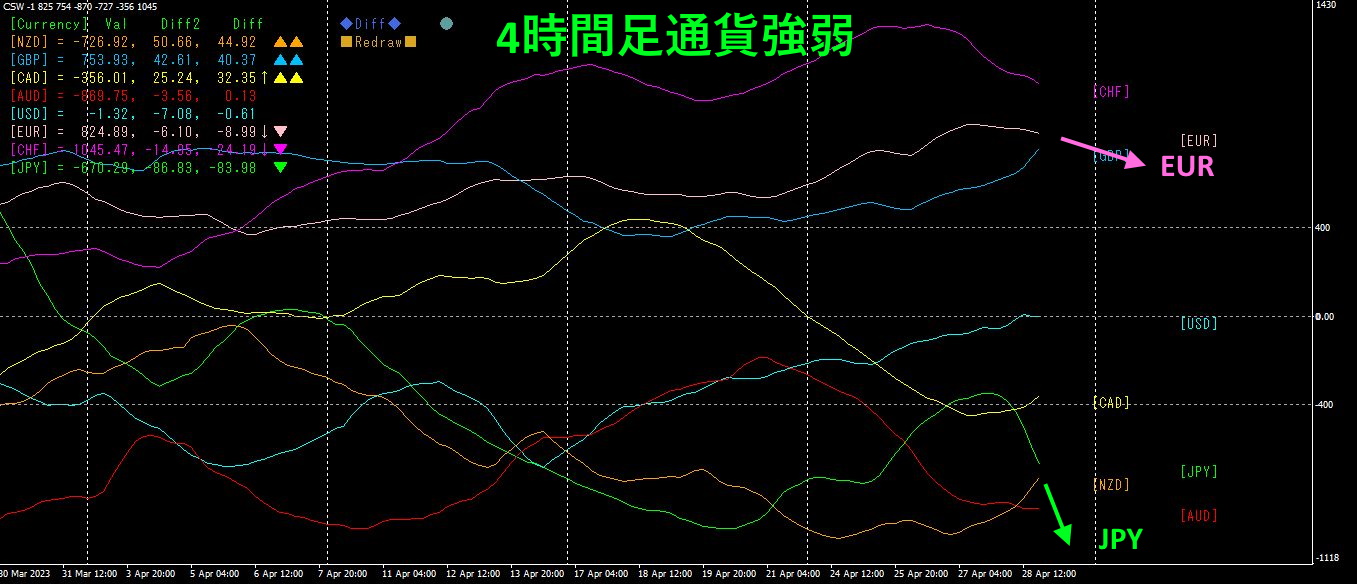
Pink isEUR, green isJPY.EUR andJPY are both downward. The angle of JPY is steeper than EUR, so if this trend continues,EURJPY is expected to head downward.
4. Find all-time highs and lows from all currency pairs to form a trend strategy (continued)
We are forming a trading strategy to buyAUDJPY at a bottom.
Last time,
The red horizontal line initially broke above, but then retraced. A new green diagonal trend line was drawn. Since the asset has already bottomed and trend reversal has occurred, it is expected to move upward. A good strategy is to buy when it touches or breaks upward the green trend line.
That is what I wrote.
Timeframe charts are shown.
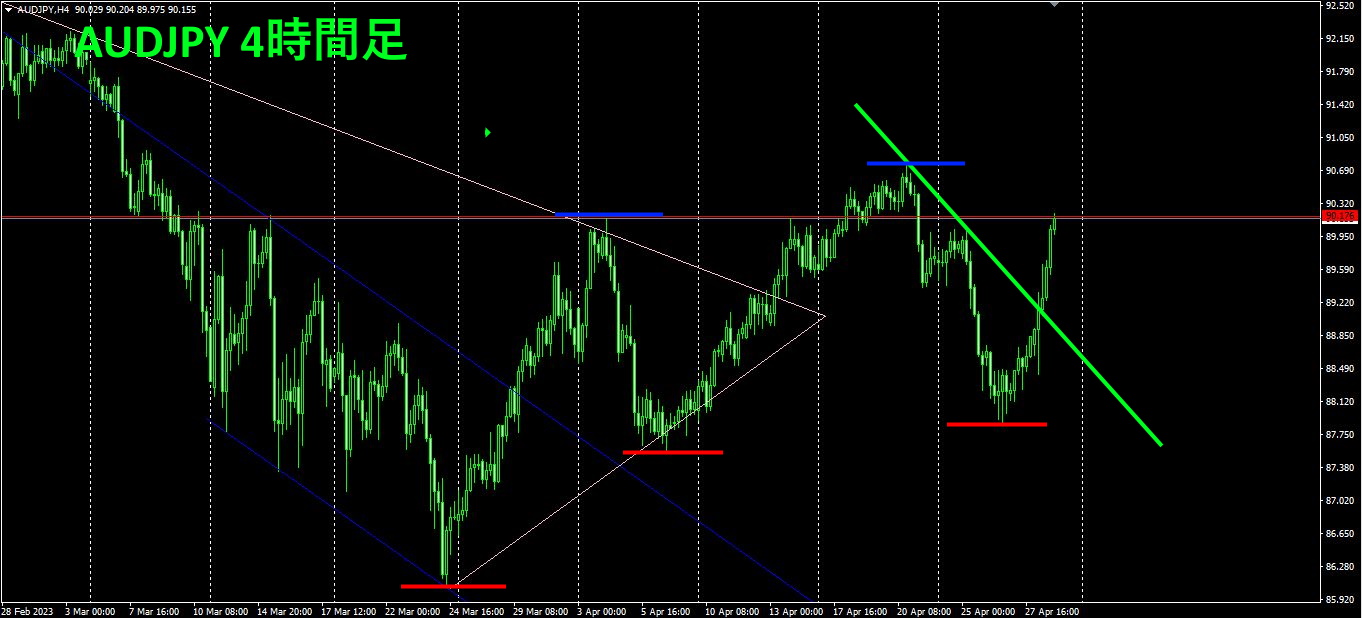
The red horizontal line acts as a resistance line and was retraced once. However, the downtrend has already ended, and a rising trend with higher lows and higher highs has begun. In such a situation, a buy entry on a breakout above the green diagonal line would have been good. It may retrace at the resistance line again, but since the direction is upward, trade by “buying on dips.”
※“Trend Line EX”

https://www.gogojungle.co.jp/tools/indicators/42257
For those interested in the “8C,” please refer to the following page.
MT4 version https://www.gogojungle.co.jp/tools/indicators/39150
MT5 version https://www.gogojungle.co.jp/tools/indicators/39159
【My other items for sale】


