Today's (4/27)鉄板エントリーポイント! (USDJPY)
All対応 FX, Binary Options, and Nikkei 225!
Indicator for MetaTrader (MT4)

Today's (4/27) Solid Entry Point!
(USDJPY)
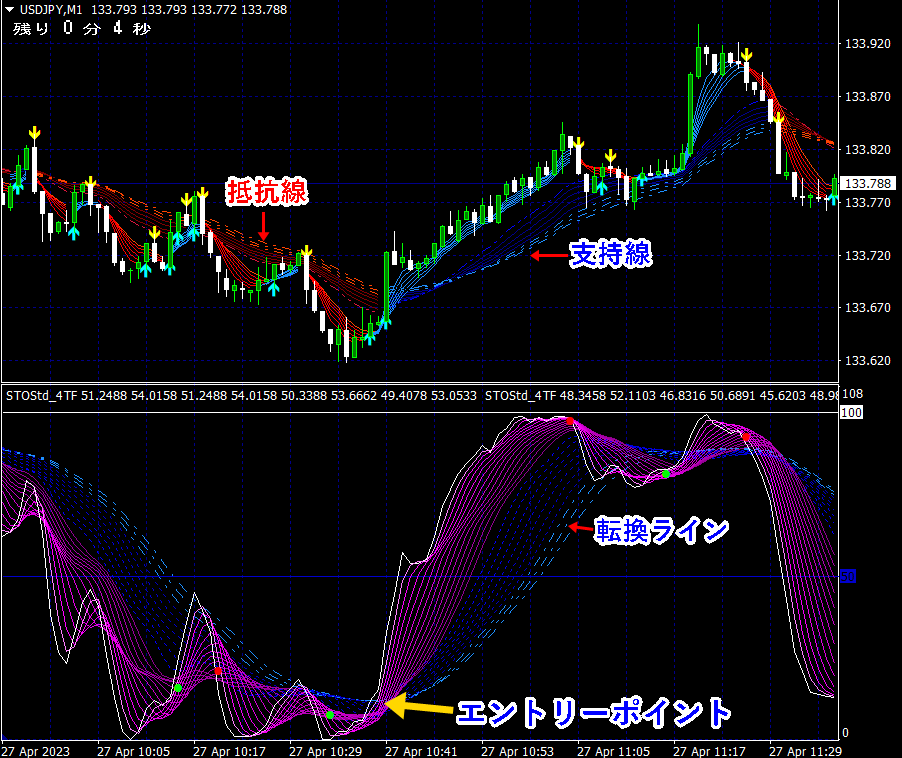
★Enter on break above/below the turning line! (Click image to enlarge)Among the many moving averages, in an uptrend,there exists a line that acts as asupport linethat serves as a reliablesupport line with a fixed widthin an uptrend.Similarly, in a downtrend,there exists a line that acts as aresistance linethat functions effectively asa line of fixed widthin a downtrend.In other words, if in an uptrend the price breaks below the support line, a downtrend begins, andin a downtrend, if price breaks above the resistance line without being pushed back, an uptrend begins.In short,the support and resistance lines become turning linesmeaning they serve as turning points.This concept also applies to indicators.In the Tenka-chart (Reiwa version),not only moving averages, butthe lines of the indicator’s curve bandfunction as support and resistance lines—turning lines—clearly displayed.【Tenka Chart (Reiwa version)】Sales page is here【Even with just moving averages, this is amazing!!】Sales page is here (Click image to enlarge)
Among the many moving averages, in an uptrend,
there exists a line that acts as asupport linethat serves as a reliablesupport line with a fixed widthin an uptrend.
Similarly, in a downtrend,
there exists a line that acts as aresistance linethat functions effectively asa line of fixed widthin a downtrend.
In other words, if in an uptrend the price breaks below the support line, a downtrend begins, and
in a downtrend, if price breaks above the resistance line without being pushed back, an uptrend begins.
In short,the support and resistance lines become turning linesmeaning they serve as turning points.
This concept also applies to indicators.
In the Tenka-chart (Reiwa version),not only moving averages, but

【Even with just moving averages, this is amazing!!】