

Usage of "Visualization Indicators" (Part 91)
“Visualization Indicator” usage (part91)”
1. Further evolve the “28 Currency Pair List Indicator” into an indicator
“8CP Visualization Indicator”to plotEURNZD.
The “8CP Visualization Indicator” includesOceania version,London version,NewYork version,AnyCP version. This time, I used theAnyCP version.
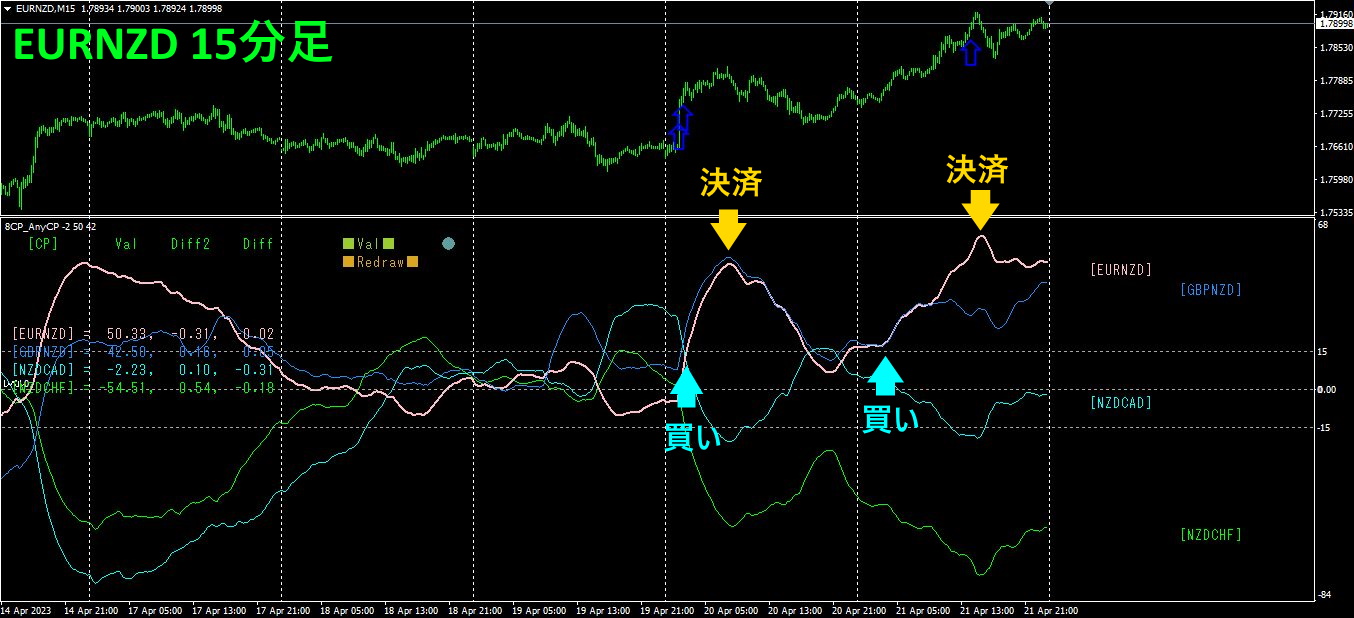
The upper half is the 15-minute chart ofEURNZD. The arrows in the upper half indicate the alert positions of the “28 Currency Pair List Indicator.” The lower half is from the “8CP Visualization Indicator.” The pink thick line graph corresponds toEURNZD.
We entered a buy when the graph rose on Thursday and Friday, and exited when the graph reached a peak. Thursday yielded about40pips, Friday about90pips, totalingabout130pips of profit.
2. Best SelectTry the indicator
The following figure is a screenshot taken on2023 year4 month20 day23:11JST)
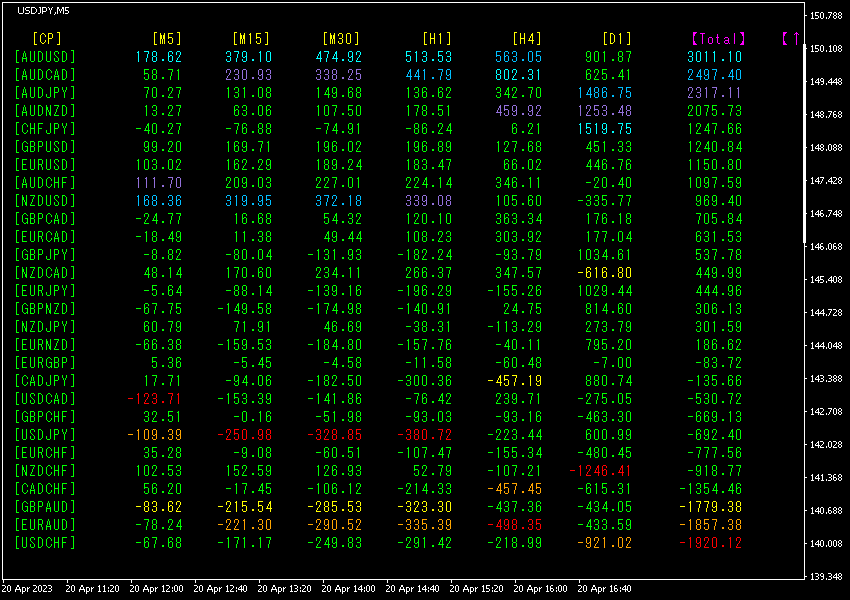
[Total] The numbers are sorted in descending order. The top row, AUDUSD, shows blue coloring on all timeframes except for [D1]. The Total value is 3011.10, a large positive figure, indicating a strong uptrend in AUDUSD.
Let’s take a look at the AUDUSD chart.
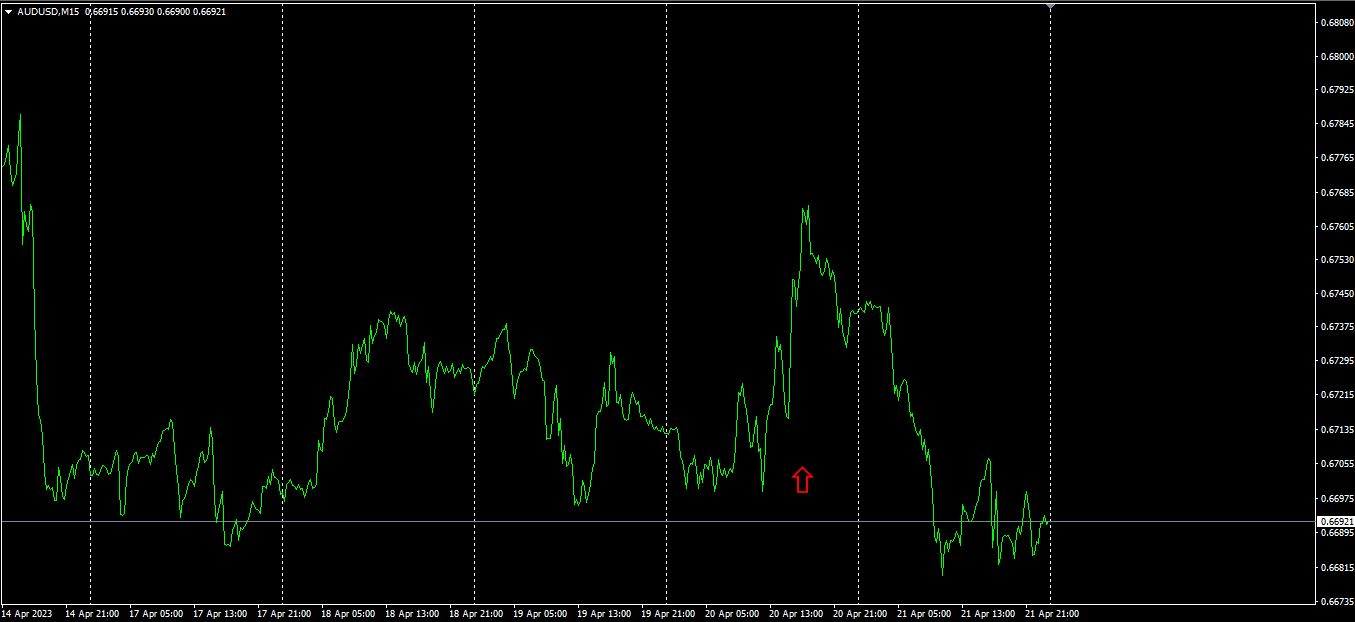
The red arrows mark where the screenshot was taken. While it did capture the uptrend accurately, it then declined. Among all 28 currency pairs, the Best Select Indicator tells which one has the strongest trend, but it does not predict what happens next. If you had bought here, you would have been stopped out. This highlights the difficulty and unpredictability of markets. This is why setting a stop loss is essential in trading. Indicator”
“28 Currency Pair Best Select
https://www.gogojungle.co.jp/tools/indicators/35128
3. What happened to EURJPY, which I have been tracking since May of the year before last?
year5 month,
To view the overall trend, a 30-minute chart showing about the most recent3 weeks is drawn.
Previously I wrote the following.
EUR is rising,JPY is falling. If this trend continues,EURJPY is expected to rise.
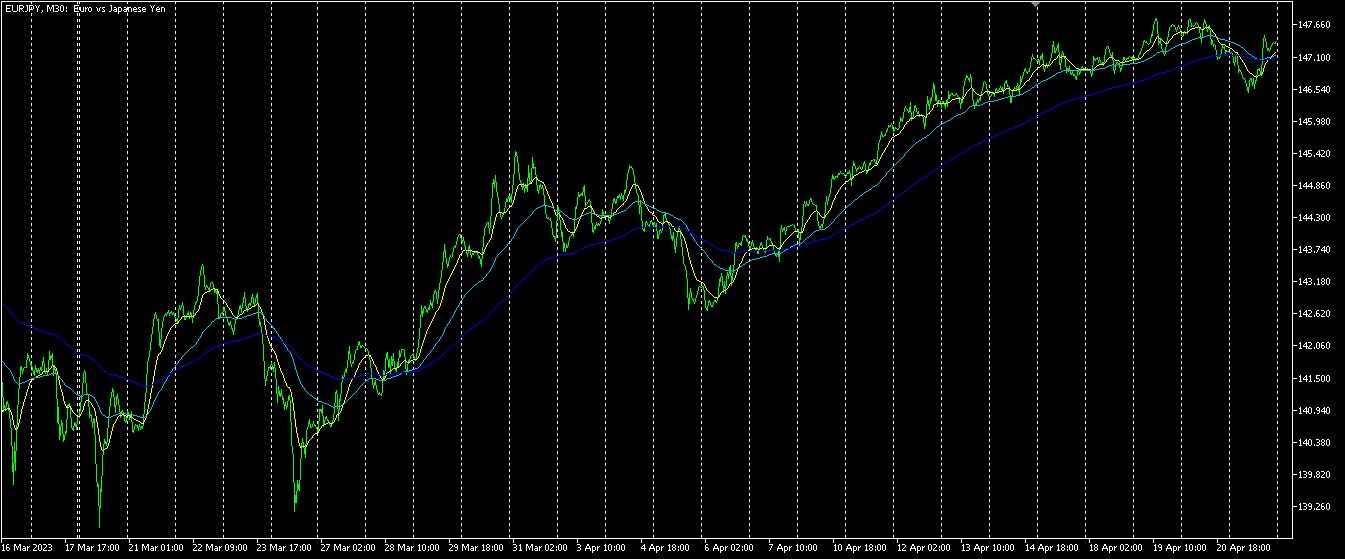
It is gradually increasing.
4 hour-by-hour currency strength chart.
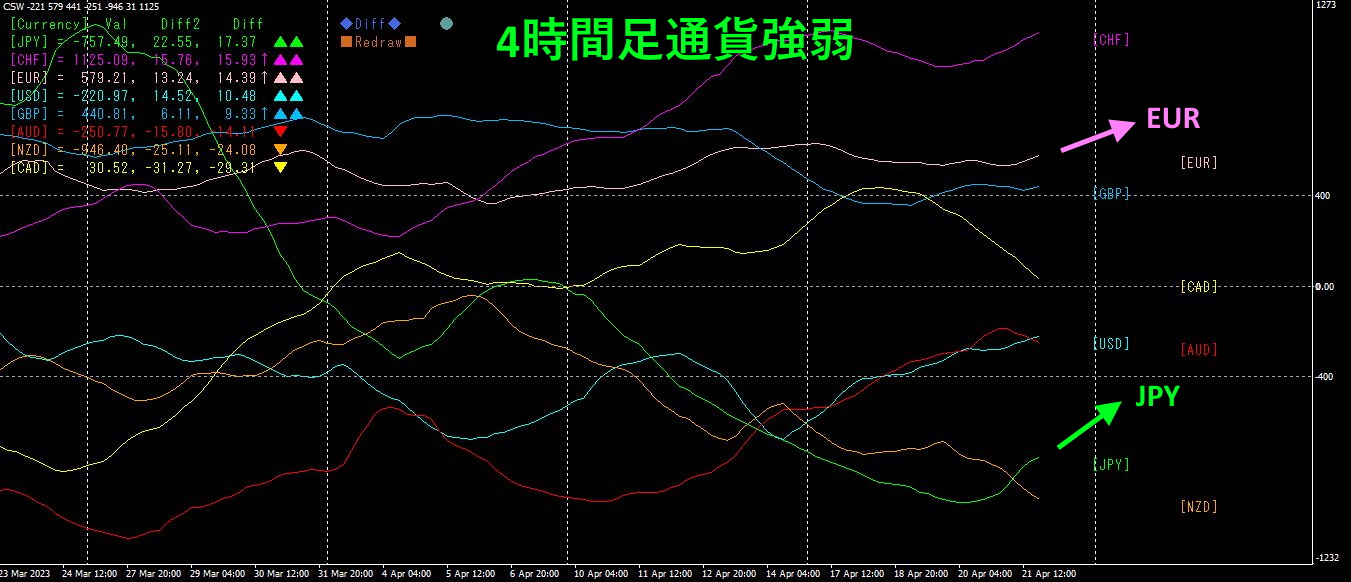
Pink indicatesEUR, green indicatesJPY. Both EUR and JPY are rising. Compared, the slope ofJPY is steeper than that ofEUR, so if this continues, expectEURJPY to move downward.
4. Find highs and lows across all currency pairs and build a trend strategy (continued)
Last time,
the triangle consolidation was broken to the upside.
It hit the horizontal resistance/support line drawn in red and bounced downward. If it had broken above this horizontal line, we would trade long.
That’s what I wrote.
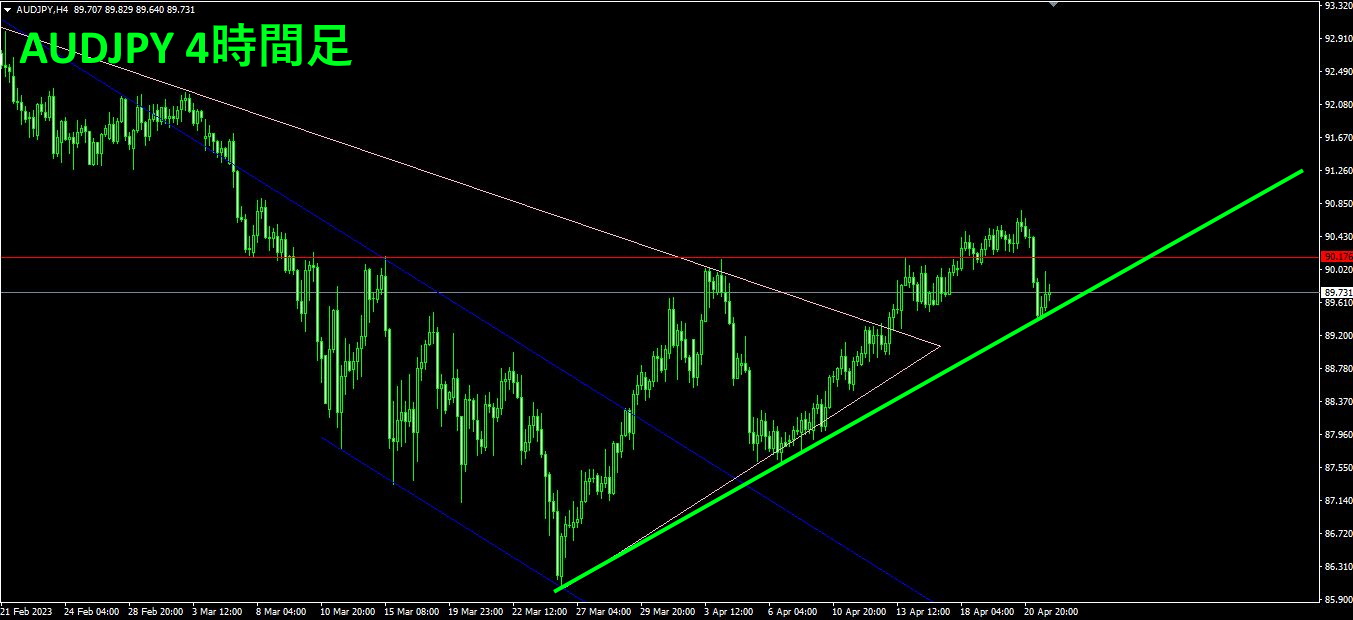
The red horizontal line was temporarily broken to the upside, but then pulled back. I redrawn the green thick diagonal trend line. Since a bottom has already formed and the trend is reversing, it is expected to move upward. The green “buy when the rising trend line is touched or reversed upward” is a suitable trading strategy.
If you have “Trend Line EX,” you can use the touch-reverse entry feature.
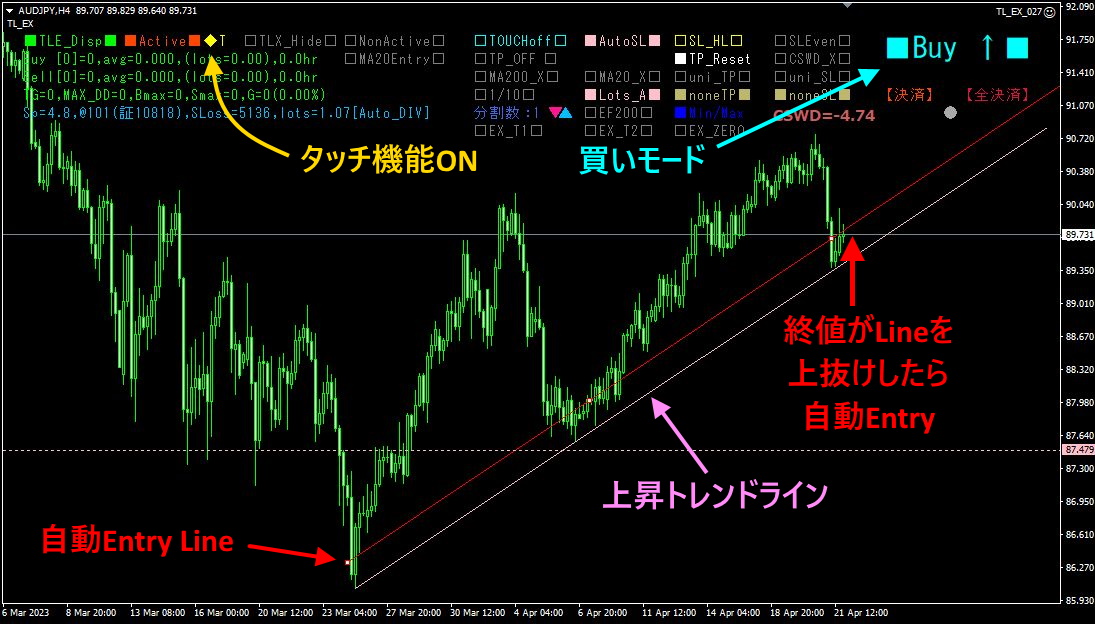
Set the mode to buy and turn the touch-reverse entry featureON. Draw an automatic Entry Line slightly above the rising trend line; when the closing price breaks above this line, an automatic entry is triggered.
※“Trend Line EX

https://www.gogojungle.co.jp/tools/indicators/42257
If you are interested in the “8C Currency Strength Visualization Indicator,” please refer to the following page.
MT4 version https://www.gogojungle.co.jp/tools/indicators/39150
version https://www.gogojungle.co.jp/tools/indicators/39159
【My listed products】


