

Utilization of the "Visualization Indicator" (Part 90)
“Visualization Indicator” usage (part90)
1. Further evolve the “28 Currency Pairs List Indicator” into an indicator
“8CPVisualization Indicator”forAUDUSD charting
There are Oceania, London, NewYork, and AnyCP versions of the “8CP Visualization Indicator.” This time, I used the Oceania version.
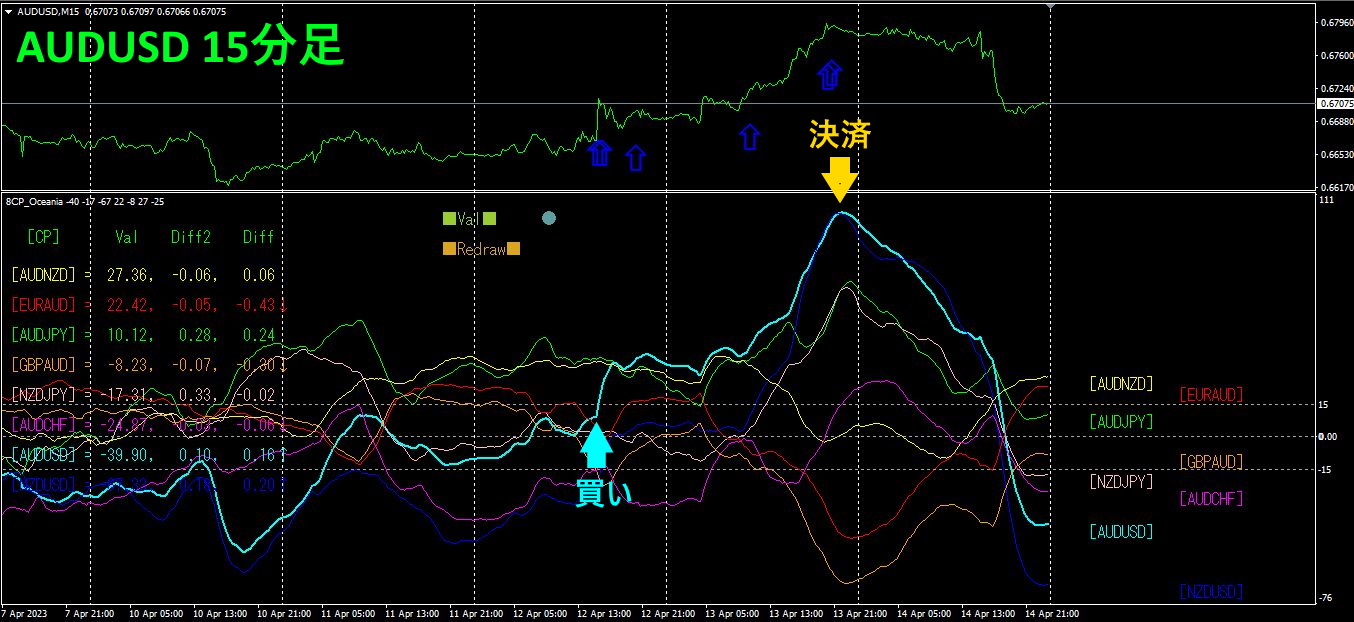
The top half is the 15-minute chart of AUDUSD. The arrows in the top half indicate the alert positions of the “28 Currency Pairs List Indicator.” The bottom half is from the “8CP Visualization Indicator.” The light blue thick line graph corresponds to AUDUSD.
I bought on Wednesday and closed on Thursday for a profit of about90pips.
2. Indicator trial
The diagram below is a screenshot taken onApril 12, 2023 at 00:11(JST).
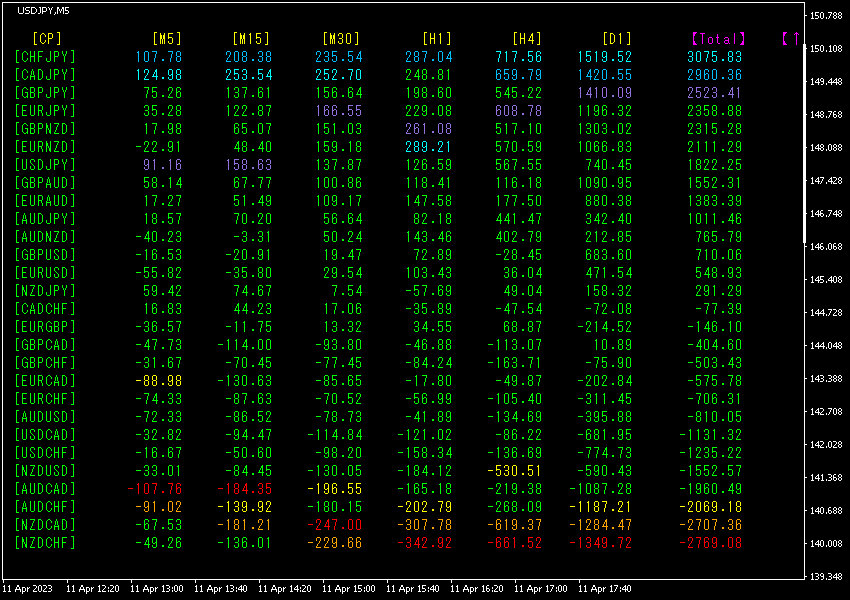
[Total]Sort by value in descending order. The top row’s CHFJPY shows blue across all timeframes. The Total value is3075.83, a large positive figure. This indicates a strong uptrend in CHFJPY.
Now, let’s look at the CHFJPY chart.
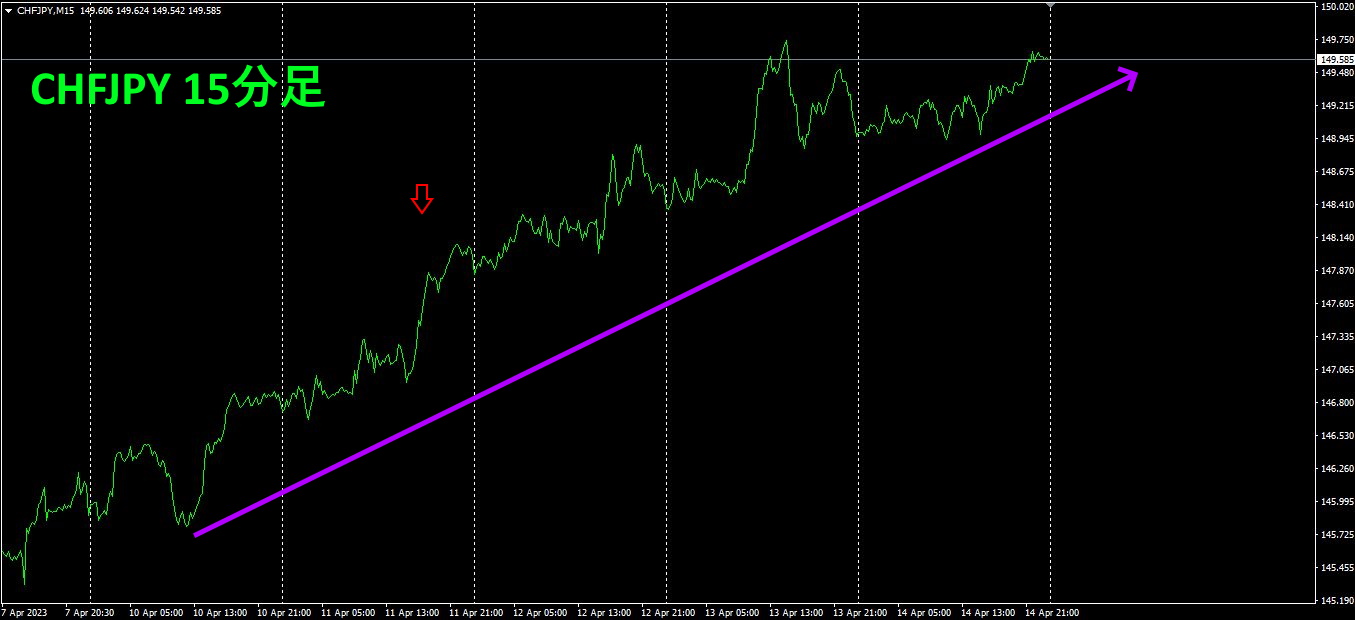
The red arrows mark the captured screenshot. A very clean uptrend with a rising slope continues. In that case, simply buying yields profit. Bought on Tuesday and closed on Thursday for about200pips of profit.
If you use the “28 Currency Pairs Best Select Indicator,” among all 28 currency pairs, it accurately shows which currency is currently exhibiting the strongest trend, so you can just read the overall chart and trade, making trading very easy.
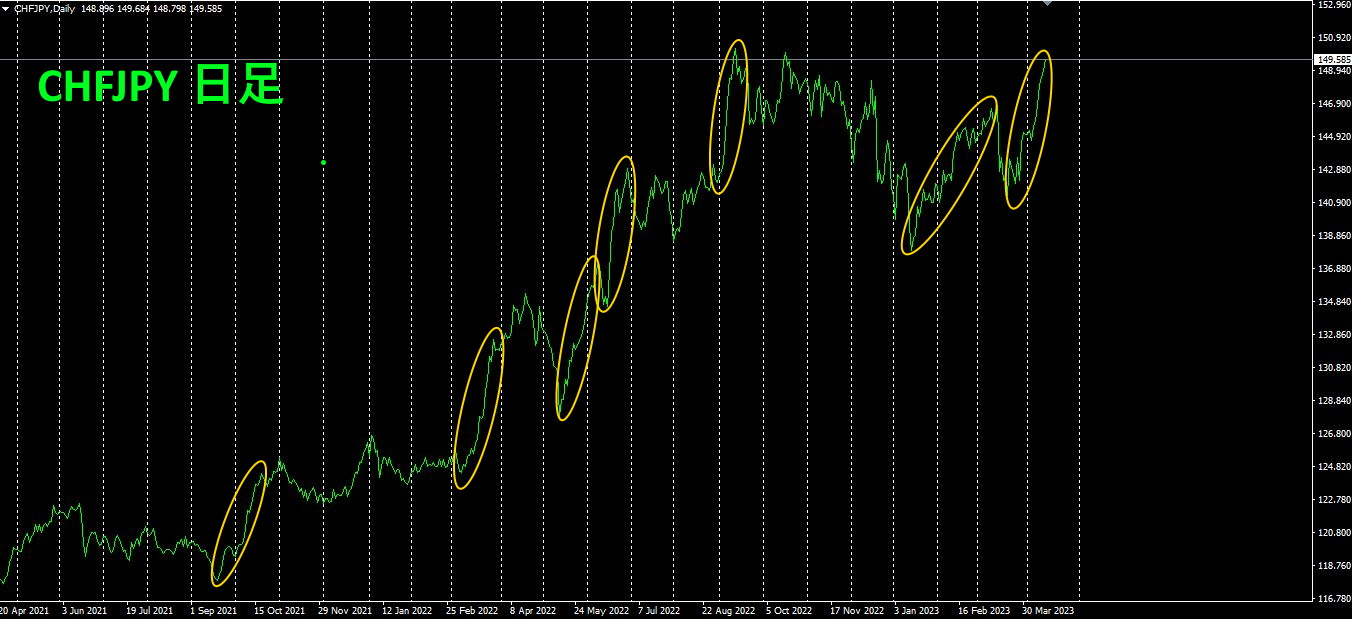
In the upper diagram, the yellow oval marks the “delicious uptrend” portion. The upward angle is steep, and the magnitude of the rise for each is about600–800
“Only take the delicious parts of the market” becomes possible with the “28 Currency Pairs Best Select Indicator.”
“28 Currency Pairs Best Select Indicator”

https://www.gogojungle.co.jp/tools/indicators/35128
3. What happened to EURJPY, which has been tracked since the previous year May?
Since May 2021, I have tracked the movement of EURJPY.
For an overview, I’ve drawn about three weeks of data on the 30-minute chart.
Last time I wrote, the following was the case.
showed a decline, showed an uptrend. If this continues, EURJPY is expected to move lower.
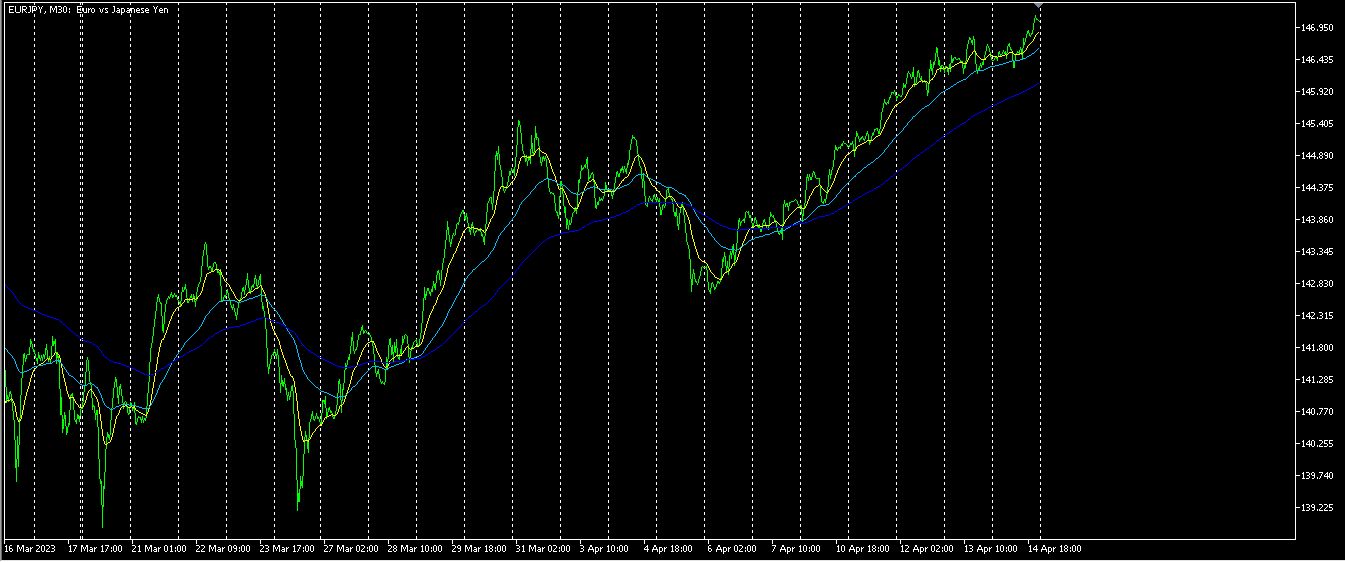
The price rose instead. The previous forecast was incorrect.
Hour-by-hour currency strength chart.
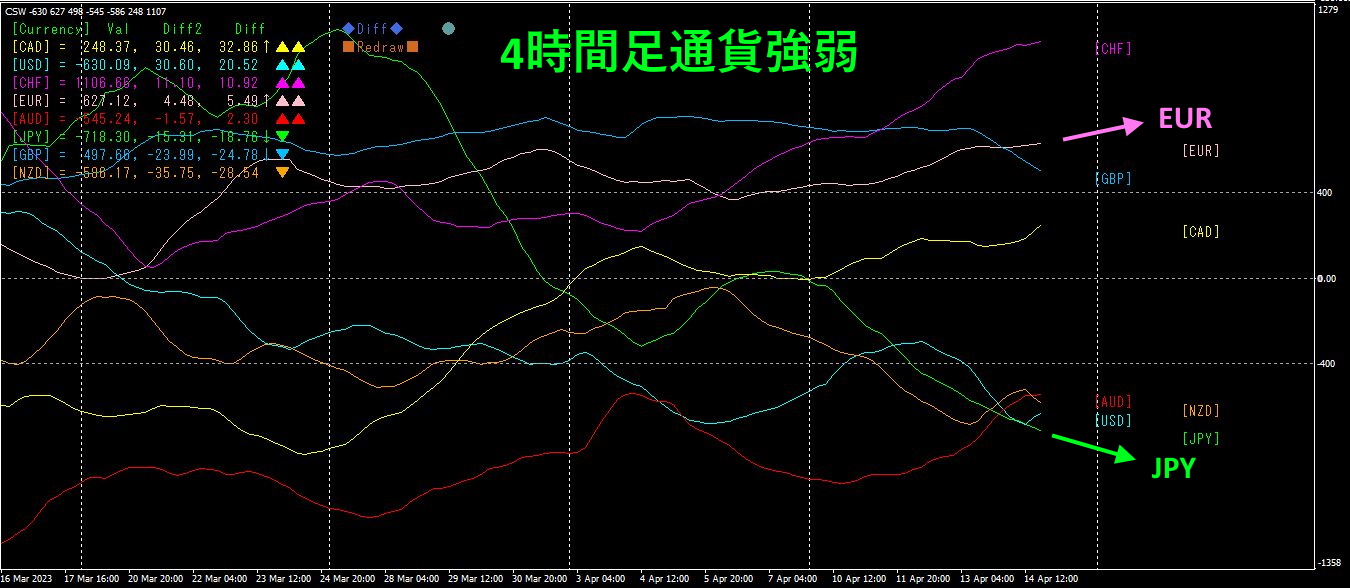
Pink isEUR, green isJPY. EUR is rising, JPY is falling. If this trend continues, EURJPY is expected to rise.
4. Identify tops and bottoms across all currency pairs and formulate a trend strategy (continuation from the prior discussions)
Previously, in the Visualization Indicator series’ “Top and Bottom Search Indicator,” I found that AUDJPY was near a bottom among the 28 currency pairs.
Previously, I used the “Trend Line EX” to set an automatic buy entry when the diagonal trend line was broken, and left it running.
Last time, with the Trend Line EX line settlement feature, I earned about100pips of profit.
Now, let’s view the current 4-hour chart.
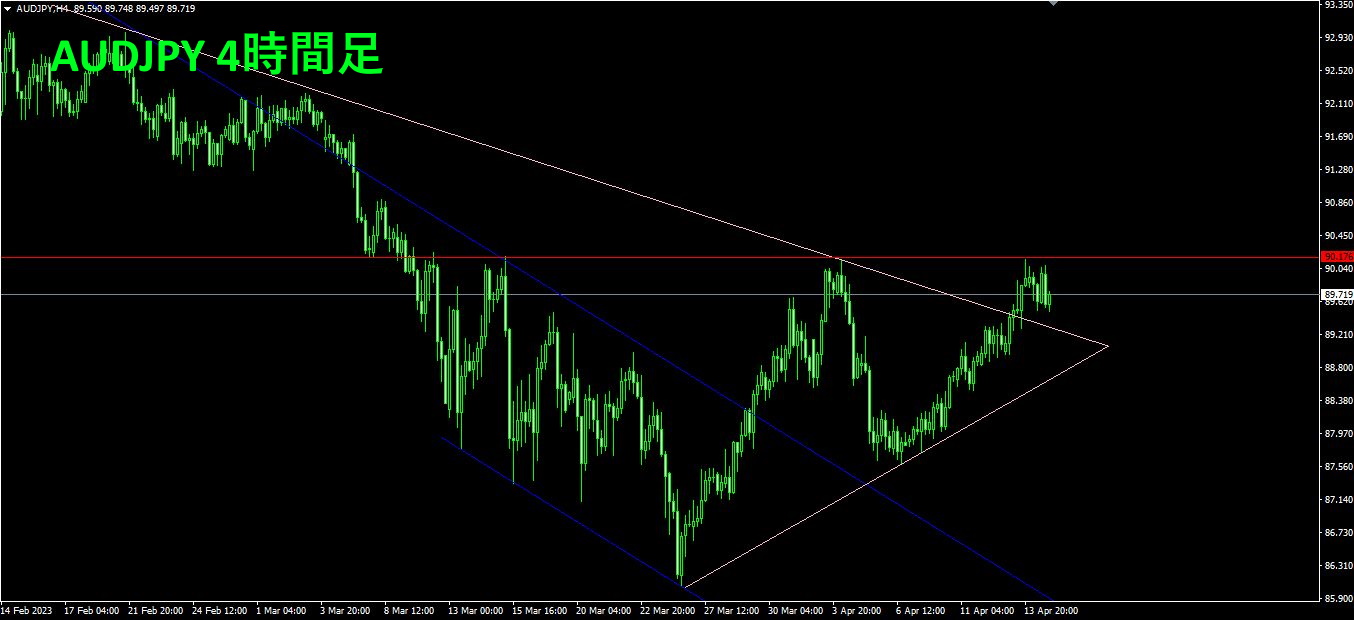
The price has broken out of the triangle consolidation to the upside.
It hit the red horizontal resistance/support line and bounced downward. If it breaks above this horizontal line, we should trade long.
If you are interested in the “8C Currency Strength Visualization Indicator,” please refer to the page below.
MT4 version https://www.gogojungle.co.jp/tools/indicators/39150
MT5 version https://www.gogojungle.co.jp/tools/indicators/39159
【My current products for sale】


