

Today (4/12) the ironclad entry point! (USDJPY)
All-in-one for FX, binary options, and Nikkei 225!
Indicator for MetaTrader (MT4)

Today's ironclad entry point (4/12)!
(USDJPY)
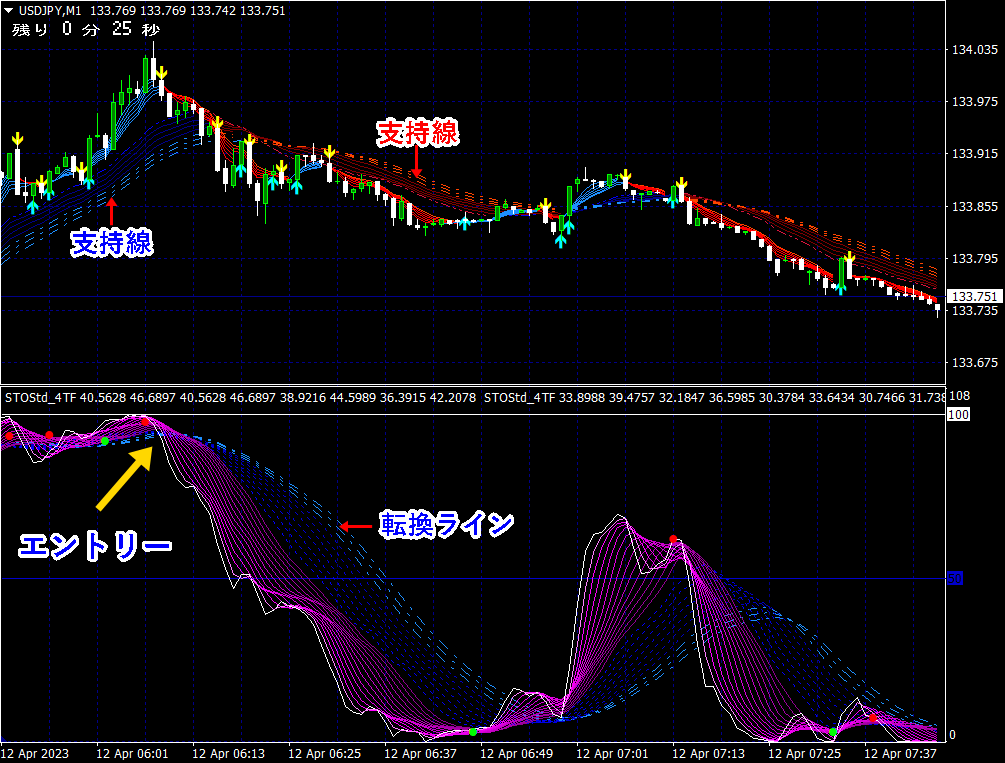
★Break above/below the turning line to enter! (Click image to enlarge)Among the many moving averages, in an uptrend,there are certain lines that act assupport lines that function effectively aslines with a fixed widthduring pullbacks.Similarly, in a downtrend,there are lines that function effectively asresistance lines (lines with a fixed width)that act assupport during retracements.In other words, if prices do not stop at a support line and break, a downtrend begins, andif prices break above a resistance line during a downtrend without being bounced, an uptrend starts.In short,the support and resistance lines become turning lines.This concept also applies to indicators.In the Tenki Chart (Reiwa edition), not only moving averages but alsoindicator curve bandsdisplay turning lines that function assupport lines and resistance lines in an easy-to-understand way.【Tenki Chart (Reiwa版)】Sales page is here【Even with moving averages alone, this is amazing!!】Sales page is here (Click image to enlarge)
Among the many moving averages, in an uptrend,
there are certain lines that act assupport lines that function effectively aslines with a fixed widthduring pullbacks.
Similarly, in a downtrend,
there are lines that function effectively asresistance lines (lines with a fixed width)that act assupport during retracements.
In other words, if prices do not stop at a support line and break, a downtrend begins, and
if prices break above a resistance line during a downtrend without being bounced, an uptrend starts.
In short,the support and resistance lines become turning lines.
This concept also applies to indicators.
In the Tenki Chart (Reiwa edition), not only moving averages but alsoindicator curve bands

【Even with moving averages alone, this is amazing!!】


