

Usage of "Visual Indicator" (Part 89)
Utilization of the "Visualization Indicator" (its89)
1. Further evolution of the "28 Currency Pairs List Indicator" into an indicator
“8CPVisualization Indicator”to drawAUDJPY.
The "8CPVisualization Indicator" includesOceaniaversion,Londonversion,NewYorkversion,AnyCPversion. This time, theOceaniaversion was used.
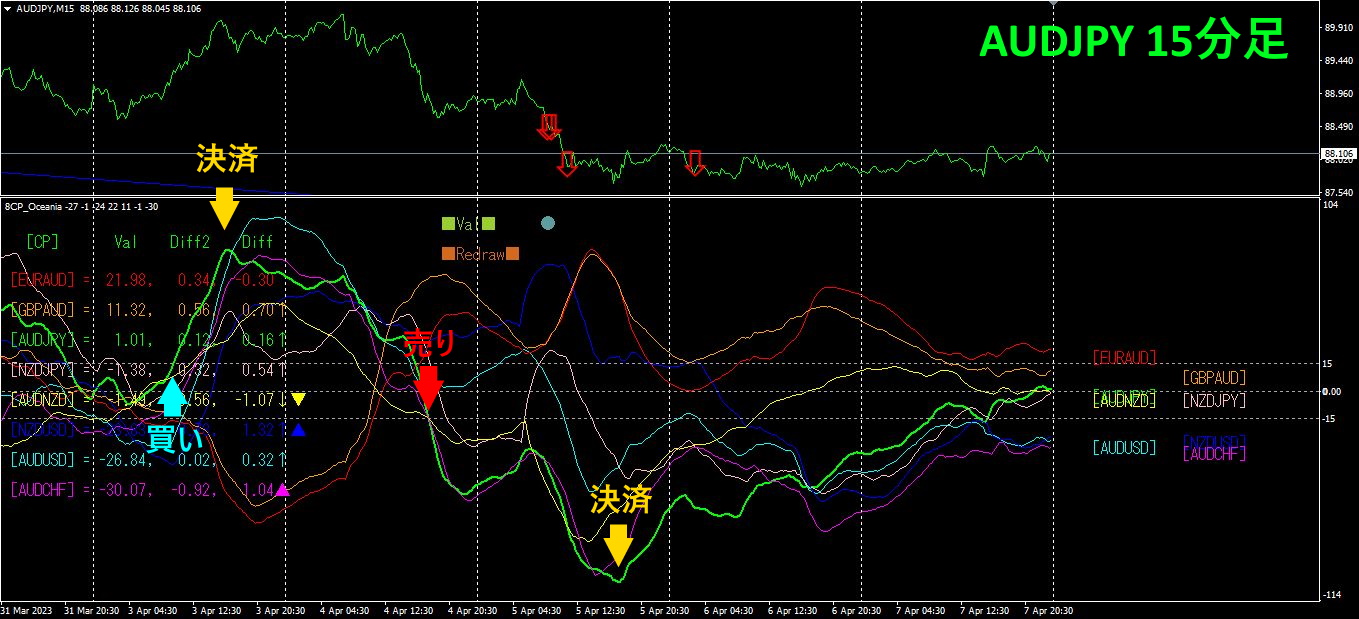
The top half is a 15-minute chart ofAUDJPY. The arrows in the top half indicate the alert positions of the "28 Currency Pairs List Indicator." The bottom half is from the "8CPVisualization Indicator." The green bold line graph corresponds toAUDJPY.
In a week, this yielded two profitable trades. A long entry on Monday with same-day settlement gave about80 pips of profit. A short entry on Tuesday with Wednesday settlement yielded about105 pips, totalingabout185 pips of profit.
2. Best SelectTry the Indicator
The image below is a screenshot taken on2023 year4 month7 day00:10 (JST)
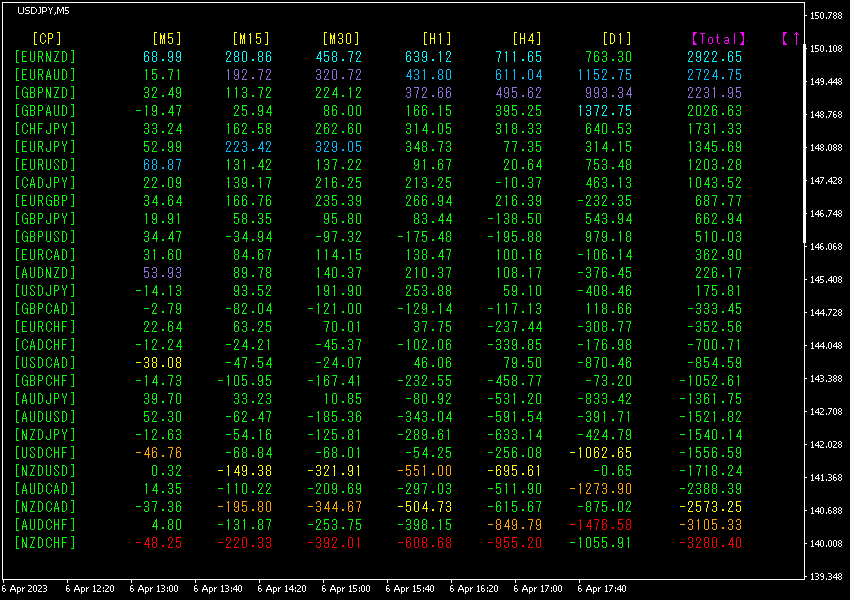
[Total]The numbers are sorted in descending order. The bottom row'sNZDCHF shows[D1] and all numbers except for D1 are displayed in red. The value of Total is-3280.40, a large negative value, indicating a downward trend for NZDCHF. shows a downward trend.
Now, let's look at the NZDCHF chart.NZDCHF chart shows the recent price movement.
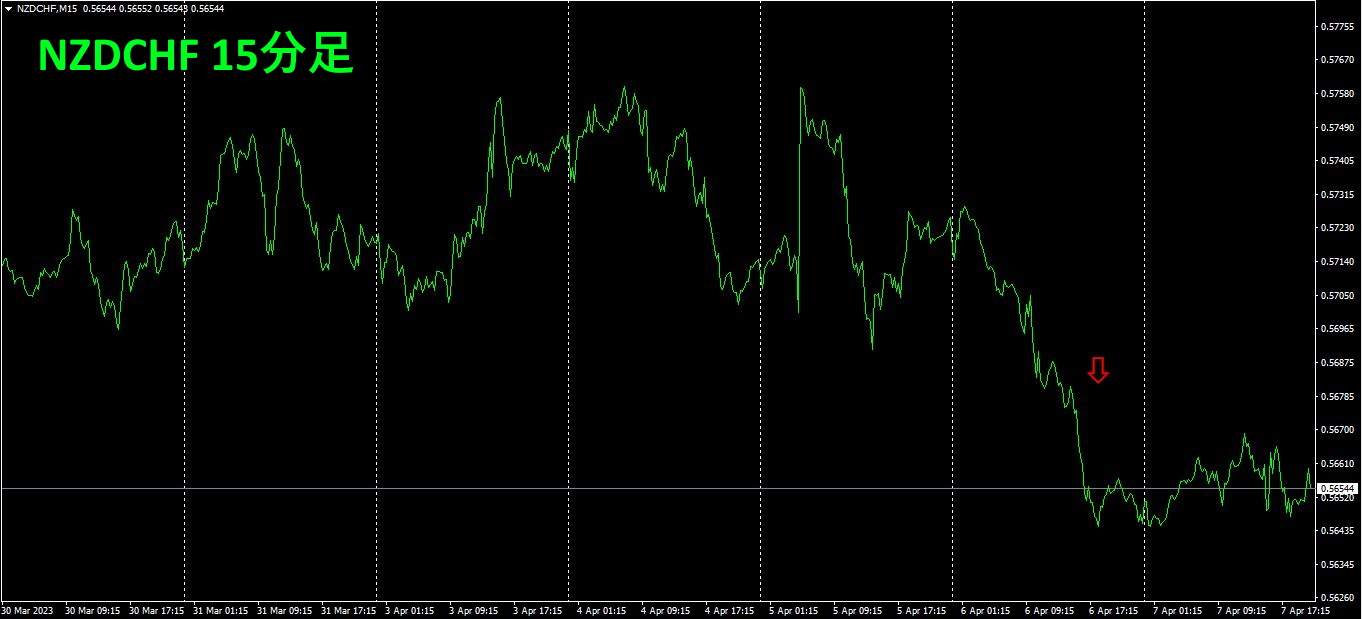
By looking at the overall movement on a higher timeframe, this issue is somewhat resolved.
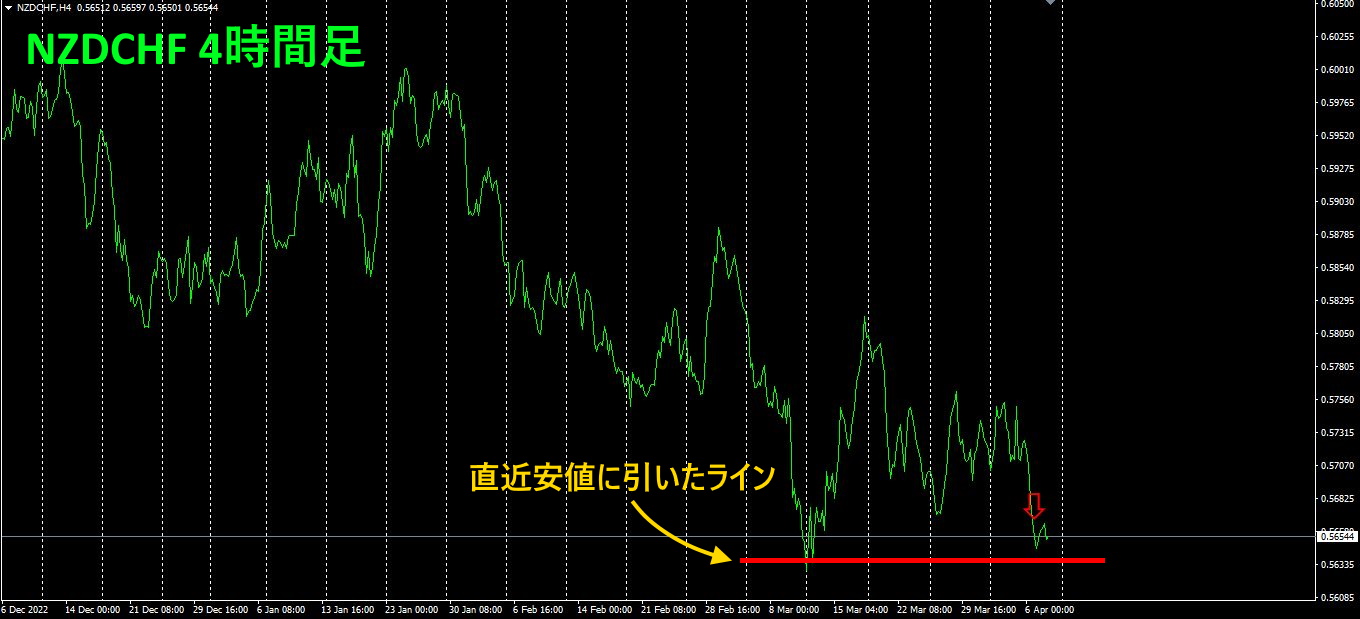
Next is the 4-hour chart of NZDCHF,NZDCHF. A horizontal line has been drawn at the recent low. In this market environment, it is unlikely to drop significantly further from the red-arrow position.
3. Since May of the year before last, what happened with EURJPY?
From May2021 year5EURJPY has been tracked.
To see the overall trend,30-minute chart covers about the last3 weeks.
Last time, I wrote the following.
EUR is down, is also down. In terms of angles, appears to be slightly steeper. If this trend continues, is expected to move down weakly.
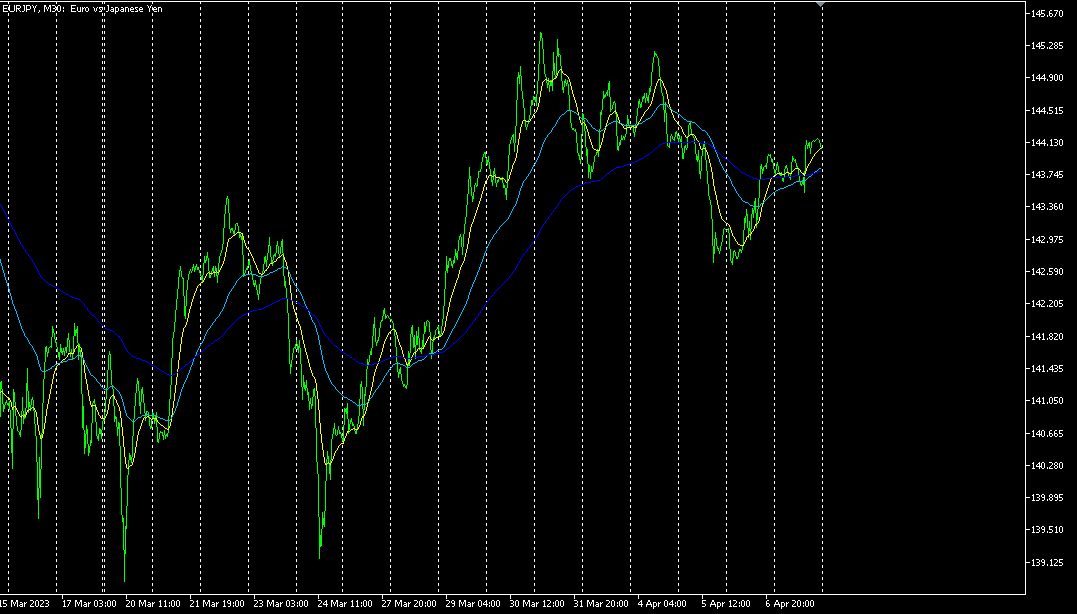
As expected, it moved lower.
4-hour currency strength chart.
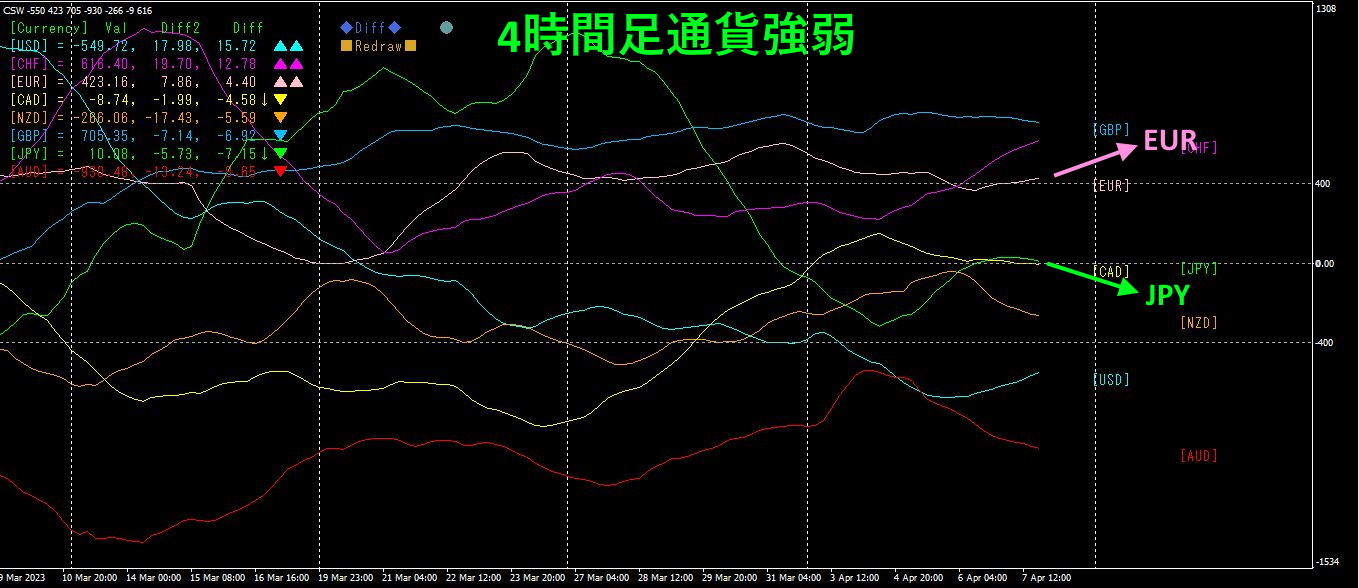
Pink showsEUR, green showsJPY. EUR is downward, JPY is upward. If this trend continues, is expected to move down.
4. Find extremities from all currency pairs and build a trend strategy (continuation from the previous section)
Earlier, using the “Visualization Indicator” series' “Extremum Search Indicator,” I found that among the 28 currency pairs,AUDJPY was near a bottom.
Last time, using “Trend Line EX,” I set it to automatically buy when the diagonal trend line was broken upward and leave it. So, what happened?
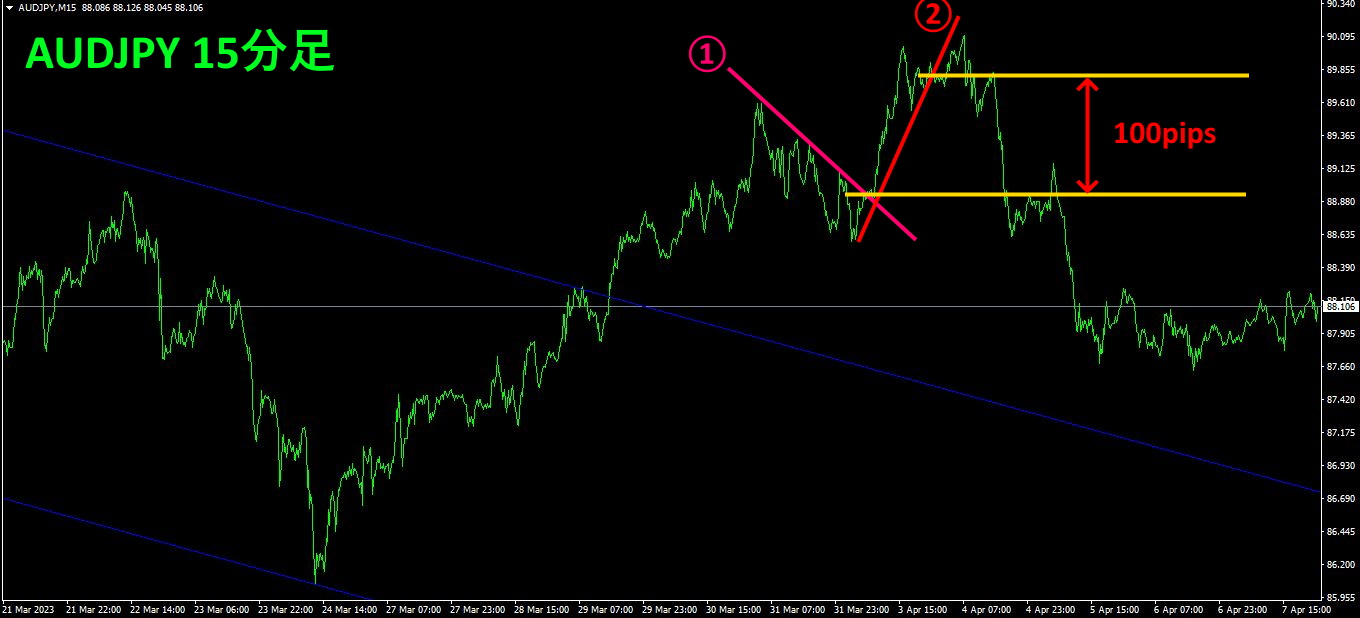
I bought when Trend Line ① was broken upward and closed when Trend Line ② was broken downward. I gained about
Since then, the rate has eased a bit and entered a range. I plan to wait for another upward breakout and then trade by buying (patience is important in trading).
If you are interested in the “8C Currency Strength Visualization Indicator,” please refer to the pages below.
MT4 Version https://www.gogojungle.co.jp/tools/indicators/39150
MT5 Version https://www.gogojungle.co.jp/tools/indicators/39159
【My listed products】


