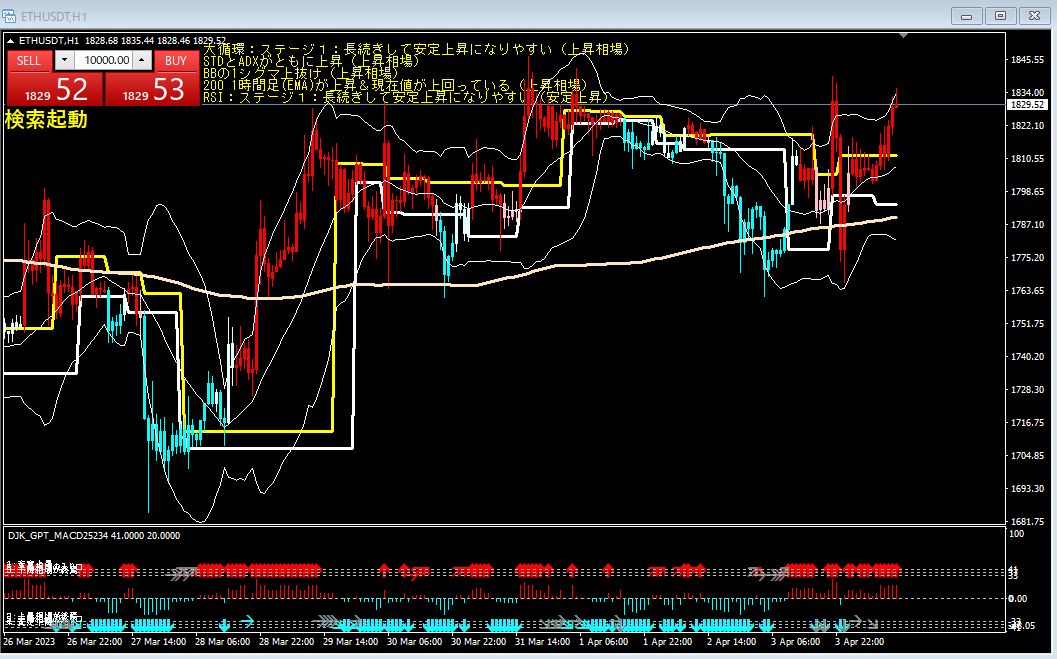
ETHUSDT 1-hour chart Analysis as of 19:10 on April 4
ETHUSDT 1-Hour Chart, analysis as of April 4 at 19:10.
Currently, the following conditions are met.
- Standard deviation range and ADX both rising (bullish trend)
- Break above BB by 1 sigma
- 200-hour EMA rising and current price above it
- RSI: Stage 1 tends to stay extended and rise steadily
- Macro cycle: Stage 1 tends to stay extended and rise steadily
These conditions indicate strong buying pressure. A trend-following strategy is effective.
Trading decisions are as follows.
- Buy: after breaking above BB by 1 sigma and RSI exceeds 70
- Sell: after breaking below BB by 1 sigma and RSI falls below 30
Trade timing is as follows.
- Buy: when the current price is above the 200-hour EMA and macro cycle is in Stage 1
- Sell: when the current price is below the 200-hour EMA and macro cycle is in Stage 3
That is the analysis for ETHUSDT on the 1-hour chart as of 19:10 on April 4. I hope you find it helpful.
× ![]()