

Today's (4/3) main entry point! (USDJPY)
All-in-one for FX, binary options, and Nikkei 225!
Indicator for MetaTrader (MT4)

Today's unbeatable entry point (Apr 3)!
(USDJPY)
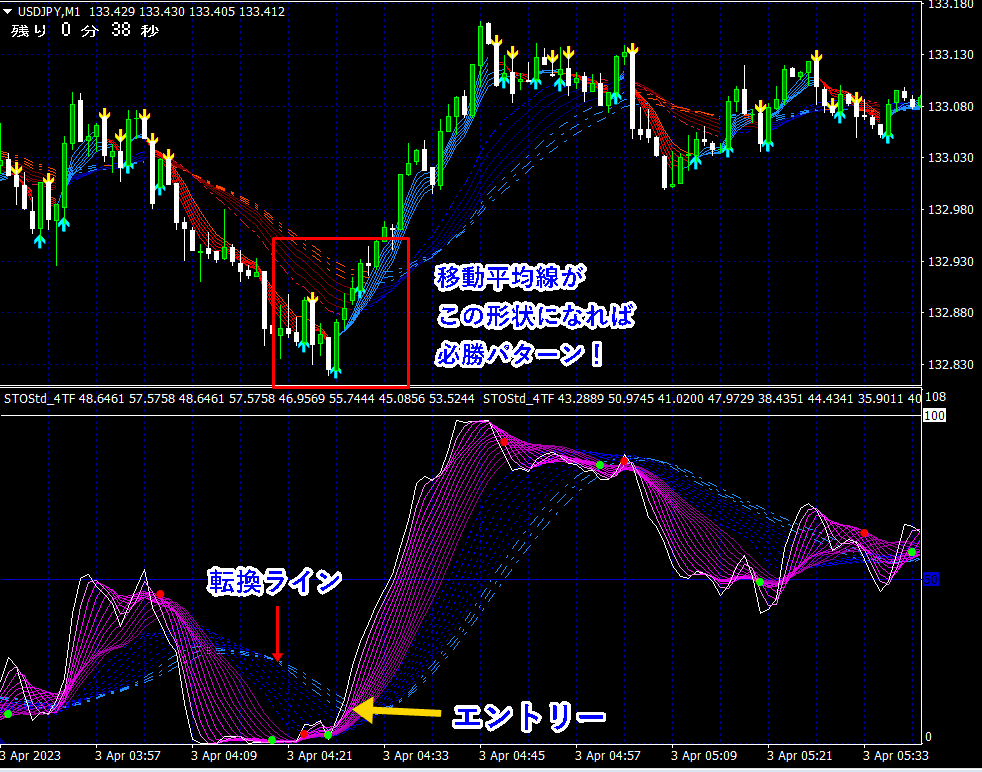
★Break above/below the turning line to enter! (Click image to enlarge) entry!Among the many moving averages, in an uptrend,there are certain width lines thatfunction effectively as support lines during pullbacks.Also, in a downtrend,there are certain width lines thatfunction effectively as resistance lines. resisting pullbacksIn other words, if in an uptrend the price breaks through the support line, a decline begins, andin a downtrend, if it breaks above the resistance line without bouncing, an uptrend begins.In short,the support and resistance lines become turning lines.This concept also applies to indicators.In the Tenka Chart (Reiwa edition), lines are shown not only for moving averages butalso for the indicator curvesso that support lines and resistance lines = turning linesare clearly displayed..【Tenka Chart (Reiwa edition)】Sales page is here【Even with just moving averages, this amazing!!】Sales page is here
Among the many moving averages, in an uptrend,
there are certain width lines thatfunction effectively as support lines during pullbacks.
Also, in a downtrend,
there are certain width lines thatfunction effectively as resistance lines.
In other words, if in an uptrend the price breaks through the support line, a decline begins, and
in a downtrend, if it breaks above the resistance line without bouncing, an uptrend begins.
In short,the support and resistance lines become turning lines.
This concept also applies to indicators.
In the Tenka Chart (Reiwa edition), lines are shown not only for moving averages butalso for the indicator curves

【Even with just moving averages, this amazing!!】


