

Usage of the "Visualization Indicator" (Part 88)
“Visualization Indicator” utilization (part88)
1. Further evolve the “28 Currency Pair List Indicator” into an indicator
“8CPVisualization Indicator”to drawCADJPY.
The “8CPVisualization Indicator” includesOceania version,London version,NewYork version,AnyCP version. This time, I used theNewYork version.
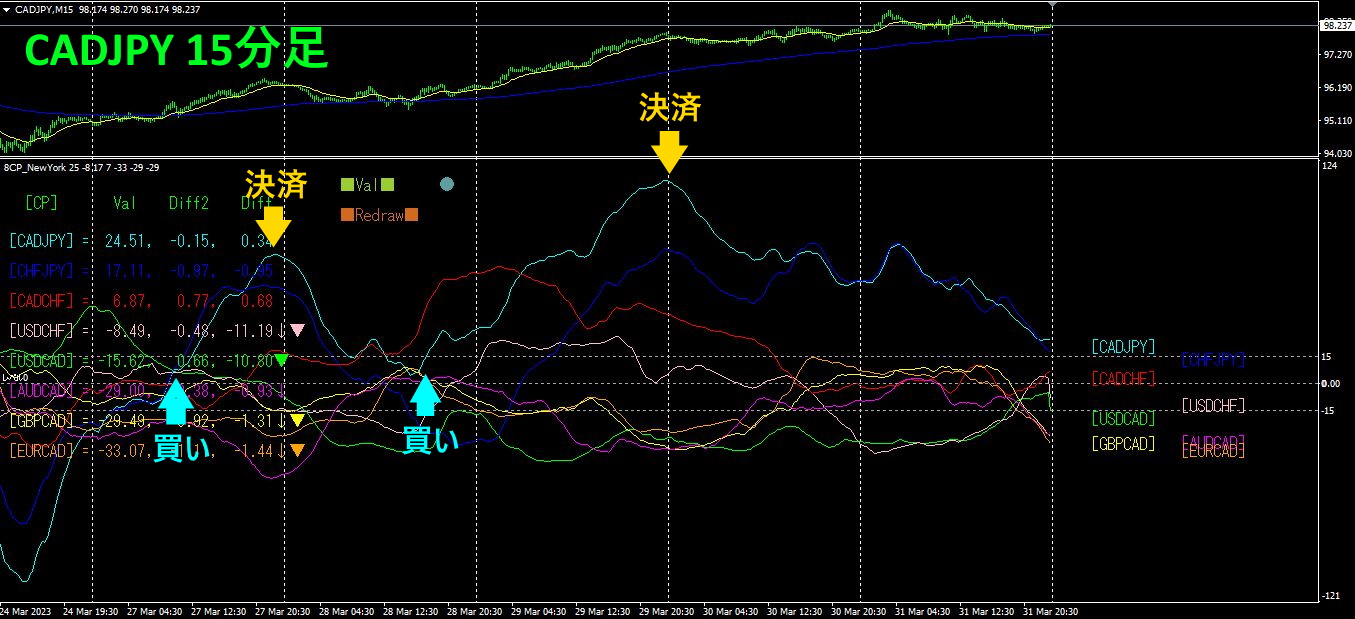
The top half is theCADJPY 15-minute chart. In the bottom half, the “8CPVisualization Indicator” is displayed. The light blue thick line graph corresponds toCADJPY.
If you entered a buy on Monday and settled that day, and then made a second buy on Tuesday and settled on Wednesday, you would have a total profit ofabout260 pips. of profit.
2. Best SelectTry the indicator
The image below is a screenshot taken atMarch,31,09:05(JST).
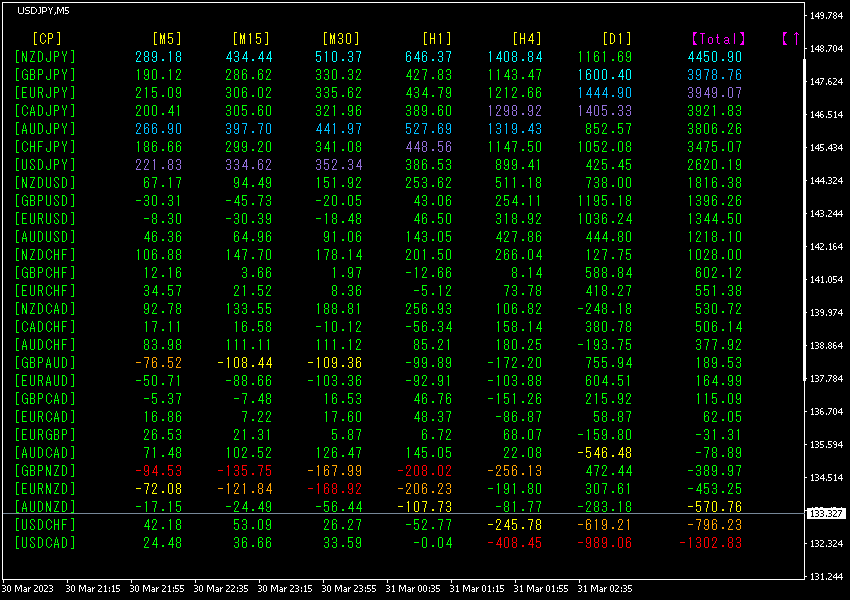
[Total]Sorted in descending numerical order. The top rowNZDJPY shows all digits in light blue except for the [D1] value. value is4450.90, a large positive number. indicates an upward trend.
Now, let's look at the NZDJPY chart.
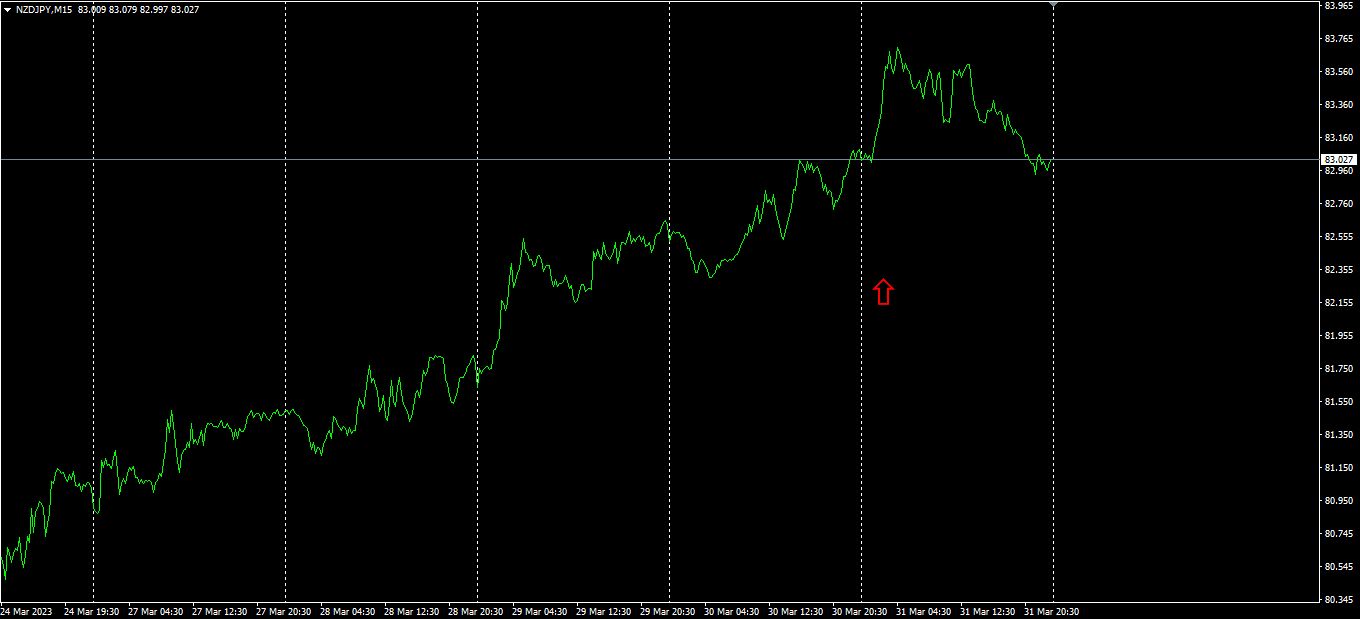
The red arrows indicate the screenshot position. It captures a steep rise in the middle of an uptrend. If you place a buy position here, you can secure a solid profit.
Trading is about repeatedly aiming for profitable points and securing profits without greed. It is also important to strictly not trade during other times.
3. Since May of the year before last, EURJPY trends—what happened?
Since May,2021,EURJPY
To see the overall trend, a30-minute chart covering roughly the last3 weeks is drawn.
Last time, it was written as follows.
EUR is decreasing, is increasing. If this trend continues,EURJPY is expected to go down.
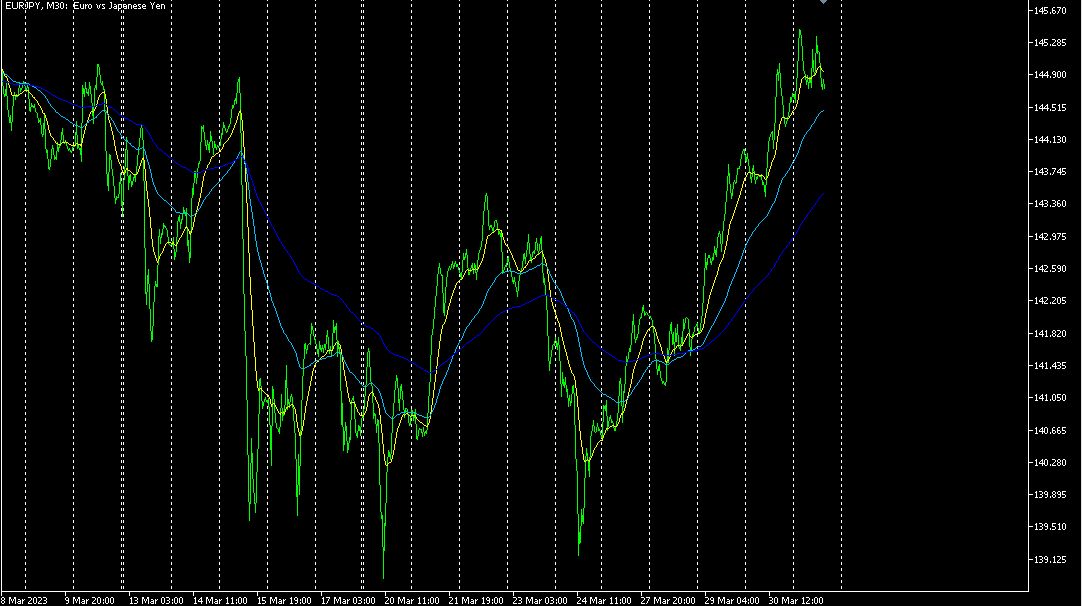
Last weekend's forecast contradicted and rose.
4-hour currency strength chart.
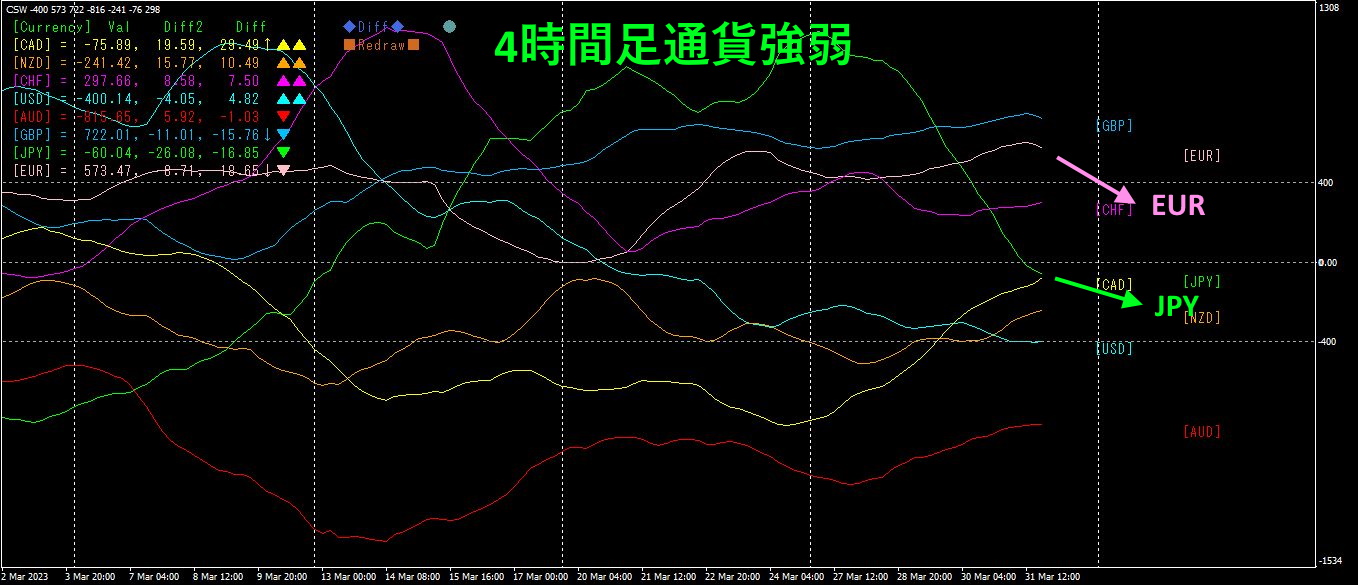
Pink isEUR, green isJPY.EUR also declined,JPY seems slightly steeper. If this trend continues, is expected to head lower.
4. Find tops and bottoms from all currency pairs and build a trend strategy (continuation from last time)
Last time, using the “Visible Indicator” series’ “Tops and BottomsSearch Indicator,” among 28 currency pairs, found thatAUDJPY was near a bottom.
Previous description
AUDJPY is at a bottom, but still in a downtrend. The key level around may act as resistance, but if broken below, it could decline further; conversely, it might rebound from here. Thus, two scenarios are possible.
AUDJPY1hour chart.
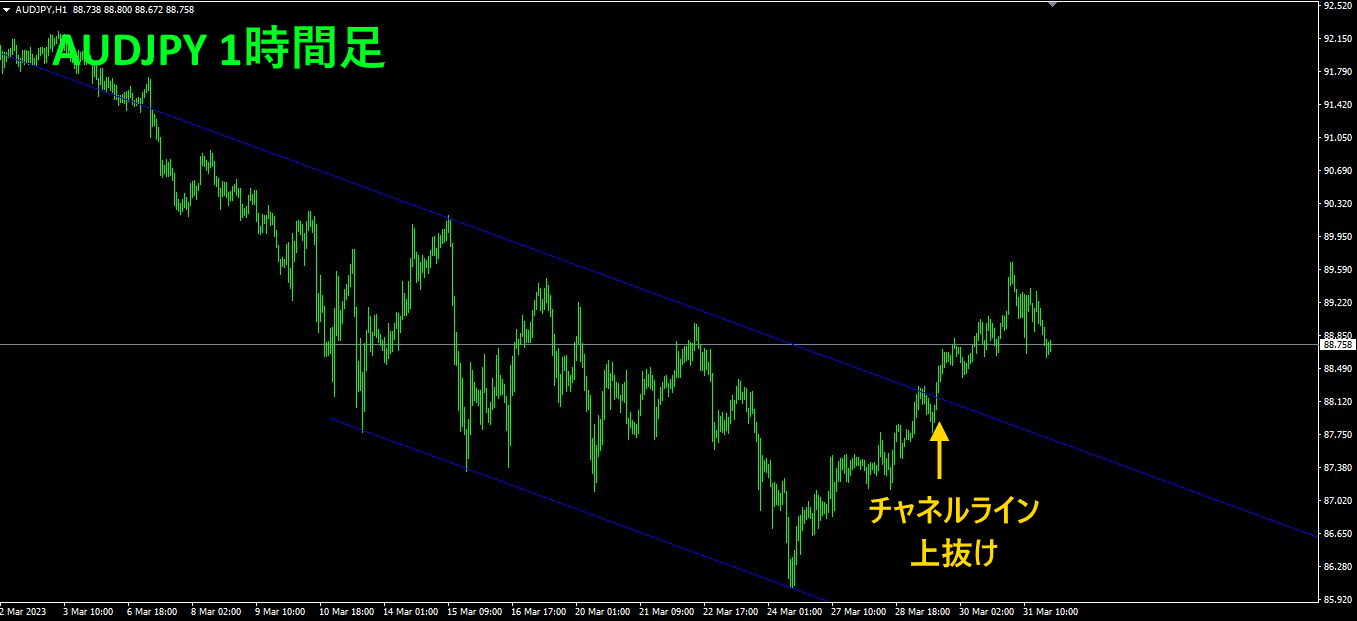
It has broken above the channel line. Those who entered sells previously were stopped out, but the stop-loss was contained within a few tens ofpips. Since the downtrend has ended, we will follow with a bullish bias. The target is to ride a reversal from the pullback to achieve a large number of pips, so we will place buy positions on pullbacks.
With the “Trend Line EX” you can perform trades as follows.
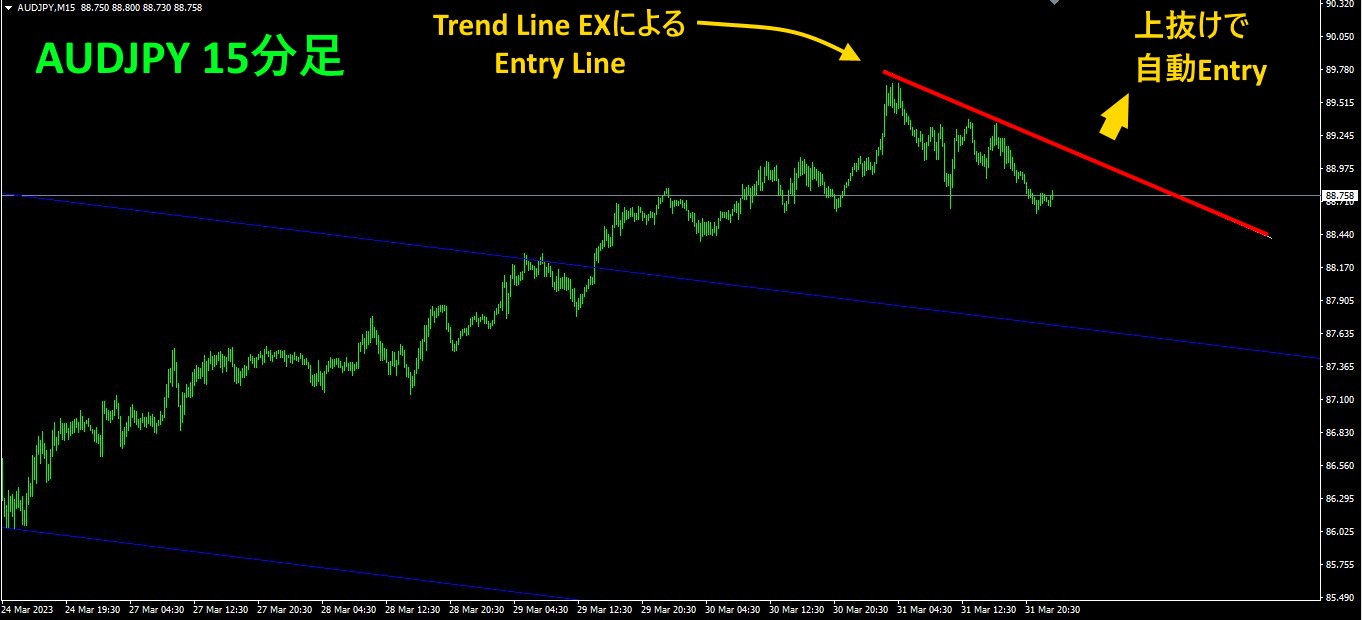
Place a buy and then simply let it run automatically to enter trades.
※“Trend Line EX

https://www.gogojungle.co.jp/tools/indicators/42257
If you are interested in the “8C Currency Strength Visualization Indicator,” please refer to the following page.
MT4 version https://www.gogojungle.co.jp/tools/indicators/39150
MT5 version https://www.gogojungle.co.jp/tools/indicators/39159
【My items for sale】


