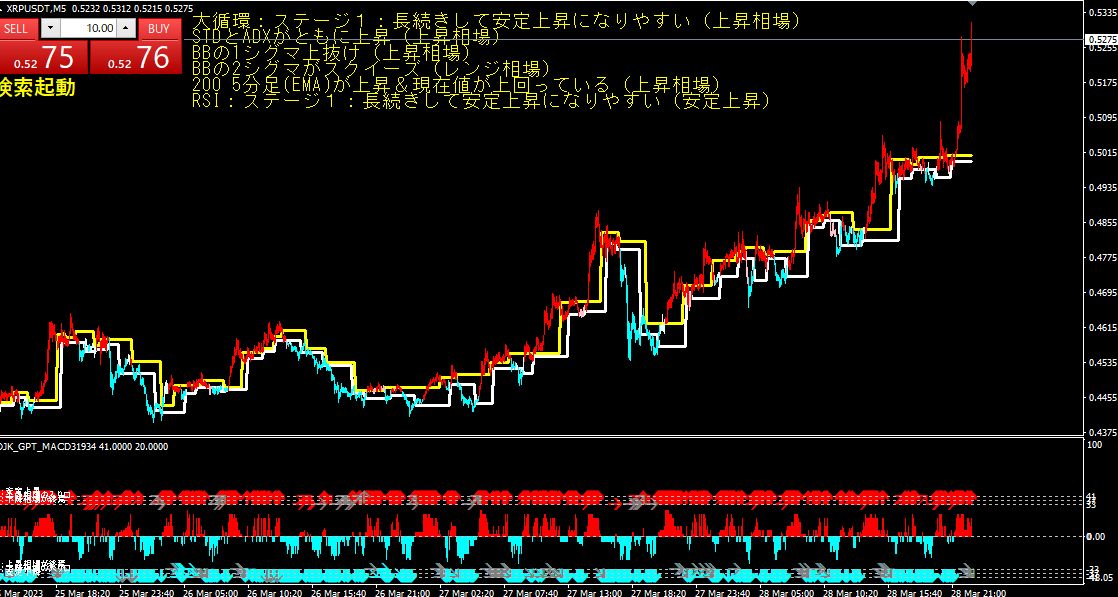
XRPUSDT 5-minute chart March 29th 4:38 AM Buy
The fact that both the standard deviation range and the ADX are rising indicates
that the bullish trend is strengthening.
A breakout above 1 sigma of the BB indicates that volatility is increasing.
A squeeze of 2 sigma on the BB shows that the market is in a state before determining its direction.
It suggests a situation where the trend is likely to move.
The 200 5-minute EMA is rising and the current price is above it, indicating a medium-term
upward trend.
RSI being in Stage 1 indicates that the market is not in an overbought or oversold state
but is in a stable uptrend.
From these conditions, it can be said that the current environment favors buying.
However, the fact that the BB is squeezing at 2 sigma also suggests a possibility of a sudden market move.
Therefore, when it comes to timing trades, it is necessary to observe the chart carefully and decide.
necessary.
For example, a strategy such as buying more if the price breaks above the BB's 2 sigma could be considered.
× ![]()